

 PDF
PDF ePub
ePub Citation
 Print
Print


Introduction
With attention to the role of diet or medical nutritional therapy on chronic disease, the dietary pattern approach, which involves diet quality indices, has been suggested as a powerful tool because of the complexity of diets [1-3]. In recent decades, several indices have been developed and validated, including the Diet Quality Index (DQI), Healthy Eating Index (HEI), Mediterranean Diet Score, Healthy Diet Indicator (HDI; based on the World Health Organization dietary guidelines), Alternate HEI (AHEI; including American dietary guidelines), and DQI-International (DQI-I; developed for worldwide national dietary guidelines) [4]. The diet quality indices may be used as a quick assessment to evaluate compliance to healthy dietary guidelines and dietary changes after diet education.
There have been several studies that have shown an association between diet quality indices and chronic diseases, especially cancer and cardiovascular diseases. Some research has also demonstrated an association of diet quality indices with obesity and diabetes [12-15]. However, there have been few studies assessing the relationship between diet quality indices and glycemic control, and on which indices might serve as an appropriate tool to assess diet quality in patients with type 2 diabetes following diet education. In this study, we tried to determine the relationship between the diet quality indices including HDI, AHEI, and DQI-I, and glycemic indices in Korean patients with type 2 diabetes, independent of adiposity and energy intake. Then, we also tried to determine which indices were appropriate for assessment of diet quality after dietary education in patients with type 2 diabetes.
Materials and Methods
Subjects and design
Subjects were 110 consecutive Korean outpatients with type 2 diabetes who visited 2 university hospitals from April 2004 to November 2006 and who were enrolled in a study to evaluate the effectiveness of the medical nutrition therapy (MNT). Details of the study subjects have been described in our previous publication [5]. Briefly, subjects were patients with newly diagnosed type 2 diabetes or patients who had been diagnosed with type 2 diabetes for fewer than 5 years but did not have acute and/or chronic complications.
At the time of enrollment, anthropometric parameters, dietary intake, and metabolic parameters were obtained. Height was measured to the nearest centimeter while the subjects were barefoot, and body weight was measured to the nearest 0.1 kg using a digital scale while the subjects wore light clothing. Then, body mass index (BMI) was calculated by determining the ratio between weight and height squared (kg/m2). Waist and hip circumferences were measured using a measuring tape with patients standing. The waist circumference was taken at the narrowest point between the lower costal margin and the superior iliac crest, and the hip circumference was measured at the horizontal level between the symphysis pubis and the greater gluteal protuberance that yielded the maximum measurement. Blood pressure was recorded using a mercury sphygmomanometer twice in a sitting position after subjects had been in a relaxed state for at least 10 minutes. Hypertension was defined as 2 consecutive systolic/diastolic blood pressure measurements > 140/90 mmHg or current treatment with antihypertensive medication.
One-day dietary intake was collected by 24-hour recall by registered dietitians. Nutrient values were calculated using the nutrient database of the Korean Nutrition Society [8].
Fasting plasma glucose (FPG), 2-hour postprandial glucose (PP2) concentration, and lipid profile levels were analyzed enzymatically, using an autoanalyzer (Hitachi 760-210, Hitachi Ltd., Tokyo, Japan). Hemoglobin A1c (HbA1c) was determined using high-performance liquid chromatography (HLC-723 G8, TOSOH, Tokyo, Japan).
The study protocol was approved by the Sungkyunkwan University Institutional Review Board.
Application of the DQI-I, HDI, and AHEI to the datasets
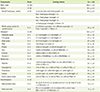
The DQI-I focused on 4 major aspects: variety (0-20 points), adequacy (0-40 points), moderation (0-30 points), and overall balance (0-10 points). The scores for all 4 categories were totaled, from 0 to 100 (0 being the worst and 100 the best possible scores) [4,6]. For the variety and adequacy categories, we used the US Exchange List serving size definition [7] for cross-national comparative work. The adequacy of intakes for iron, calcium, and vitamin C were examined on the basis of the percentage attainment of the Dietary Reference Intakes in Korea [8]. The HDI was calculated as the sum of dichotomous variables on the basis of 9 items: saturated fatty acids; polyunsaturated fatty acids; protein; complex carbohydrates; dietary fiber; fruits and vegetables; legumes, nuts, and seeds; mono- and di-saccharides; and cholesterol (range 0-9, 0 being the worst and 9 the best possible scores) [4,9]. Scoring for the AHEI was based on intake levels of 9 components: fruits, vegetables, ratio of white to red meat, trans fats, ratio of polyunsaturated to saturated fat, cereal fiber, nuts and soy, moderate amounts of alcohol, and multivitamins over a long period. Each component contributed 0 to 10 points, with 10 indicating that recommendations were met and 0 indicating the poorest dietary behavior. Intermediate intakes were scored proportionally between 0 and 10, except for the multivitamin component, which was assigned a score of either 2.5 or 7.5 to avoid overweighting of this binary variable. Component scores for AHEI were totaled, ranging from 2.5 (worst) to 87.5 (best) [4,10,11]. In our study, the duration of multivitamin use was not measured, because this information was not collected. Therefore, the maximum possible AHEI score was 82.5.
Statistical analysis
Data are presented as mean ± standard deviation and percentage unless otherwise stated. We used SPSS version 10.0 (SPSS, Chicago, IL, USA) for statistical analysis. Partial correlation coefficients were used to assess the association of the 3 indices of dietary pattern analysis with glycemic indices. All p values of < 0.05 were considered to be statistically significant.
Results
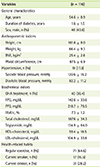
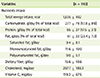
The mean age, BMI, and diabetes duration of subjects were 54.6 ± 8.9 years, 25.4 ± 2.8 kg/m2, and 1.6 ± 1.5 years, respectively (Table 1). The percentages of subjects with hypertension, who regularly exercised, who currently smoked, and who consumed alcohol were 17.3%, 64.6%, 15.5%, and 28.2%, respectively. Forty subjects (36.4%) were treated with oral hypoglycemic agents, but none was on insulin therapy. The mean FPG, PP2, and HbA1c of subjects were 142.6 ± 33.6 mg/dL, 218.7 ± 78.5 mg/dL, and 7.3 ± 1.2%, respectively. The average intakes of energy, carbohydrate, and fat in these subjects were 1935 ± 492 kcal/day, 277 ± 78 g/day, and 51 ± 22 g/day, respectively (Table 2).
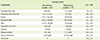
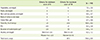
The average scores for DQI-I, HDI, and AHEI in this study were 68.9 ± 8.2 (Table 3), 5.0 ± 1.3 (Table 4), and 39.4 ± 8.9 (Table 5). In the DQI-I, the score of overall-balance aspect was the lowest of the 4 aspects (2.4 ± 2.6; 24% of the total score of aspect). However, the variety aspect demonstrated the highest score (16.5 ± 2.6; 82% of the total score of aspect), closely followed by the adequacy aspect (32.5 ± 4.7; 81% of the total score of aspect). In the HDI, the score for saturated fatty acid (1.0 ± 0.20) was the highest, followed by oligosaccharides (0.9 ± 0.3), polyunsaturated fatty acids (0.8 ± 0.4), and polysaccharides (0.7 ± 0.5). In the AHEI, the score for trans-fat was the highest (10.0 ± 0.2), followed by polyunsaturated fatty acids: saturated fatty acids (10.0 ± 0.2), vegetables (7.2 ± 2.5), and nuts and soy proteins (5.5 ± 4.7).
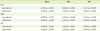
After adjustment for age, the DQI-I and AHEI scores did not correlate with HbA1c, while the HDI score showed a significant negative correlation with HbA1c (Table 6). However, the DQI-I, AHEI, and HDI scores had a significant negative correlation with FPG and PP2. When age, BMI, and energy intake were adjusted for, the DQI-I and HDI scores had a significant negative correlation with HbA1c. All 3 diet quality indices had a significant negative correlation with FPG and PP2.
Discussion
This study focused on assessing the association between dietary quality indices and glycemic indices in Korean patients with type 2 diabetes. We found that the DQI-I and HDI had a significant negative correlation with HbA1c, FPG, and PP2, but the AHEI did not have a significant negative correlation with HbA1c.
A few studies have shown an association between glycemic status and the DQI-I and HDI in patients with diabetes. However, similar to our study, the dietary guideline index, which assessed compliance with established dietary guidelines, was inversely associated with glycemic indices in type 2 diabetes [12].
Interestingly, our results showed that the total scores of the DQI-I and HDI had an association with glycemic indices, but each component of the DQI-I and HDI did not. Consistent with our findings, the multiple food groups characterized as the 4-principle component analysis dietary pattern score and a priori -defined low-diabetes-risk food pattern score were associated with lower risk of type 2 diabetes, but individual food groups were not independently associated [13]. This observation suggests that dietary pattern indices are a better approach to assess diet quality for diabetes than traditional approach of using single-nutrient or food group exposures.
Several studies have shown an association between eating patterns according to the AHEI and risk of type 2 diabetes. Contrary to our findings, higher scores on the AHEI were reported to be associated with a lower risk of type 2 diabetes (comparing the top to the bottom quintile: 0.64 ([95% confidence interval, 0.58-0.71], Ptrend < .0001) [10], and the AHEI score was negatively correlated with change in HbA1c level (r = -0.024, p < 0.05) [14].
A limitation of this study was that the 3 dietary pattern indices were derived from one-day dietary intake data obtained by the 24-hour recall method, which may not reflect the ordinary diet of the subjects. However, 24-hour recall data maybe a stronger predictor of more recent diet than distant diet for type 2 diabetes, and the timing of Food Frequency Questionnaires may not capture short-term improvement [10]. This might explain why a correlation was observed between the 3 dietary quality indices and FPG and PP2, but not between AHEI and HbA1c. Additionally, our data were cross-sectional, thereby precluding the determination of causality. Taken together, these findings suggest the need for longitudinal research to examine in more detail the relationship between diet quality and glycemic changes in type 2 diabetes [16]. In addition, for the variety and adequacy aspects for some of the components of the DQI-I, we used the US Food Guide Pyramid serving size definitions to assess food group intake on the basis of how the number of servings consumed compared with the recommendations [6]. This study was also limited because of its small sample size.
This study examined whether dietary quality indices are appropriate to assess diet quality and predict adherence to dietary recommendations in Korean patients with type 2 diabetes. Further research is needed to examine the long-term dietary and glycemic changes in patients with diabetes following nutrition education.
Conclusion
The DQI-I and HDI may be useful tools in assessing diet quality and adherence to dietary recommendations in patients with type 2 diabetes. Future research is required to determine whether dietary quality indices have predictive validity for dietary and glycemic changes after diet education in a clinical care setting.
 XML Download