

 PDF
PDF ePub
ePub Citation
 Print
Print


Introduction
Kidney transplantation is the most common solid organ transplant procedure. According to annual report of the transplant 2011 by Korean Network for Organ Sharing (KNOS), the number of patients receiving kidney transplantation was 11,367, which was 55.1% of 20,662 solid organ transplantations [1]. Kidney transplantation shows better effect on cost and quality of life (QOL) of kidney transplant recipients (KTRs) than dialysis [2,3].
The survival rate after kidney transplantation has rapidly improved with the development in technique of transplantation and immunosuppressive agents [4]. However, many KTRs still suffer from chronic allograft nephropathy and cardiovascular disease (CVD) and it was reported that several obesity related disorders such as insulin resistance, dyslipidemia, hypertension, and hyperuricemia played a crucial role in such conditions [5-7]. Researches recommended management of obesity including lifestyle modification for the control of these metabolic disorders and CVD [7,8]. It was also reported that diet intervention plays an important role in management of body weight and lipid profile [9].
In general, obesity is thought to be related to overnutrition, but the nutrition problems of KTRs are not always related to overnutrition. Since KTRs have followed many diet restrictions for a long time before transplantation, many of them can experience nutrition problems related to undernutrition. The major nutritional goal for KTRs should be to treat preexisting undernutrition and prevent excessive weight gain. Several reports presented diet guidelines for KTRs [7, 10-12]. They suggested two-step (early post-transplant period and late posttransplant) recommendation of energy (30-35 kcal/kg, 25-30 kcal/kg, respectively) and protein (1.3-2.0 g/kg, 0.8-1.2 g/kg, respectively) for KTRs. In addition, sodium, potassium, phosphorus and fluid are not subjected to the restriction unless KTRs showed abnormal findings in their clinical signs.
Although lots of studies have reported the importance of diet for the management of KTRs, there is limited data on the diet and nutrition related problems of KTRs in Koreans. The purpose of our study was to evaluate the dietary intake of KTRs and assess oral intake related nutrition problems. The study results will show baseline data to establish guideline for medical nutrition therapy after kidney transplantation.
Materials and Methods
Subjects
Fifty-two patients aged 20 years and older who had undergone successful kidney transplantation from September 2009 to August 2010 participated in this study. All subjects were referred to dietitians for nutrition education before discharge. A skilled dietitian conducted nutrition education based on the diet guideline for KTRs (energy 32 kcal/kg of ideal body weight [IBW], protein 1.3 g/kg of IBW) [11] and neutropenic diet guideline for patients using immunosuppressive therapy after transplantation (food safety guideline and restrictions in raw or uncooked foods) [13]. Patients were also instructed how to log 3-day food records. Fifty subjects completed 3-day records were included for the analyses. Written informed consent was obtained from all patients. The study was approved by the Institutional Review Board (IRB) at the Seoul National University Hospital, Seoul, Korea (No. H-0906-037-283) and was carried out according to the policies of the IRB.
Survey content and method
General characteristics
We collected age, gender, day of operation, and pre-transplant dialysis status from electric medical record (EMR).
Anthropometric, biochemical measurements, and clinical data
Body weight at admission, discharge, 1 month and 3 months after operation, and height were obtained from EMR. To monitor changes of nutritional status and graft function, we reviewed EMR and collected total cholesterol, total protein, albumin, uric acid, blood urea nitrogen, creatinine, calcium, phosphorus, potassium, hemoglobin, total lymphocyte and absolute neutrophile count (ANC) values at admission, 1 month and 3 months after kidney transplantation.
Dietary intake analysis
Dietary intake of the patients after discharge was investigated by 3-day food records. The patients were instructed to record food items they ate for 3 days over 2 weekdays and 1 weekend day and asked to return the 3-day food records at 1 month after transplantation. Patients were encouraged to provide as much detail as possible. To improve the accuracy of the dietary data, each record was evaluated by a skilled dietitian for completeness and accuracy with patients being asked to provide additional information about unclear food items and amounts. We used the CAN-Pro (Ver. 3.0) developed by the Korean Nutrition Society to analyze average daily nutrient intake. We compared daily nutrient intakes of patients with recommended intake for energy (32 kcal/kg of IBW) and protein (1.3 g/kg of IBW) and Korean Recommended Nutrient Intake (KRNI) for vitamins and minerals [14].
Statistical analysis
All statistical analyses were performed using SPSS version 19.0 and the results were expressed as means with standard deviation (SD) for continuous variables and as numbers and proportions for categorical variables. To compare variables, student's t-test and paired t-tests were used. Generalized linear model (GLM) was used to analyze food intake according to nutrient intake levels and Duncan's multiple range test was used to verify the significance of difference. The relationship between body weight change and nutrient intake was presented with Pearson's correlation coefficient. The level of statistical significance was defined as p < 0.05.
Results
General characteristics
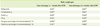
General characteristics of the patients are given in Table 1. The average age of the patients was 46.8 years old (range, 22 to 69 years). The mean body mass index (BMI) was 23.2 kg/m2 and the BMI ranged from 18.1 to 29.4 kg/m2. The number of patients with BMI under 18.5 kg/m2 was 4 (2.0%), and that over 25 kg/m2 was 12 (24.0%). Percentage of the patients who had undergone dialysis before transplantation was 76.0% (hemodialysis, 54.0%; peritoneal dialysis, 22.0%) and 24.0% of the patients did not receive dialysis before transplantation.
Changes in anthropometric and biochemical measurements
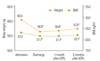
The body weight and BMI at discharge, 1 month and 3 months after transplantation significantly decreased compared to those at admission. The mean weight loss between admission and discharge was 4 kg. The mean weight gain from discharge to 1 month and 3 months after transplantation was 0.4 kg and 1.0 kg, respectively, and there was no significant difference (Figure 1).
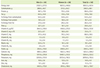
Changes in biochemical measurements are shown in Table 2. Most of the indicators showing nutrition status and graft function showed significant differences between values at admission and 1 month and 3 months after transplantation (p < 0.05). The mean values of BUN, creatinine, phosphorus, and potassium were within normal limits at 1 month after transplantation. The ranges of BUN, creatinine, phosphorus, and potassium at this time were 8-46 mg/dL, 0.6-4.6 mg/dL, 1.2-5.4 mg/dL, 3.2-5.9 mg/dL, respectively, but 28.0% of patients showed lower level than normal limits in phosphorus.
Nutrient intake analysis
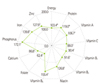
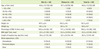
The daily nutrient intake of the patients at the first month after kidney transplantation is presented in Table 3. The ratio of carbohydrate, protein, and fat to total energy was 53.5:18.7:28.2. The average energy intake was 1855.5 ± 457.4 kcal/day, which was 33.1 ± 7.7 kcal/kg/day and 103.4% of recommended energy intake. The mean intake of protein was 86.6 ± 23.4 g/day, which was 1.5 ± 0.4 g/kg/day and 119% of recommended protein intake. When we compared the vitamin and mineral intakes to KRNI, the intake levels of vitamin C (88.0%), folate (62.4%), and calcium (86.8%) were under 90% of KRNI (Figure 2). Especially, in the case of folate the percentage of patients whose folate intake level was less than 75% of KRNI was 76.0% (Figure 3).
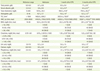
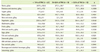
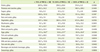
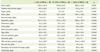
To investigate food contributing the intake of vitamin C, folate, and calcium, we divided the patients into 3 groups according to their relative intake to RNI (< 75% of RNI, 75-125% of RNI, and > 125% of RNI) and analyzed the mean food intake by each food group. In the case of vitamin C, the lowest intake group showed significantly lower intakes of cereals, vegetables, fruits, and milk than the other groups (Table 4). The lowest folate intake group also presented significantly lower intake of eggs. They also showed decreased tendency of vegetable intake, but it was not significant (Table 5). Fish, milk and dairy products, and seasonings were also consumed significantly less in the lowest calcium intake group than in other groups (Table 6).
As our result showed a higher proportion of patients with hypophosphatemia at 1 month after transplantation compared to the proportion of hypophosphatemia before transplantation, we analyzed phosphorus intake of patients with hypophosphatemia (< 2.5 mg/dL). The phosphorus intake in the patients with hypophosphatemia was significant lower than that in those with phosphorus level over 2.5 mg/dL (967.7 ± 256.0 vs. 1296.4 ± 316.2, p = 0.001). It presented the same result after adjusting energy intake (p = 0.001).
The relationship between weight changes from discharge to 1 month and 3 months after transplantation and nutrients intake is given in Table 7. Results showed that weight gain from discharge to 1 month after transplantation was significantly related to energy, carbohydrate (p < 0.001) and protein intake (p = 0.003) and weight gain from discharge to 3 months after transplantation was significantly related to energy, carbohydrate, protein (p < 0.001), and fat intake (p = 0.003).
Discussion
The present study investigated oral intake of adult KTRs to evaluate the intake of nutrients and assess oral intake related problems in Korea. The average BMI of pre-transplant patients was 23.2 kg/m2 and it was lower than that in the Dialysis Outcomes and Practice Patterns Study [15], 25.2 kg/m2, but it was higher than the average BMI of hemodialysis patients reported by Odamaki, 19.0-20.0 kg/m2 [16]. The BMI range in our study was from 18.1 to 29.4 kg/m2, and the percentage of patients with BMI above 25.0 kg/m2 was 24.0%. Our result indicated that some KTRs showed preexisting obesity before transplantation. Obesity is one of the common problems in KTRs and it is known to be associated with increased risk of CVD, dyslipidemia, hypertension and diabetes [17]. Diet therapy plays a main role in management of obesity related disease in KTRs [9]. At the same time, a previous study reported that 15-23% of KTRs presented signs of undernutrition, BMI under 21 kg/m2 [18]. Rettkowski et al. [19] reported that KTRs with BMI under 23 kg/m2 at 1 year after kidney transplantation shows the increased risk of loss of kidney graft function. These facts indicate that management of undernutrition is as important as that of obesity in KTRs. Percentage of patients with BMI less than 18.5 kg/m2 was 2% in our study, which is relatively low. However, as KTRs are nutritionally heterogeneous, individualized medical nutrition care plan for weight management should be applied to the KTRs.
It is known that recovery of nutritional status and weight gain mainly occurs during the first year after transplantation [20]. However, Nishi et al. [21] reported that KTRs in Japan showed decrease in weight by 7.6% 3 months after transplantation, and weight loss continued 6 months after transplantation, and it was not until 2 years after transplantation that the weight reached to pre-transplant weight. Our study also showed significant weight loss after transplantation, but weight loss mainly occurred from admission to discharge. Body weight from discharge to 1 month and 3 months after transplantation increased but was not significant. Nish et al. [21] explained that the early post-transplant weight change resulted from a hypercatabolic state after kidney transplantation. However, considering both decrease in weight and increase in other nutrition indicators such as albumin, cholesterol and hemoglobin in our study, we could not rule out the influence of changes in hydration status. The albumin level in renal patients is affected not only by poor nutrition, inflammation, and comorbid disease but also by hydration status [22]. Coroas et al. [23] reported decrease in total body water, extracellular water and intracellular water in KTRs. Therefore, the improvement in nutrition related biochemical measurements such as albumin could be a sign of recovery of fluid retention in the body caused by renal dysfunction. We should understand weight loss right after transplantation as a consequence of a hypercatabolic state and change of hydration status rather than deterioration of nutritional status.
Even though 52.0% of the patients in our study showed pre-transplant hyperphospatemia, 28.0% of the patients presented hypophosphatemia at 1 month after transplantation. Hypophosphatemia is common when renal function normalizes in KTRs with preexisting hyperparathyrodism. Inadequate phosphorus intake could be one of the risk factors. The phosphorus intake of patients with hypophosphatemia was 967.7 ± 256.0 mg/day and it was significantly lower than that of patients with phosphorus level more than 2.5 mg/dL, 1296.4 ± 316.2 mg/day (p = 0.001). The mean intake of each group was more than KDRI of phosphorus, 800 mg/day. Our results suggested that patients with early post-transplant hypophosphatemia need more phosphorus intake than KRDI of phosphorus.
Chadban et al. [24] recommended at least 1.4 g/kg/day protein intake for KTRs during the first 4 weeks after transplantation to reverse negative nitrogen balance and increase muscle mass. Low protein intake at early post-transplant period was a meaningful risk factor of more fat mass and less muscle mass at 1 year after transplantation in KTRs [25]. These facts indicated that adequate protein intake in early post-transplant period is important to maintain muscle mass. The daily mean protein intake of patients in our study was 86.6 g (1.5 g/kg) and it was 119.0% of protein recommended intake for KTRs. It showed that a strong positive relationship between the protein intake and weight gain from discharge to 1 and 3 month after transplantation (p < 0.001). When we consider that the percentage energy from protein of Korean National Health and Nutrition Examination Survey (KNHANES) [26] was around 15%, our results, 18.7%, was a little higher than that of KNHANES and it could be the effect of nutrition education provided by a skilled dietitian before discharge. Since most chronic kidney disease patients before transplantation are recommended to control protein intake in some extent, so it is important to educate KTRs that diet after transplantation is different from that before transplantion and adequate protein intake is necessary to maintain muscle mass after transplantation.
When we compared vitamin and mineral intakes of the patients with RNI, most vitamin and mineral intakes were more than 90% of RNI except calcium, folate, and vitamin C. Mean daily intake percentages of calcium, folate, and vitamin C were 86.8%, 62.4%, 88.0% of RNI, respectively. This presented more concerns on quality of diet was necessary in addition to intake of energy and protein in KTRs.
Some KTRs already have chronic kidney disease related bone disease before transplantation and steroid use after transplantation, inadequate calcium intake and hyperparathyroidism could make bone disease worse [27,28]. Supplementation of calcium and vitamin D is recommended after kidney transplantation to prevent bone disease [29]. Recommended intake of calcium for KTRs is 800-1000 mg/day, which is higher than that for general populations (700-750 mg/day for man, 650-700 mg/day for woman) [7]. Calcium intake in our study was 623.2 mg, which was slightly higher than that reported in KNHANES [26], 529.6 mg, but it was still less than recommended calcium intake for KTRs and 36.0% of patients showed calcium intake under 75% of RNI [12]. When we divided the patients into 3 groups according to their intake percentage (< 75% of RNI, 75-125% of RNI, and > 125% of RNI) and analyzed the mean food intake by each food group, we found significant differences in the intakes of milk and dairy products, fish and seafoods, and seasonings. This was similar to KNHANES results reporting milk and anchovies as main sources of calcium [26]. Calcium in seasonings came from salt with parched sesame and fermented soybean paste. We recommend at least 1 cup of milk per day for adequate calcium intake in KTRs.
Folate intake in our study was also inadequate. Folate intake was 62.4% of RNI and percentage of patients with folate intake under 75% of RNI was 76.0%. This was similar to the results showing adequate energy and protein intake with inadequate folate and vitamin D intake at 3 years after transplantation [30]. Inadequate folate intake and plasma folate level were reported as main factors of hyperhomocysteinemia [31]. Hyperhomocysteinemia is known as an independent cardiovascular risk factor in general population. KTRs showed elevated homocysteine levels [32]. Inadequate folate intake is not the main factor of elevated homocysteine level, but it could be a contributing factor. In order to know the main food source of folate, we divided the patients into 3 groups according to folate intake percentage (< 75% of RNI, 75-125% of RNI, and > 125% of RNI) and analyzed the mean food intake by each food group. Eggs showed significant difference (p < 0.05) and vegetables also showed difference but not significantly (p = 0.0765). This was also similar with the previous study reporting eggs, seaweeds, spinach, and bean sprouts as main sources of folate [33].
Vitamin C was also one of the nutrients showing inadequate intake in our study and percentage of patients with vitamin C intake under 75% of RNI was 42.0%. To investigate food contributing vitamin C intake, we divided the patients into 3 groups according to the level of vitamin C intake (< 75% of RNI, 75-125% of RNI, and > 125% of RNI) and analyzed the mean food intake by each food group and we found significant differences in milk and dairy products, vegetables, and fruits.
In these results, we found that patients with inadequate folate, calcium, and vitamin C intake consumed less foods from milk and dairy products and vegetable and fruits in common and many items in these food groups were not allowed in our neutropenic diet guideline during first few months after transplantation. Restrictions of fresh vegetables, fruits, and milk and dairy products not in Tetra Pak in our neutropenic diet guideline could hinder patients from selecting various foods and it could be one of the reasons presenting the lower intake in milk and dairy products, vegetables, and fruits in some patients.
There is no clear consensus on the definition of neutropenia, but lower ANC reported more infections (ANC < 500 /µl, severe risk of infection; 500 /µl ≤ ANC < 1000 /µl, moderate risk of infection; 1000 /µl ≤ ANC < 1500 /µl, minimal risk of infection) [34]. The mean level of ANC after transplantation in our study was more than 3000 /µl and patient with ANC under 1500 /µl was only 2 (4.0%) at 3 months after transplantation. There was also no consensus on level of neutropenic dietary restrictions [35] and it has been reported that evidence didn't support the efficacy of stringent dietary restrictions in neutropenic diet for KTRs [29]. Strict restrictions in neutropenic diet could cause inadequate nutrients intake in KTRs. We suggest reviewing current neutropenic diet guidelines for transplant recipients, which limits fresh vegetables and fruits and milk and dairy products unless they are aseptically processed and packaged.
Conclusion
This study reviewed body weight changes, some biochemical changes related to nutritional status and graft function of 50 KTRs in Korea and evaluated dietary intake and assessed oral intake related nutrition problems. This study showed 4 kg of weight loss right after transplantation with a tendency of weight increase from discharge to 1 month and 3 months after transplantation. Body weight gain during this period was significantly related to intake of energy and protein. Biochemical measurements indicating graft function mostly turned to normal limits. Some patients showed hypophosphatemia, which was related to relatively low phosphorus intake. Energy and protein intakes were adequate but calcium, folate, and vitamin C presented inadequate intake. Patients with inadequate intake in such nutrients showed reduced intake in several food groups such as milk and dairy products, vegetables, and fruits, and these were related to food items not allowed in neutropenic diet after transplantation. The limitations of our study are that the study was conducted in a single center with a short follow up period. We still don't know what the nutrition related problem after 3 months. These limitations must be complemented in further studies. In conclusion, KTRs have possibility of under-or over-nutrition related problems. Individualized nutritional care plan is necessary to nutritionally heterogeneous KTRs and reviewing present neutropenic diet guideline is also necessary.

 XML Download