Journal List > Clin Nutr Res > v.1(1) > 1059744

Lee and Kim: Accuracy of Predictive Equations for Resting Metabolic Rates and Daily Energy Expenditures of Police Officials Doing Shift Work by Type of Work

Abstract

The purpose of this study was to analyze the accuracy of predictive equations for resting metabolic rate (RMR) and daily energy expenditure in policemen on a rotating shift. Subjects were 28 healthy policemen on a rotating shift (males) age of 23-46 years. The participants' RMR was measured by using indirect calorimetry (TrueOne2400) and also calculated from various predicted equations of RMR (Harris-Benedict, Schofield(W)/(WH), FAO/WHO/UNU(W)/(W/H), Cunningham, Mifflin, Liu, Owen, IMNA and Henry(W)/(WH)). The accuracy of these equations were evaluated on basis of accurate prediction (the percentage of subjects whose RMR was predicted within 90% to 110% of the RMR measured), mean difference, root mean squared prediction error, mean % difference, limits of agreement of Bland-Altman method between predicted and measured RMR. The measured RMR value of subjects was 1748 ± 205.9 kcal. Of the predictive equations tested, the Harris-Benedict equation (mean difference: -14.8 kcal/day, RMSPE: 195.8 kcal/day, mean % difference: 0.1%) was the most accurate and precise, but accuracy in prediction of the equation were only 35.7%. The daily energy expenditure at night-duty was 3062 kcal calculated as multiplying RMR by its physical activity level. Subsequently, daily energy expenditure of day-duty was 2647 kcal and the lowest daily energy expenditure was, 2310 kcal at holiday duty. Daily energy intake of all study participants was 2351 kcal at day-duty, 1959 kcal at night-duty and 1796 kcal at holiday-duty in order. The estimated energy requirements for policemen on a rotating shift on day shift, night shift and holiday came to 2743.6 kcal/day, 2998.6 kcal/day and 2576.9 kcal/day, respectively. These results suggest that estimated energy requirements (EER) of policemen on a rotating shift should be differently proposed by a proper equation which can closely reflect their metabolic status at each time shift.

Introduction

In the current society, as a variety of occupation has been specified, the number of employees who do shiftwork, including those who do night duty, has been on the rise. The rate of employees whose night duty accounts for 25% of their work hours was found to amount to 17.6%, 15-20%, and 15-30% in Europe, the US, and developing countries, respectively [1,2]. In Korea, the rate of employees who work on a three-shift system reached 28.8% in 2003, constantly up to 30.9% in 2010 [3]. For example, more than 80% of Korean police officials work in a nightly shift of 24-hour work system [4]. Police officials who do shift work experience holiday work and night duty so that they are often worn-out physiologically and psychologically [5]. To make it worse, since those working in a shift system rotate shifts, their circadian rhythm out of biorhythm is broken. As a result, they suffer from physical and psychological disorder, sleep deprivation, digestive disorder and increasing fatigue, and chronic diseases [6]. The analysis on physical activity level based on the evaluation of activities of the police officials who do shift work revealed [7] that the number of nightly-shift workdays (1.75) was significantly larger than the number of daily-shift workdays (1.52) and the number of holiday workdays (1.31). This indicated that, with respect to police officials doing shift work, their activity and the activity contents by type of work had great similarities. Therefore, if their physical activity level and resting metabolic rate (RMR) are measured, it is possible to calculate daily energy expenditures by type of work (day shift work, night shift work, and holiday shift work), and thus when the calculation is applied to actual life, the issue of energy imbalance will be able to be addressed.
To calculate a person's RMR accurately, it is proper to use indirect calorimetry for measuring oxygen consumption and carbon dioxide production [8], but such a method requires expensive equipment and any trained person to measure them. Furthermore, the measure procedure (including food intake and limitations of activity) is so complicated that it is hard to generalize it [9]. As a method to replace the indirect calorimetry in measuring a RMR, there is a method using a formula to estimate a RMR. That is, a person's anthropometric measurements including weight, height and gender are substituted in the formula to calculate a RMR. For a while, when a RMR is calculated, Harris-Benedict (1919) formula [10] and WHO (1985) formula [11] have mainly been used in Korea. Dietary Reference Intakes for Koreans (2005) [12], however, recommended that weight, height and physical activity be substituted in the formula proposed Institute of Medicine of the National Academies (IMNA, 2002) to calculate estimated energy requirement (EER) [13].
Therefore, this study was intended to assess RMRs of police officers doing shift work and use various statistical methods to evaluate the precision of representative RMR estimation formulas mostly used in clinical fields among RMR estimation formulas developed so far. Additionally, in this study, this researcher used the physical activity level of police officers doing shift work, which was shown earlier, to calculate daily energy expenditures by type of work and compare the calculated results using the formulas for EER proposed by Dietary References Intakes for Koreans.

Materials and Methods

Subjects

The subjects were 28 police officers (aged 25 to 46) doing shift work in Youngdong province (Samcheok, Donghae, Gangneung, and Sokcho). Also, they had no specific diseases and have never taken any medicines or hormone drugs affecting energy expenditure. The subjects had fully understood the test of this study and had given written consent before their RMRs were measured, and then had voluntarily participated into the test. During the study period, they had maintained the similar life styles and working environment as in ordinary times. In particular, the meeting about the research and operation had regularly been held to check that human rights and privacy of the subjects had safely been protected in this study process.

Anthropometrics

With the use of Inbody 720 (Biospace Co., Seoul, Korea), each study subject's height, weight and body composition (body fat mass and muscle mass) were measured by Bioelectrical impedance analysis. Based on the measured weight and height of each subject, body mass index (BMI), obesity index, fat free mass, and body surface area (BSA: m2) were calculated.
  • Body Mass Index (BMI) = Weight (kg) / Height (m)2

  • Obesity Index = (Current Weight / Standard Weight) × 100

  • Fat Free Mass (kg) = Weight (kg) - Fat Mass (kg)

  • Body Surface Area (BSA) [14] = Weight0.425 (kg) × Height0.725 (cm) × 0.007184

Resting metabolic rate

Indirect calorimetry (TrueOne2400 Parvo Medics, 8152 South 1715 East Sandy, UT 84093, USA) reflecting was used for measuring each subject's RMR. In order to minimize a measurement error, the temperature and humidity of a measurement room remained unchanged constantly, and the measurement was performed in a quite circumstance. Prior to the measurement, subjects were forced to abstain from food for more than 14 hours and avoid doing exercises for 24 hours. After lying on their back for more than 30 minutes to keep their composure, subjects put on a canopy and breathed for more than 15 minutes in a peaceful condition. During the time, their oxygen consumption and carbon dioxide production were measured at an interval of 10 seconds Based on all the measured values of oxygen consumption and carbon dioxide production except for the values measured for the early 5 minutes of the measurement, oxygen consumption's average value and carbon dioxide production's were calculated. And then, respiratory quotient (RQ) was calculated with the average values. The calculated result was substituted in Weir formula to calculate a RMR [15].

Food intakes

Food record method was used for exploring how much food each subject takes for one day of day shift work, one day of night shift work, and one day of holiday shift work. Regarding food intake record, a trained interviewer fully explained a way of recording their food intake. When subjects brought their record to a surveyor, they had a person-to-person interview with the surveyor to correct and add something omitted. Based on the finally surveyed data about food intake, each subject's energy expenditure depending on a type of work was calculated with the use of Computer Aided Nutritional Analysis Program for Professionals (CAN Pro).

Calculation of RMR by using predictive equations

The formulas to estimate a RMR, applicable to male adults, were chosen to calculate each subject's RMR. The predictive equations estimation formula used in this study is presented in Table 1.

Calculation of energy expenditure

The measured or predicted RMR was multiplied by each subject's physical activity level (days of night shift work: 1.75, days of day shift work: 1.52, and days of holiday shift work: 1.31), reported earlier, to calculate each one's daily energy expenditure [7].

Statistical analysis

For data processing, SAS Ver. 9.1 program was used. Each subject's anthropometric measurements and the estimation formula were used for calculating the average value and the standard deviation of the RMRs. And, Pearson's correlation coefficient was applied to explore the correlation between actually measured RMRs and anthropometric measurements. In addition, the RMRs actually measured RMRs and the estimation formula were compared in the following ways.
  • - Paired t-test was used to compare the RMRs measured by indirect calorimetry (TrueOne2400) with ones calculated from the estimation formula in the 5% significance level (p < 0.05).

  • - The mean difference and the mean percentage difference between actually measured RMRs and predicted ones, and Root Mean Squared Prediction Error (RMSPE) were calculated to analyze the accuracy of the predicted RMRs. The difference between actual RMR and predicted RMR appeared in the absolute value, and RMSPE reflecting the margin of error was calculated as follows [16].

    RMSPE=Actual RMR - Predicted RMR2ncnr-1-66-i001

  • - Accurate prediction (%) is the accurately predicted percentage of subjects by the formula, and, in other words, is the percentage of subjects whose predicted RMR is evaluated to be within 90-110% of actual RMR. Less than 90% was analyzed as under-prediction, and more than 110% was as over-prediction.

  • - Bland-Altman test [17] to calculate the range of limits of agreement was performed to evaluate the agreement between actual values and predicted values and thereby calculate the mean difference between actual RMRs and predicted RMRs (mean difference ± 1.96 SD).

Results

Subjects' characteristics

Each study subject's anthropometric measurements are presented in Table 2. The age of the subjects was 31.5 ± 5.1 years, and all of them were male. Their height and weight were respectively 173.1 ± 5.2 cm and 73.7 ± 9.7 kg. The subjects' BMI was 24.6 ± 3.0 kg/m2. Regarding obesity based on the BMI, a group of under-weight subjects was not found, and 10 subjects were included in the normal-weight group, 4 were in the over-weight group, and 14 were in the obesity group. Regarding obesity index using the standard weight based on Broca's formula, the obesity index was 112.1 ± 13.7%, and fat mass and muscle mass were 15.5 ± 1.9% and 37.3 ± 5.8%, respectively. And, systolic blood pressure was 128.7 ± 9.8 mmHg, and diastolic blood pressure was 81.5 ± 9.5 mmHg.

Accuracy of predictive equations for resting metabolic rates

The results of comparison between subjects' actual RMRs and predicted RMRs by estimation formulas are presented in Table 3. The formulas that showed the significant differences between predicted RMRs and actual RMRs (1748.3 ± 205.9 kcal/day) were the formula of Liu et al., WHO [WH]'s formula, the formula of Owen et al., and the formula Mifflin et al., and the rest equations didn't show significant differences (p < 0.05). Regarding the mean difference and the mean percentage difference between actual RMRs and predicted RMRs, Harris-Benedict's formula had the lowest values (-14.8 kcal/day and 0.1%), and the next ones were Henry[W]'s formula [2005], IMNA's formula [2002], Henry [WH]'s formula [2005], and Cunningham's formula [1991] in order. Regarding the mean percentage difference (mean % difference) between actual RMRs and predicted RMRs, all formulas except for the formula Liu et al. [1995] (-12.1) had the percentage between -10 and 10%. With regard to RMSPE, the RMSPE calculated with actual RMRs and predicted RMRs by Cunningham's formula was the lowest 177.7 kcal. With regard to Pearson correlation coefficient between actual RMRs and predicted RMRs, Cunningham's formula (r = 0.522) showed the highest correlation, and, Harris-Benedict's (r = 0.395), WHO[WH]'s (r = 0.385), the formula Mifflin et al. (r = 0.408), the formula of Liu et al. (r = 0.393), IMNA's (r = 0.398) and Henry [WH]'s (r = 0.383) also showed a significant correlation. Regarding the Accurate Prediction about RMRs by formulas, the formula of Liu et al. showed the highest 64.3%, and the next one was WHO[WH]'s with 39.3%.
Regarding the agreement between actual RMRs and predicted RMRs evaluated by Bland-Altman method (Figure 1), the range of limits of agreement evaluated by Harris-Benedict Formula was the narrowest (-416.9, 375.8), and the mean difference leaned to a negative value (-14.8 kcal/day). And, the range of limits of agreement and the mean difference, evaluated by Henry[W]'s, IMNA's and Henry[WH]'s, leaned further to negative values.

The Correlation between measured RMRs and relevant factors

The correlation between actual RMRs and various factors reportedly related to RMR-age, height, weight, body mass index, fat mass ratio, fat mass, body surface area [18-20]-is presented in Table 4. The result indicated that only the fat free mass (FFM) was significantly correlated (r = 0.522) with actual RMRs (p < 0.05).

Daily energy expenditure, energy intake and estimated energy requirement

Each physical activity step's coefficient (PA value, day shift work's PV value: 1.1, night shift work's: 1.25, and holiday shift work's: 1.0), determined on the basis of each subject's age, height, weight and physical activity level, was substituted in the estimated energy requirement (EER) formula proposed by Dietary Reference Intakes for Koreans to calculate daily EER shown in Table 5. In addition, the 24-hour recall method of 3 days (day shift work, night shift work, and holiday shift work) was used for calculating subjects' daily average energy intake. Regarding the total daily energy intake of subjects, the amount during day shift work was found to be the highest 2351 kcal, and the next ones were the amount during night shift work (1959 kcal) and one during holiday shift work (1796 kcal) in order.
Regarding the three-day energy intake depending on a type of shift work, only the energy intake during night shift work was significantly lower than the energy expenditure during the time (p < 0.05). The daily EER (day work: 2998.6 kcal, night work: 2743.8 kcal, and holiday work: 2576.9 kcal) and the daily energy expenditure depending on the type appeared similar, and only the energy expenditure during night shift work (3062.5 kcal) was significantly higher than the EER during the time (2998.6 kcal).

Discussion

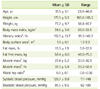
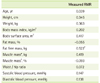
The subjects' height and weight were compared with the physical standards (170 cm and 63.6 kg) of male adults aged 30 to 49 years proposed by Dietary Reference Intakes for Koreans in 2010 [12]. The comparison showed that subjects' height was similar to the standard, but their weight was about 10 kg heavier than the standard. The subjects' BMI was 24.6 kg/m2, which is categorized into the obese risk group (23.0 < BMI < 24.9) in accordance with the weight category of Asian adults based on BMI. Also, regarding obesity index, their percentage ideal body weight (PIBW) was 112.1%, which means that they were overweight (110% < PIBW < 120%).
According to the result of the comparison between the subjects' actual RMRs (1748.3 ± 205.9 kcal/day) and adults' RMRs measured by Park et al. [21] with the use of indirect calorimetry, the measured values of those aged 20 to 29 (1728.2 kcal/day) and of those aged 30 to 49 (1669.5 kcal/day) were similar to those of this study.
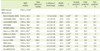
In this study, 11 formulas in which height, weight and age were used as variables, and Cunningham's formula that adopted fat free mass as a variable were used for calculating the validity of their RMR estimation (Table 3). The calculation result indicated that RMRs calculated only from the estimation formulas of WHO[WH], Owen et al., Mifflin et al., and Liu et al., were significantly lower than actual RMRs (1748.3 ± 205.9 kcal/day).
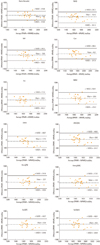
In the case of the formulas of Harris-Benedict, WHO[WH], Owen et al., Mifflin et al., and Liu et al., the mean difference between their estimated RMRs and actual RMRs was found to be a negative value, which meant that RMR was under-predicted. The mean difference of Harris-Benedict's was the lowest (-14.8 kcal/day) so that its accuracy was relatively high. The mean percentage difference of Harris-Benedict's formula, Henry[W]'s, IMNA's and Henry[WH]'s was also found to be between - 0.9 and 0.1 so that the formulas seemed to be relatively accurate. Therefore, it was found that among the estimated formulas used in this study, Harris-Benedict's was relatively accurate with regard to the mean difference and the mean percentage between actual RMRs and predicted RMRs, and RMSPE. Regarding the range of limits of agreement evaluated by Bland-Altman method that means the range of the mean difference between actual RMRs and predicted RMRs (Figure 1), the range of limits of agreement of Harris-Benedict's (-416.9, 375.8) and the formula's the mean difference between actual and predicted RMRs (-14.8 kcal/day) were the most accurate. And the next ones were Henry[W]'s, IMNA's and Henry[WH]'s in order, but the formulas' mean difference and range of limits of agreement appeared similar.
The analysis on the 12 formulas to estimate RMRs revealed that Harris-Benedict's formula was the most accurate in estimating RMRs of police officers doing shift works. The analysis result was equal to the result of the study conducted by Lee et al. [22], that Harris-Benedict's formula was the most accurate in estimating RMRs of male and female university students.
There are diverse variables affecting RMR, such as race, age, gender, climate, and temperature. The reasons that an error between predicted RMRs calculated from the estimation formulas and actual RMRs occurs are presented as follows. First, in the case of Harris-Benedict's formula, it was created with 130 white men and 103 white women in 1919, and since then, it has widely been used for calculating EER. Many studies on the validity of the formula revealed that its margin of error was about ± 5% [23-26]. But, the study on 201 healthy male and female adults, conducted by Daly et al. [27], pointed out that the RMRs calculated from Harris-Benedict's formula was over-predicted 10-15% higher than actual RMRs.
In the meantime, it was reported that the RMRs calculated from the fat free mass based formula of Cunningham et al. had the explanatory power of 67-82% [28,29], but the study conducted by Owen et al. [23] presented that it had the explanatory power of 55-60%. Many other studies [23-26] concluded that race was an important factor affecting RMR [30]. For example, Schofild [31] formula was based on European and North American people so that it was reported [32] that RMRs of Asian Indians calculated fromm the formula were over-predicted 10-11%. Also, in the case of the formula of Liu et al. [33], it was based on the Chinese American so that it was reported that RMRs of other ethnic groups calculated from the formula were over-predicted. Henry & Rees [34] proposed that the degree of muscle relaxation was different depending on race, and that climate caused different metabolic responses. In fact, it was reported that BMRs of those living in the tropics were lower than ones of those living in other areas [35-37]. In the case of WHO/NAO/FAO Formula, although 38% of its data were based on white men and women, the formula was also drawn with various ethic groups. For the reason, it was reported that applying the formula to an ethic groups collectively would cause an inaccurate result [38]. In the case of Schofild's formula [31], 47% of basal metabolic rate database for the formula was measured by used closed circuit calorimetry so that it was explained that the basal motabolism in the Schofild's formula [31] was over-predicted more than actual basal metabolic rate [34].
Regarding the correlation between actual RMRs and predicted RMRs, Cunningham's formula had the highest correlation (r = 0.522), as shown in Table 3. The result was equal to the result (r = 0.523) of the study on male and female university students aged 20 years, conducted by Lee et al. Therefore, it is considered that the age of police officers doing shift work ranges from their 20s to 30s. The study on female university students, conducted by Chang et al. [39] also revealed that the RMRs calculated from Harris-Benedict's formula, WHO's and Cunningham's had positive correlations with actual RMRs: Harris-Benedict's correlation coefficient (r) is 0.611; WHO's r is 0.676; and Cunningham's r is 0.743. But, in this study, Cunningham's formula (the mean percentage difference) over-predicted RMRs. The result was similar to the result of the study on Korean male and female university students [22].
Regarding the correlations between diverse factors [18-20] - age, height, weight, body mass index, fat mass, fat mass ratio, fat free mass, and body surface area-and actual RMRs, only FFM had a positive correlation with actual RMRs (r = 0.522), which was equal to the result of the study on Korean adults, conducted by Park et al. [21] Regarding the correlations between RMRs and relevant variables, reported by Owen et al. [23], fat free mass' correlation coefficient (r = 0.064), BSA's (r = 0.417), and weight's (r = 0.363) were positive. The study conducted by Mifflin et al. [25] also revealed that actual RMRs had positive correlations with fat free mass (r = 0.81) and weight (r = 0.71), the correlation coefficients of which were higher than ones in this study. Also, according to the study on the obesity group and the non-obesity group of those aged 12 to 18 by Bandini et al. [40], the study on female adults by Lee et al. [22], and the studies by Cunningham [41] and Webb [20], it was found that RMRs had a positive correlation with fat free mass. That is because fat free mass includes metabolically active muscle and internal organs. Also, previous studies revealed that adults' RMRs were used mainly for muscle's metabolic activity so that muscle was a decisive factor of RMRs [40].
In this study, subjects' daily total energy intake during day shift work (2,351 kcal) and during night shift work (1,959 kcal) appeared similar to each energy intake of those aged 20 to 29 (2,219.4 kcal) and those aged 30 to 49 (2,064.1 kcal), which was reported by Park et al. [21], but turned out to be smaller than each energy intake of those aged 19 to 29 (2,556.9 kcal) and those aged 30 to 39 (2,688.2 kcal), which was reported by Ministry of Health and Welfare 2010 [42]. In the meantime, the reason that the energy intake during night shift work (1,959 kcal) and one during holiday shift work (1,796 kcal) are lower than one during day night shift is considered to be that subjects are not able to keep normal meal-time due to excessive work (night patrolling, etc.) and night conditions. Also, it is conjectured that, in the case of holiday shift work, subjects are not able to have three meals properly in order to supplement enough sleeping hours for shift work.
In this study, subjects' energy expenditure during night shift work (3,062.5 kcal) appeared similar to the energy expenditure of adults with normal weight (2,958.0 kcal) and with overweight (3,372.2 kcal), reported by Park et al. [43]. And, regarding the three-day energy balance depending on a type of shift work, the energy intake during night shift work was significantly lower than the energy expenditure during the time. As a result, subjects doing night shift work showed negative balance. But, during day shift work and during holiday shift work, the energy intake was not significantly different from the energy expenditure. Therefore, subjects doing day shift work and holiday shift work showed energy balance. According to the study by Lim & Yoon [44], it was found that each energy intake of women living in farm villages during the farming season and during their leisure season (1,950.3 kcal and 1,423.3 kcal) was lower than each energy expenditure of them during the two different seasons (2,892.9 kcal and 2,130.9 kcal). In this study, although the subjects doing night shift work showed negative energy balance, their BMI was 24.6 kg/m2, which is categorized into obese risk group (23.0 < BMI < 24.9). Such a result seemed to be attributable to the error caused by respondents' prejudice and their under-reporting in the process of food intake survey.
In reality, the study on the food intake record of healthy elderly people conducted by Johan et al. [45] revealed that the higher fat mass women had, the lower food intake they tended to record. Also, it was found that the obese people who wanted to lose their weight tended to underestimate their food intake [46-48].
Despite the difference of food intake, healthy adults show adaptive mechanism to balance calory intake and expenditure and thus maintain constant energy balance. That is, to achieve the goal of energy homeostasis, on one hand, our body tries to increase energy metabolism to restrain a rise in weight, when energy intake increases, on the other hand, it tries to decrease energy metabolism to maintain weight and energy balance when food intake falls [49]. But, in the case of police officers doing shift work, day shift work, night shift work and holiday shift work are regularly repeated, affecting their body's homeostasis. Therefore, if changes in energy balance and imbalance repeatedly occur during the short period of time (2 to 3 days), in a long term, they can bring about fatal results such as occurrence of chronic diseases including metabolic syndrome.
To solve the police officers' energy imbalance by type of shift work, it is necessary to accurately evaluate their physical activity level by type of work and thereby precisely determine daily EER by type of shiftwork. Regarding this, in 2010, Dietary Reference Intakes for Koreans determined EERs by applying the total energy expenditure formula based on doubly labeled water technique. Therefore, in this study, the subjects' age, weight, height and each physical activity step's coefficient were substituted in the EER formula proposed by Dietary Reference Intakes for Koreans [12]. Regarding the calculated EERs by type of shift work, the highest EER was one during night shift work (2,998.6 kcal), and the next ones were during day shift work (2,743.8 kcal) and holiday shift work (2,576.9 kcal) in order. And, the EER during night shift work was significantly lower than the actually calculated energy expenditure, and there were no significant differences in terms of EERs during day shift work and holiday shift work. Their EER by type of shift work was slightly higher than the EER of ordinary adults aged 30 to 49 (2,400 kcal/day).
Given the results described above, the police officers' daily EER by type of shift work-the daily EER during night shift work is 2,998.6 kcal, the daily EER during day shift work daily is 2,743.8 kcal, and the daily EER during holiday shift work is 2,576.9 kcal-and their daily energy expenditure (EE)-the daily EE during night shift work is 3,062.5 kcal, the daily EE during day shift work is 2,674.3 kcal, and the daily EE during holiday shift work is 2,310.7 kcal-appeared similar. But, their energy intake-during day shift work was 2,351 kcal, during night shift was 1,959 kcal, and during holiday shift work was 1,796 kcal-appeared different. The result indicated that police officers doing shift work didn't take as much energy as they consumed. Therefore, it implies that it is quite important to accurately evaluate their physical activity level by type of shift work. In the previous study on the subjects of this study, each subject got a person-to-person interview about their activity. And then, they recorded what kinds of activities they had done and how much each activity was taken during three days (1 day of day work, 1 day of night work, and 1 day of holiday work). In the future, if the energy expenditure by type of shift work is calculated through the survey on energy expenditure with portable indirect calorimetry, more accurate daily energy expenditure will be able to be calculated.
This study has limitations in the point that, because of occupational feature of the police officers doing shift work, the number of participants of this study was statistically insufficient. In the future, it is necessary to enlarge the number of subjects with special occupation, who can show a special type of work, other than those doing simple office work, and thereby evaluate their activities and physical activity levels. In doing so, a fundamental material necessary for their dietary guidelines and activity guide should be provided.

Conclusion

In this study, RMR measurement device using indirect calorimetry was used for measuring RMRs of 28 police officers doing shift work, and various analyses were performed to compare actual RMRs and the RMRs calculated from the popular estimation formulas-Harris-Benedict's, Body Surface Area's, the formula of WHO/NAO/FAO, DRI's, Cunnigham's, the formula of Mifflin et al., the formula of Owen et al., and the formula of Liu et al.-and evaluate the accuracy of these formulas. In addition, the subjects' physical activity levels previously reported were used for comparing and evaluating the calculated daily energy expenditure, energy intake and estimated energy requirement. Harris-Benedict's formula' margin of error between predicted values and actual values was within ± 10%, and the predicted percentage of the subjects was only 35.7%. In the aspect, it is considered that the estimation formulas including Harris-Benedict's formula, which were developed with ordinary people, have limitations when police officers doing shift work are applied to the formulas. Also, like police officers doing shift work, those whose work type is irregular and different by cycle have different energy expenditures depending on their work type. Therefore, different EERs should be set depending on each type of work in order to manage a proper weight through right energy balance, and furthermore to maintain a healthy weight to prevent chronic diseases.

Figures and Tables

Figure 1
Bland-Altman plots for measured RMR (MRMR) and predicted RMR (PRMR) by 12 selected equations (Harris-Benedict, Schofield[W], Schofield[WH], WHO, FAO/WHO/UNU, Owen, Mifflin, Cunningham, Liu, IMNA, Henry and Henry[WH]) for policemen doing shift-work.
cnr-1-66-g001
Table 1
Equations used to predict the RMR in this study
cnr-1-66-i001

RMR: resting metabolic rate, Ht: height in cm, Wt: weight in kg, Age in years, W: weight, WH: weight and height, FFM: fat free mass in kg, IMNA: Institute of Medicine of the National Academies.

*FAO/WHO/UNU Expert Consultation.

Table 2
Anthropometric measurement of the subjects (n = 28)
cnr-1-66-i002

*[Body weight (kg) / standard weight] × 100; W0.425 × H0.725 (cm) × 0.007184; Calculated by Heymsfield's formular [50]; §[Muscle (kg) / body weight (kg)] × 100; Waist/hip.

Table 3
RMR predictive equations in shift-work policeman based on mean difference, % difference, RMSPE and percentage of accurate prediction
cnr-1-66-i003

RMR: resting metabolic rate, RMSPE: root mean squared prediction error, W: weight, WH: weight and height, IMNA: Institute of Medicine of the National Academies.

*Predicted RMR - measured RMR; [(predicted RMR - measured RMR) / measured RMR] × 100; Pearson's correlation coefficients; §Percentage of subjects predicted by equation within 90% to 110% of measured RMR; Percentage of subjects predicted by equation < 90% of measured RMR; Percentage of subjects predicted by equation >110% of measured RMR; **Values are presented as mean±SD; ††Significantly different by paired t-test between predicted RMR and measured RMR at ‡‡p < 0.05; §§p < 0.01; ∥∥p < 0.0001.

Table 4
Pearson's correlation coefficients of measured resting metabolic rate with related variables
cnr-1-66-i004

RMR: resting metabolic rate.

*Calculated by Heymsfield's formular [50]; [Muscle (kg) / body weight (kg)] × 100; Significant correlation at p < 0.01.

Table 5
Comparison of measured energy expenditure with daily energy intake (n = 28)
cnr-1-66-i005

*Mean result of ANOVA for repeated measurement by day shift, night shift and holiday; Measured resting metabolic rate × physical activity level; Values are presented as mean ± SD; §Significant difference between daily energy expenditure and daily energy intake at p < 0.05 by paired t-test; Significant difference between daily energy expenditure and estimated energy requirements at **p < 0.01 by paired t-test.

References

1. Kogi K. Introduction to the problems of shift work in hours of works temporal factors in work schduling. 1985. New York: John Wiley and Sons.
2. LaDou J. Occupational and environmental medicine. 1997. 2nd ed. Stamford: Appleton & Lange.
3. Statistics Korea. Socio-Statistical Survey. 2010. cited 2012 July 4. Available from http://kosis.kr/abroad/abroad_01List.jsp?parentId=A.
4. National police agency. Improving and efficient police force operating basic planning positions. 2008.
5. Lee SA. New criminal justice. 2001. Seoul: Publishing Company Daemyoung.
6. Akerstedt T. Psychophysiological effects of shift work. Scand J Work Environment Health. 1990. 16:67–73.
7. Lee SH, Park JS, Kim EK. Assessment of daily steps, physical activities and activity coefficient of policemen who do shift-work. Korean J Nutr. 2007. 40:576–583.
8. Matarese LE. Indirect calorimetry: Technical aspect. J Am Diet Assoc. 1997. 97:S154–S160.
9. Stewart CL, Goody CM, Branson R. Comparison of two systems of measuring energy expenditure. JPEN J Parenter Enteral Nutr. 2005. 29:212–217.
crossref
10. Harris JA, Benedict FG. A biometric study of basal metabolism in man. 1919. Washington DC: Carnegie Ins..
11. FAO/WHO/UNU Expert consultation. Energy and protein requirements. World Health Organ Tech Rep Ser. 1985. 724:71–112.
12. The Korean Nutrition Society. Dietary reference intakes for Koreans. 2010. Seoul: Hanarum Publishers.
13. Trumbo P, Schlicker S, Yates AA, Poos M. The National Academies. Dietary reference intakes for energy, carbohydrate, fiber, fat, fatty acids, cholesterol, protein and amino acids. J Am Diet Assoc. 2002. 102:1621–1630.
crossref
14. Du Bois D, Du Bois EF. A formula to estimate the approximate surface area if height and weight be known. 1916. Nutrition. 1989. 5:303–311.
15. Weir JB. New methods for calculating metabolic rate with special reference to protein metabolism. J Physiol. 1949. 109:1–9.
crossref
16. Taaffe DR, Thompson J, Butterfield G, Marcus R. Accuracy of equations to predict basal metabolic rate in older women. J Am Diet Assoc. 1995. 95:1387–1392.
crossref
17. Bland JM, Altman DG. Statistical methods for assessing agreement between two methods of clinical measurement. Lancet. 1986. 1:307–310.
crossref
18. Nelson KM, Weinsier RL, Long CL, Schutz Y. Prediction of resting energy expenditure from fat-free mass and fat mass. Am J Clin Nutr. 1992. 56:848–856.
crossref
19. Heymsfield SB, Gallagher D, Wang Z. Body composition modeling. Application to exploration of the resting energy expenditure fat-free mass relationship. Ann NY Acad Sci. 2000. 904:290–297.
crossref
20. Webb P. Energy expenditure and fat-free mass in men. Am J Clin Nutr. 1981. 34:1816–1826.
21. Park JA, Kim KJ, Yoon JS, Koo JO, Yoon JS. A Comparison of the resting energy expenditure of Korean adults using indirect calorimetry. Korean J Community Nutr. 2003. 8:993–1000.
22. Lee GH, Kim MH, Kim EK. Accuracy of predictive equations for resting metabolic rate in Korean college students. Korean J Community Nutr. 2009. 14:462–473.
23. Owen OE, Kavle E, Owen RS, Polansky M, Caprio S, Mzzoli MA, Kendrick ZV, Bushman MC, Boden G. A reappraisal of caloric requirements in healthy women. Am J Clin Nutr. 1986. 44:1–19.
crossref
24. Owen OE, Holup JL, D'Alessio DA. A reappraisal of caloric requirements of men. Am J Clin Nutr. 1987. 46:875–885.
25. Mifflin MD, St Jeor ST, Hill LA, Scott BJ, Daugherty SA, Koh YO. A new predictive equation for resting energy expenditure in healthy individuals. Am J Clin Nutr. 1990. 51:241–247.
crossref
26. Frankenfield D, Roth-Yousey L, Compher C. Comparison of predictive equations for resting metabolic rate in healthy nonobese and obese adults: a systematic review. J Am Diet Assoc. 2005. 105:775–789.
crossref
27. Daly JM, Heymsfield SB, Head CA, Harvey LP, Nixon DW, Katzeff H, Grossman GD. Human energy requirements: overestimation by widely used prediction equation. Am J Clin Nutr. 1985. 42:1170–1174.
crossref
28. Bouchard C, Trembly A, Leblanc C, Lortie G, Savard R, Theriault G. A method to assess energy expenditure in children and adult. Am J Clin Nutr. 1983. 37:461–467.
29. Ravussin E, Lillioja S, Anderson TE, Christin L, Bogardus C. Determinants of 24-hour energy expenditure in man. Methods and results using a respiratory chamber. J Clin Invest. 1986. 78:1568–1578.
crossref
30. Benedict FG. The racial elements in human metabolism. Am J Physiol Anthropol. 1932. 16:463–473.
31. Schofield C. An annotated bibliography of source material for basal meabolic rate data. Hum Nutr Clin Nutr. 1985. 39:Suppl 1. 42–91.
32. FAO/WHO/UNU. Energy and protein requirements: Report of a joint FAO/WHO/UNU Expert Consultation. World Health Organ Tech Rep Ser. 1985. 724:1–206.
33. Liu HY, Lu YF, Chen WJ. Predictive equations for basal metabolic rate in chinese adults. A Cross-Validation Study. J Am Diet Assoc. 1995. 95:1403–1408.
34. Henry CJ, Rees DG. New predictive equations for the estimation of basal metabolic rate in tropical peoples. Eur J Clin Nutr. 1991. 45:177–185.
35. Patwarthan VN. Indian Research Fund Association Special Report No. 12. Studies on basal metabolism in Indians. 1944. Bombay:
36. Banerjee S. ICMR Special Report No. 43. Studies in energy metabolism. 1962. New Delhi:
37. Shetty PS, Soares M. Basal metabolic rate in South Indian males. 1986. Bangalore, India: FAO.
38. Durnin JV. Low energy expenditures in free-living populations. Eur J Clin Nutr. 1990. 44:Suppl. 95–102.
39. Chang UJ, Lee KR, Chang UJ. Correlation between measured resting energy expenditure and predicted basal energy expenditure in female college students. J Korean Soc Food Sci Nutr. 2005. 34:196–201.
crossref
40. Bandini LG, Schoeller DA, Dietz WH. Energy expenditure in obese and nonobese adolescents. Pediatr Res. 1990. 27:198–203.
crossref
41. Cunningham JJ. A Reanalysis of the factors influencing basal metabolic rate in normal adults. Am J Clin Nutr. 1980. 33:2372–2374.
crossref
42. Ministry of Health and Welfare. 2010 National Health and Nutritional Survey Report in Korean. 2010. cited 2012 July 4. Available from http://knhanes.cdc.go.kr.
43. Park JA, Kim KJ, Yoon JS. A Comparison of energy intake and energy expenditure in normal-weight and over-weight Korean adults. Korean J Community Nutr. 2004. 9:285–291.
44. Lim WJ, Yoon JS. A longitudinal study on seasonal variation of physicl activity and body composition of rural women. Korean J Nutr. 1995. 28:893–903.
45. Johan L, Solvoll K, Bjomeboe GE, Drevon CA. Under-and over reporting of energy intake related to weight ststus and lifestyle in a nationwide sample. Am J Clin Nutr. 1998. 68:266–274.
46. Johanson RK, Goran MI, Poehlman ET. Correlations of over-and underrporting of energy intake in healthy older men and women. Am J Clin Nutr. 1994. 50:1286–1290.
47. Lissner L, Habicht JP, Strupp BJ, Levitsky DA, Haas JD, Roe DA. Body composition and energy intake : do overweight women overeat and underreport? Am J Clin Nutr. 1989. 49:320–325.
crossref
48. Myers RJ, Klesges RC, Eck LH, Hanson CL, Klem ML. Accuracy of self-reports of food intake in obese and normal-weight individuals: effects of obesity on self-reports of dietary intake in adults females. Am J Clin Nutr. 1988. 48:1248–1251.
crossref
49. Hong SK. Energy balance and obesity. J Korean Soc Study Obes. 2000. 9:1–5.
50. Heymsfield SB, McManus CB, Smith J, Stevens V, Nixon DW. Anthropometric measurement of muscle mass, revised equations for calculating bone-free arm muscle area. Am J Clin Nutr. 1982. 36:680–690.
crossref
TOOLS
Similar articles