

 PDF
PDF ePub
ePub Citation
 Print
Print


Introduction
Manganese (Mn) is an essential nutrients for normal metabolism of protein, fat and carbohydrate. This micronutrient also intervenes with regulation of various physiological processes such as immune function, energy metabolism, reproduction, digestion and skeletal development [1]. Previous animals studies reported that Mn deficit conditions impair normal growth, reproductive function, insulin sensitivity, lipid metabolism and lower blood HDL cholesterol [1,2]. Mn deficiency was associated with erythematous rash, emotional changes and pain during the pre-menstruation period in clinical and epidemiological studies [1-3]. Such metabolic disorders and diseases under Mn deficiency are attributed to loss of regulation in oxidative stresses.
Mn mediates many physiological changes through regulation of oxidative stress related proteins such as glutathione peroxidase (GPx), reduced glutathione (GSH), Mn-dependent superoxide dismutase (MnSOD). At the same time these oxidation modulating enzymes are regarded as indicators for physiological Mn status. MnSOD is reported to protect cells from various carcinogens such as toxic chemical substances and radioactive materials, oxidative stresses and inflammatory responses [3]. The activation of these oxidation modulating factors including SOD have been reported to be regulated by several dietary factors [4-7]. Mn deficit reduces Mn-SOD activation and leads accumulation of superoxide anion in mitochondria which produce continuous lipid peroxides and membrane damage and cellular dysfunction [4]. Mn depletion in animals reduces Mn concentration of tissue and decreases MnSOD activity in heart and liver [5]. Zidenberg-Cherr et al. [6] reported that the lack of Mn in a 2 month old female Sprague Dawley rats presented lower GPx, SOD activity than the contrast group of animals and Mn deficiency increased thiobarbituric acid reactive substance (TBARS), which augmented oxidative stresses in those animals. On the other hand, although the rat without Mn supplement presented lower Mn content than the rat provided with Mn supplement, differences were not found in SOD activity [7]. Furthermore, Mn was reported to protect lipid oxidation induced tissue oxidation which was evidenced by decrease level of TBARS [8,9]. Mn inhibits oxidative stress induced growth of cancer cells [10], and the lifespan was extended by attenuation of oxidative process in each tissue [11]. In a study conducted with 47 young women (average age: 24), the level of oxidative stress was higher in subjects without Mn supplement (1.7 mg/day) than women with Mn supplement (15 mg/day) [3].
Such Mn related anti-oxidative protection factors were reported to be decreased in fatty liver and diabetes [12,13] which is closely related with obese condition. Higdon & Frei [14] defined obesity as the condition of oxidative stress and reported that imbalance between free radical production and physiological anti-oxidative system under obese condition triggered obesity-related symptoms, such as arteriosclerosis, diabetes and arthritis [15]. Additionally Vincent et al. [16] reported that a high correlation exist between obesity and oxidative stress. Although Mn was reported to control oxidative stresses mainly through the regulation of SOD activity, studies conducted for estimating accurate Mn intake requirement and assessing daily Mn intake were limited. In particular, among various diet control factors, there have been no research to investigate the direct relationship between intake of Mn and metabolic syndromes such as obesity, diabetes and hypertension. Thus, this study evaluated the daily intake of Mn of Korean men and women in different degree of obesity and compared oxidative stress markers among study subject. Also this study attempted to define the relationship between Mn intake and oxidative stress indicators by correlation analysis.
Materials and Methods
Subjects
The survey was conducted on 333 subjects who agreed to participate in the survey after receiving sufficient explanation on the purpose and content of research. Age range of study subjects were in between 19-87 year olds. This study was conducted after an approval by the Institutional Review Board (IRB) of College of Medicine at Chung-Ang University. All study subjects who participate this study signed consent forms with explanatory details of the study.
Anthropometic measurement
For classification of the degree of obesity in study subjects body mass index (BMI) was calculated by measuring heights and body weights. Height was measured by a standard stadiometer and weight in kilograms was measured on a calibrated Inbody (Biospace, Seoul, Korea) system. The mean value was calculated after carrying out all measurements 2 times. After calculating the BMI based on the height and weight measurement values, subjects were classified into three groups: normal group - 18.5 ≤ BMI ≤ 22.9 (105 subjects), overweight group - 23 ≤ BMI ≤ 24.9 (88 subjects) and obese group - at 25 ≤ BMI (140 subjects). Male subject in each group was composed of 42 subjects (40.0%) in normal group, 39 subjects (44.3%) in overweight group, and 60 subjects (42.9%) in obese group. In this regard, significant difference was not presented in gender distribution by each group.
Dietary intake survey
Dietary intake survey was carried out through the 24-hour recall method by individual interviews with trained researchers. Thus, this study surveyed the type and amount of food and food materials ingested by subjects through their breakfast, lunch, dinner and snacks on the day before the survey. The researchers presented food models and pictures to help subjects accurately memorize the amount of ingested food. The results of the meal intake survey was subjected to Can-Pro 3.0 (The Korean Nutrition Society, 2005) to extract the intake quantity of Mn and other nutrients of each subject. The amount of Mn ingested through food was calculated by using data of precedent studies [17] and food composition table [18] indicating Mn content in food.
Blood and urine collection
The vacuum tube for blood test and the EDTA-coating vacuum tube for blood test were used to collect 15 ml of venous blood of fasting subjects in the morning after the dietary intake survey. Spot urine was collected afterward. The blood collected in the vacuum tube was centrifuged for 15 minutes in ×400 g to separate the serum. The serum and blood collected in the EDTA-coating vacuum tube were stored until the examination was carried out in -20℃. Furthermore, the collected samples were refrigerated in -20℃ until the spot urine was separated and analyzed according to analysis items.
Analysis of blood oxidative indicators
Blood GSH analysis
Erythrocytic GSH was analyzed by using the method presented by van Klaveren et al. [19] Thus, 500 µL of whole blood was collected and centrifuged for 5 minutes at 4℃, ×2500 g. The supernatant liquid was eliminated and distilled water was added into the remaining red blood cells to achieve hemolysis. Three hundreds µL of TCA was added to 100 µL of red blood cells in hemolytic fluid, mixed for 15 seconds and centrifuged for 5 minutes at ×10,000 g. Supernatant (20 µL) was mixed with daily buffer (0.248 mg/mL NADPH in 143 mM sodium phosphate, 6.3 mM Na4-EDTA at pH 7.5, 6 mM DTNB) and distilled water (7:1:1.8) and incubated for 15 minutes at 35℃. 10 µL of GSSG reductase (5 U/mL) was added in reaction mix for 20 minutes at 35℃. The color change was measured by the spectrophotometer (UVIKON, Kontron Inc.) at 412 nm. The content of GSH in the red blood cells was expressed as µmol/g Hb.
Blood GPx analysis
Blood GPx was analyzed by using the method presented by Aydin et al. [20]. 980 µL liquid mixed with 50 mM tris buffer (pH 7.6), 1 mM Na2EDTA, 2 mM NADPH, 4 mM sodium azide, 1 unit/mL glutathione reductase was mixed with 20 µL of the red blood cell hemolytic liquid gained through the method mentioned above and reacted for 5 minutes at 37℃. Afterward, 8.8 mmol/L H2O2 was injected and spectrophotometer (UVIKON, Kontron Inc.) was used to measure optical density of the sample for 3 minutes at 340 nm. The GPx activity within the red blood cells was presented U/g Hb.
Analysis of urinary oxidation-related indicator
Urinary TBARS, urinary lipid peroxidation indicator, was analyzed according to the method presented by Tagesson et al. [21]. TBARS was measured by mixing 300 µL of 0.5 M phosphoric acid with 50 µL of 23 mmol TBA reagent in the glass test tube and heated the liquid in 95℃ for an hour. After cooling the liquid, 100 µL of methanol was added and analyzed by HPLC (Waters, 501). The concentration of mal onaldehyde (MDA), the peroxide of TBA, was presented by modifying the concentration as mg/g creatinine (Cr) [22].
Statistical analysis
The results gained from this experiment were st atistically anlayzed by the SAS program (version 9.2; SAS Institute Inc., Cary, NC). The comparison among different BMI groups used the ANOVA test and Duncan's multiple range test to verify the significance of differences. The correlation analysis adjusted for age, gender, body mass index and energy intake quantity was conducted by using Pearson's correlation coefficient. The significance test was implemented at p < 0.05.
Results
General characteristics
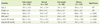
Results of general measurement of subjects by different categories of obese condition were shown in Table 1. The average age of subjects was 54.7 year old and age distribution in each BMI group was not significantly different. The average height was 158.9 cm and significant difference was not presented by different BMI group. The weight was significantly high in the order of the obese group (69.6 kg), overweight group (61.3 kg) and normal group (54.5 kg) (p < 0.001). The blood pressure was significantly high in the order of the obese group (131.5/76.7 mmHg), overweight group (125.9/75.1 mmHg) and normal group (119.7/71.7 mmHg) (p < 0.01).
Nutrients and Mn intake status
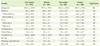
The average of daily energy intake of subjects was 1565.3 kcal (Table 2). Energy intake of each different group categorized by different obese condition was not significantly different. Significant difference was not presented between the three groups in the daily intake of protein, fat, carbohydrate, dietary fiber cholesterol. The daily Mn intake was not significantly different among normal group (4.3 mg, 2.8 mg/1,000 kcal, 116.3% of recommended intake), overweight group (4.2 mg, 2.7 mg/1,000 kcal, 113.4% of recommended intake) and obese group (4.1 mg, 2.6 mg/1,000 kcal, 110.1% of recommended intake).
Biochemical indicators for oxidative stress
The level of blood GSH and GPx of total subjects were 2.3 µmol/g Hb and 43.8 U/g Hb, respectively (Table 3). The blood level of GSH and GPx in each different BMI group was not significantly different. The average of MDA concentration in urine was measured as 1.3 µmol/g Cr in total subject and not significantly different with the values obtained from each different BMI group.
Correlation between Mn intake and indices of oxidative stress
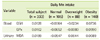
Table 4 presents the results for the correlation between indices of oxidative stress and the Mn intake adjusted for age, gender, body mass index and energy intake. The correlation value between the dietary Mn intake and blood GPx/GSH and urinary MDA of subjects was mostly low and was below 0.01. Any significant correlation was not found in total subjects and in different BMI groups.
Discussion
This study investigated the Mn intake and the blood and urinary oxidation indices in normal adults and obese subjects in South Korea and analyzed the correlation between oxidative stress and Mn intake. Mn intake and oxidation indicators was not significantly different by different BMI. Also, significant correlation was not presented between dietary Mn intake and blood GPx/GSH and urinary MDA, and even after adjusting for age, gender, body mass index and energy intake the correlation was not found. There are only limited number of studies which evaluate Mn intake of Koreans due to the lack of database regarding Mn content in food. Sung & Yoon [23] reported that the daily Mn intake of female college students between age of 21-26 was 3.8 mg, whereas Gwag et al. [24] reported that the daily Mn intake of the elderly in certain region in Korea was 5.5-6.0 mg. Our data indicated that the daily Mn intake of total study subjects was 4.2 mg without significant difference between different BMI groups. This amount is higher than that of people from Western countries and similar to previous reports in Korea. The adequate Mn intake of Korean adults was 4.0 mg/day and 3.5 mg/day for men and women, respectively. The upper intake level was set as 11 mg/day for both men and women [25]. The Mn intake of research subjects in this study slightly exceeded the adequate intake and was lower than the upper intake level. On the other hand, the fact that this study did not present significant differences in Mn intake in different BMI groups was attributed to similar energy intake in each groups. As the average body mass index of the obese group was measured as 27.8 kg/m2 which is lower BMI than the BMI of common obese subjects in Western country (>30 kg/m2) only subtle or no differences exists in meal intake between the obese groups and normal group.
Greger [26] reported that the daily Mn intake was 0.7-10.9 mg which is remarkable variations among people in Western countries with different dietary patterns (e.g. regular meals vs. vegetarian meals). Thus, various meal patterns may affect the actual intake of Mn in diet. Nkwenkeu et al. [27] reported the daily Mn intake was estimated 2.0-8.8 mg worldwide. In particular, the daily Mn intake of subjects ingesting the traditional American diet composed of high amount of meat, refined food, milk and sugar and low amount of whole grains and vegetables was 2-5 mg, the lower limit of the Estimated Safe and Adequate Daily Dietary Intake (ESADDI). The daily Mn intake in many country was shown as follows: U.S. - 2.4 mg, Germany - 2.7 mg, Belgium - 2.6 mg, England - 4.6 mg, Australia - 2.9 mg, India - 2.2 mg, Canada - 2.9 mg [27]. On the other hand, Rubio et al. [28] reported that the average daily intake of Mn of subjects who commonly consumed plant based foods reached as high of 13-20 mg. Since traditional Korean diet are mostly composed of plant based foods the Mn intake shown in this study implicate that Korean adults maintain adequate Mn intake suggested by the Korean Nutrition Society [25].
Biochemical indices of blood and urinary oxidative stress, which are reported to closely related with Mn intake condition, were compared by the degree of obesity (i.e. the normal group, overweight group and obese group). In blood oxidized lipid species (e.g. Oxidized-LDL) produces oxidative damage in cellular membranes and induce abnormal signal transduction and trigger inflammatory responses [29-31]. SOD, catalase (CAT) and GPx are main antioxidative enzymes and effectively eliminate oxidative radicals generated by diet or disease conditions [14,19]. Obese subjects with high body fat were reported to present a high level of oxidative stress caused by lipid metabolites and inflammatory mediators derived from body fat. However, anti-oxidative defense ability of obese subjects, such as GPx activity or GSH was reported to be lower than normal subjects [14]. Olusi [32] reported that the SOD activity of red blood cells was presented 41% lower in obese subjects with BMI above 30 kg/m2, even GPx activity was reported to be 22% lower than normal subjects. Constantin et al. [33] reported that oxidative stress was getting worse with increase of age. Unlike precedent studies, this study did not present significant differences in blood GSH/GPx and urinary MDA concentration by different BMI groups. These results may due to the low degree of obesity of obese subjects as mentioned above.
As Mn is the main component of MnSOD, the deficit of Mn reduces enzyme activity and further generates cascade effects in other antioxidative enzymes such as GPx and continuous formation of lipid peroxidants to damage systemic antioxidative defense of our body. Thus, the deficit of Mn causes changes fatty acid composition of the cellular membrane, damages cellular stability and reduces the response to the oxygen radicals [34]. Previous studies reported that oxidative damage of DNA in several tissue was increased in animals by Mn deficiency [35], along with suppressed contraction [36] and consistently low SOD activity in cardiac muscle [37]. SOD activity of the lymphoid was increased by supplementing 15 mg/day of Mn in women for more than 90 days [3]. However, this study did not present significant correlation between Mn intake and oxidative stress in different BMI. When considering the fact that most precedent studies [3,5,6,8,9,37] reported the significant correlation with oxidative stress-related indicators in Mn deficit or supplementation, the result in this study implicates that, under sufficient level of Mn intake, antioxidative defence is well maintained even in obese conditions.
In human Mn deficiency is rare as various food sources for Mn exist and overconsumption is unlikely to happen as the absorption rate of Mn is below 5% [25]. Hence our present study would be a meaningful study to establish the relationship between oxidative stress markers and Mn intake under the level of daily Mn intake rather than under extreme deficit or excess of Mn conditions. In addition to the relationship between Mn intake and oxidative stresses, biochemical Mn marker which reflect body Mn status and its role in oxidative stress should be investigated in next study. As previous studies do not suggest accurate biochemical indicators which sensitively reflect physiological Mn status, future research is warranted to develop reliable markers for Mn status. Go et al. [38] reported that no signifiant difference was found in the serum Mn concentration of normal subjects and cataract patients by analyzing the concentration of several minerals related to oxidative stresses in serum of cataract patients. As this study did not analyze biochemical indicators such as the serum Mn concentration, it presents limitations in carrying out in-depth discussions about the relationship between the Mn intake and indicators for oxidative stresses. As this study concluded that there was no correlation between oxidative stress indicators and the daily Mn intake in different level of obesity, follow-up studies must conduct in-depth biochemical assessment of body Mn status and also investigate subjects with various Mn intake to further extend our understanding of the relationship between Mn intake and oxidative stress indicators.
Conclusion
This study evaluated the daily Mn intake of 333 Korean men and women according to the BMI of study subjects and compared indicators related with oxidative stress to analyze the relationship between Mn intake and oxidative stresses. The results can be summarized as the following. Although the weight and blood pressure of research subjects were significantly higher according to the increase of BMI (p < 0.01), no significant difference was found in Mn intake and oxidation indicators (GSH, GPx and MDA) by different BMI groups. Also, blood GSH/GPx and urinary MDA was not significantly correlated with dietary Mn intake and adjusted Mn intake for age, gender, BMI and energy intake. In conclusion Mn intake in the level of daily consumption was not significantly correlation with oxidative stresses in Korean adults with different degree of obesity.

 XML Download