

 PDF
PDF ePub
ePub Citation
 Print
Print


INTRODUCTION
Glioblastoma is the most common malignant brain tumor, accounting for approximately 12–15% of all primary intracranial neoplasm and 60–75% of glial tumors [12]. In most European and North American countries and Australia, the annual incidence is about 3–4 cases per 100,000 population [1]; whereas, the incidence is relatively low in Korea with 0.59 cases per 100,000 population per year [3]. After a randomized phase III trial with glioblastoma patients showed that concomitant and adjuvant temozolomide in addition to standard postoperative radiotherapy improved the length of survival relative to postoperative radiotherapy alone in 2004 [4], this therapeutic approach was considered as the new standard treatment for glioblastoma resulting in increasing the median length of survival to 12–15 months, albeit this result is still considered to be dismal.
In terms of the prognostic factors for glioblastoma, the methylation status of O6-methyl guanine DNA methyltransferase (MGMT) gene promoter has been revealed to be a strong predictor of the survival of glioblastoma patients, according to the long-term follow-up of a recent randomized phase III clinical trial and final results of the initial trial in 2004 [5]. In literature, the age of patients [45678], performance status [789], surgical extent [457], recursive partitioning analysis (RPA) class [5678], and postoperative chemotherapy and/or radiotherapy [6710] were reported as the prognostic factors for survival in glioblastoma patients. In the assessment of performance status, the Karnofsky Performance Scale (KPS) or the Eastern Cooperative Oncology Group (ECOG)/World Health Organization (WHO) performance status were generally used in practice. RPA class also included the performance status estimated by the KPS score in making a group for analysis. However, neuro-oncologists have encountered both patients with low KPS score who have survived longer as well as those with high KPS score and shorter survival rates, which presents a dilemma for these neuro-oncologists in predicting the prognosis of their glioblastoma patients.
Recently, the Response Assessment in Neuro-Oncology (RANO) working group was established to develop new standardized response criteria for clinical trials in brain tumors. This international and multidisciplinary effort is trying to overcome the limitation of the McDonald criteria and develop novel response and progression assessment criteria. As a part of this effort, the Neurological Assessment in Neuro-Oncology (NANO) working group developed a more objective, quantifiable proxy for the clinical status of patients with a brain tumor to estimate the therapeutic response focused not on the radiologic findings, but the clinical conditions.
The aims of this study were to investigate the role of the NANO scales in predicting the prognosis of glioblastoma patients, and compare these results with those predicted by the KPS, and ECOG/WHO performance status. In addition, we also examined other prognostic factors in glioblastoma patients and validated our results.
MATERIALS AND METHODS
Patient collections
The protocol of this study was approved by the Institutional Review Boards of our institute (SCMC 2017-04-006). The informed consent was omitted because this study was composed of a retrospective review of medical record simply, and there was no risk of harm to the patients. We obtained the data from the medical records of patients who underwent surgical resection or biopsy at our institute and were histopathologically diagnosed with glioblastoma from January 2002 to December 2015. Inclusion criteria were as follows; 1) patients with a pathologically proven glioblastoma, 2) patients with a newly diagnosed glioblastoma, 3) sufficient radiological image at pre and postoperative period and regular follow up period, and 4) sufficient clinical data of performance status on the medical record written by nurse or physician. Any patients who did not fulfill the inclusion criteria or was lost during follow-up were excluded. All patients included in this study had a newly diagnosed glioblastoma and were treated and followed up at our institution until death. All patients had undergone resection or biopsy sampling of their tumors. In most cases, adjuvant conventional radiotherapy, chemotherapy, or both were performed after the diagnosis of glioblastoma.
Clinical and histopathological analysis
Epidemiological characteristics (including sex, age at the time of surgery, and RPA class), type of postoperative treatment, type of salvage treatment after tumor recurrence, length of follow-up, and time of death were retrospectively reviewed in the medical record of each patient. The radiation dosage, type of radiotherapy administered, and the regimen and timing of chemotherapy were also examined.
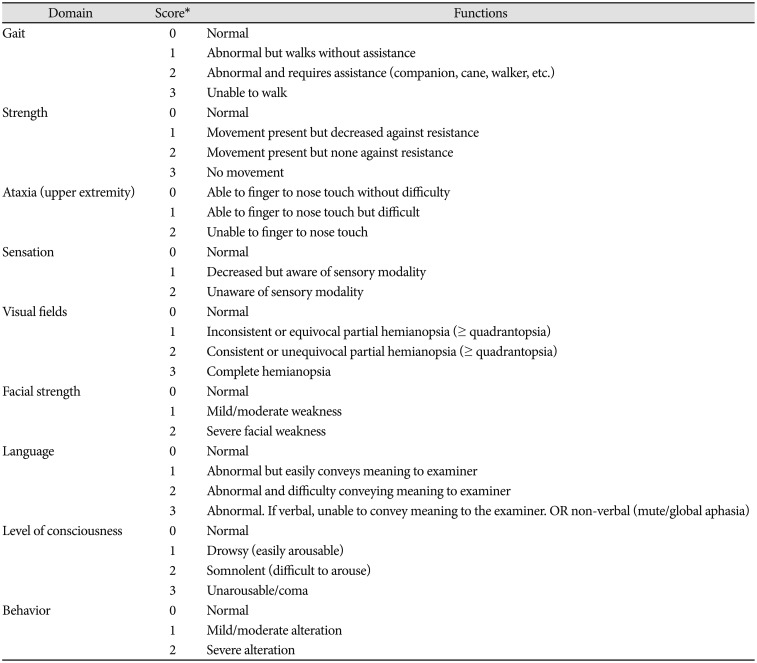
The performance status of patients was estimated by the KPS [11], ECOG/WHO performance status [12], and NANO scale [13]. The NANO scale is a simple neurological assessment conducted and reported by three individual physicians who evaluates the patient in nine domains: gait, strength, upper extremity ataxia, sensation, visual fields, facial strength, language, level of consciousness, and behavior. Each domain contains a score from 0 to 3 or 0 to 2, depending on the domain, with higher scores indicating worse neurologic function (Table 1). The performance status was reviewed and recorded at the time of initial diagnosis and tumor progression through the use of the four tools. If there was discrepancy of the NANO scales between investigators, they discussed and determined the optimal scale.
All hematoxylin and eosin stained slides were reviewed by two pathologists using the WHO classification of 2007 and who were blinded to the clinical and pathological parameters. The following glioblastoma sample was excluded: 1) the sample which was almost entirely necrotized, or 2) the tumor contribution to the section was less than 80% [14]. The methylation status of the MGMT gene promoter in formalin-fixed, paraffin-embedded material was determined by methylation-specific polymerase chain reaction as described by Palmisano et al. [15].
Radiological analysis
A radiological evaluation was performed according to the protocol of our institution [16]. The extent of tumor resection and response to treatment was estimated by two different neuroradiologists who were blinded to the clinical and pathological findings. The extent of the resection was estimated from magnetic resonance image (MRI) scans acquired within 48 hours of surgery. A subtotal resection (STR) was defined as removal of more than 90% of the gadolinium (Gd)-enhancing lesion on enhanced T1-weighted MRI scans, and gross-total resection (GTR) was defined as lack of a detectable Gd-enhancing lesion. Regarding the treatment response, tumor measurements for determining treatment responses according to the Macdonald criteria were based on the product of orthogonal diameter on the image with the largest Gd-enhancing tumor area [17]; complete remission was defined as the complete disappearance of all evidence of lymphoma; partial response as ≥50% decrease in tumor size; progressive disease as a ≥25% increase in tumor size or the appearance of any new lesion; and stable disease as situations that did not meet any of these three previous criteria. If multiple lesions were present, the sum of the products of individual measurable lesions was calculated. Radiological studies were performed at regular 3-month intervals during the follow-up period or if there was clinical suspicion of disease progression.
Statistical analysis
The differences between subgroups were analyzed with the Student t-test for normally distributed continuous values and with the Mann-Whitney U-test for nonnormally distributed continuous values. The chi-square test was used to analyze categorical variables. To define the cutoff score of NANO scale for predicting better prognosis, the receiver operating characteristic (ROC) curve analysis and sensitivity-specificity test were performed [18]. The overall survival (OS) was calculated according to the Kaplan-Meier method, and comparisons among groups were performed with log-rank tests. Variables found to be statistically significantly associated with OS of glioblastoma patients in the univariate analyses were examined in a multivariate analysis. Moreover, several additional variables that have been associated with OS in the literature and that were of interest to us were also included in the multivariate analysis. In this analysis, the Cox proportional-hazards regression model was used to assess the independent effects of specific factors on OS and to define the hazard ratios (HRs) of significant covariates. Two-sided p-values <0.05 were considered statistically significant. SPSS software, version 18.0 (SPSS Inc., Chicago, IL, USA) was used for the statistical analysis.
RESULTS
Clinical characteristics of patients
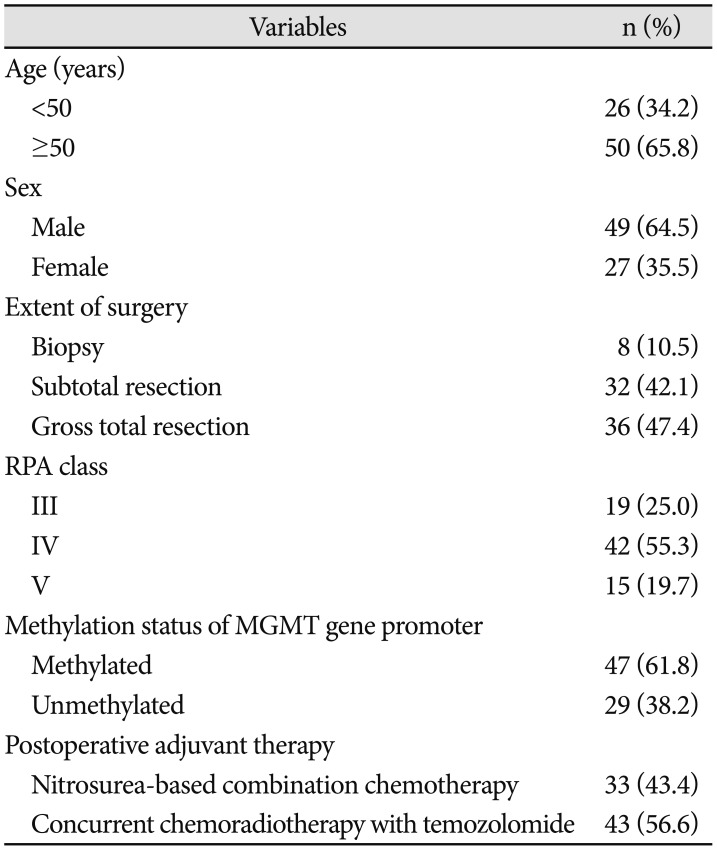
Among 91 total cases of glioblastoma recorded in the selected study period, data from 76 patients (49 men and 27 women) were eligible for inclusion in our analysis (Table 2); 13 patients were excluded due to insufficient medical records with inability to estimate the performance status, and 2 patients were excluded due to inadequate histopathological condition of their samples. All patients were followed up for at least three months, with a mean follow-up length of 19.8 months (range 4.1–43.5 months). The mean age of these patients at the time of a new diagnosis of glioblastoma was 52.6 years (range 27.0–77.4 years). The most frequent chief presenting symptoms were headache in 38 patients (50.0%), focal neurological deficits such as motor weakness or dysphasia in 16 (21.1%), altered mentation in 13 (17.1%), and seizures in nine (11.8%).
Sixty-eight patients (89.5%) had undergone radical resection of tumors, and eight (10.5%) had a diagnosis of glioblastoma after a biopsy. For postoperative adjuvant treatment, 33 patients (43.4%) received nitrosourea-based combination chemotherapy with or without radiotherapy, and 43 (56.6%) received concurrent chemoradiotherapy with temozolomide.
After tumor progression, 35 patients (46.1%) underwent a second resection, and eight (10.5%) were treated with repeated radiotherapy, 45 (59.2%) with salvage chemotherapy, and nine (11.8%) with supportive care only.
Radiological and histopathological characteristics of glioblastoma
All glioblastomas were located in the supratentorial area; the main locations of involvement were as follows: 40 tumors (52.6%) were located in the frontal lobe, 20 (26.3%) in the temporal lobe, six (7.9%) in the parietal lobe, five (6.6%) in the occipital lobe, and five (6.6%) in the thalamus and basal ganglia. The mean maximal tumor diameter in the T1-weighted, Gd-enhancing image was 4.2 cm (range 1.5–7.5 cm), and the mean extent of peritumoral edema was 3.6 cm (range 2.1–5.8 cm). The MGMT gene promoter was methylated in 47 patients (61.8%) and unmethylated in 29 (38.2%) (Table 2).
Performance status of the glioblastoma patients
There were 6 patients (7.9%) who were assessed differently with NANO scale by individual investigators; 4 patients (5.3%) were different in NANO scale by 2 investigators and 2 patients (1.6%) were different in NANO scale by 3 investigators.
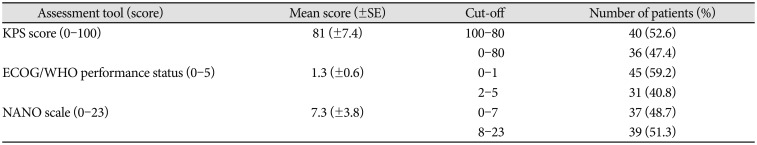
At the time of initial diagnosis, the mean [±standard deviation (SD)] KPS score was 81 (±7.4); 40 (52.6%) patients had a KPS score of ≥80. The mean (±SD) ECOG/WHO performance status was 1.3 (±0.6); 45 (59.2%) patients had a ECOG/WHO performance status 0–1 (Table 3).
During the follow-up period, 72 patients (94.7%) experienced tumor progression, and the mean time to progression was 9.6 months [95% confidence interval (CI) 6.8–12.4 months]. The performance status of patients got worse at the time of tumor progression compared to that of patients at the time of initial diagnosis; mean (±SD) KPS score was 69 (±8.2); 31 (43.1%) patients had a KPS score of ≥80; the mean (±SD) ECOG/WHO performance status was 1.6 (±0.7); 32 (44.4%) patients had a ECOG/WHO performance status 0–1.
In terms of the NANO scale at the time of initial diagnosis of glioblastoma, the mean (±SD) score of NANO scale was 7.3 (±3.8); 37 (48.7%) patients had a NANO scale score of 0–7. An ROC curve analysis of the mean NANO scale score predicting longer survival indicated an area under the curve of 0.708. The optimal threshold of the mean score of NANO scale for distinguishing between patients with longer survival and those with shorter survival was 7, and this threshold yielded a sensitivity of 65.1% (95% CI 57.2–72.9%), a specificity of 72.6% (95% CI 65.9–79.3%), and an accuracy of 77.8% (95% CI 68.8–86.8%). The mean (±SD) score of NANO at the time of progression increased to 11.4 (±4.2), and only 21 (29.2%) patients had a NANO scale score of 0–7.
Overall survival
During the follow-up period, 70 patients (92.1%) died, and the mean length of OS was 18.9 months (95% CI 14.1–23.7); all patients succumbed to the disease progression of glioblastoma.
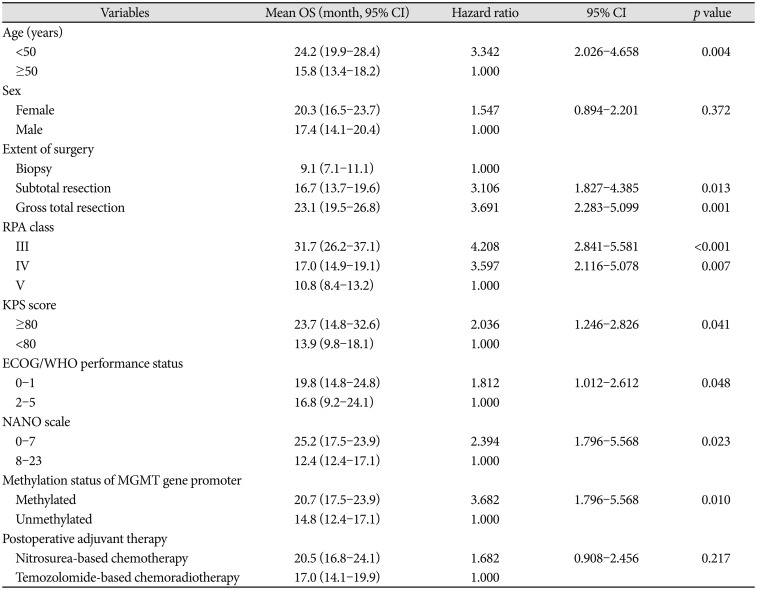
According to the clinical characteristics, the mean length of OS was 24.2 months (95% CI 19.9–28.4) in patients with age <50 years versus 15.8 months (95% CI 13.4–18.2) in patients with age ≥50 years; 9.1 months (95% CI 7.1–11.1) in patients who underwent biopsy versus 16.7 months (95% CI 13.7–19.6) in patients who underwent STR versus 23.1 months (95% CI 19.5–26.8) in patients who underwent GTR; 31.7 months (95% CI 26.2–37.1) in patients with RPA class III versus 17.0 months (95% CI 14.9–19.1) in patients with RPA class IV versus 10.8 months (95% CI 8.4–13.2) in patients with RPA class V; 20.7 months (95% CI 17.5–23.9) in patients with methylated MGMT gene promoter versus 14.8 months (95% CI 12.4–17.1) in patients with unmethylated MGMT gene promoter (Table 4).
In terms of the performance status, mean length of OS was 23.7 months (95% CI 14.8–32.6) in patients with KPS score ≥80 versus 13.9 months (95% CI 9.8–18.1) in patients with KPS score <80; 19.8 months (95% CI 14.8–24.8) in patients with ECOG/WHO performance status 0–1 versus 16.8 months (95% CI 9.2–24.1) in patients with ECOG/WHO performance status 2–5; 25.2 months (95% CI 17.5–23.9) in patients with NANO scale score 0–7 versus 12.4 months (95% CI 12.4–17.1) in patients with NANO scale score 8–23 (Table 4).
In the univariate analysis, the age of patients, extent of surgery, RPA class, and methylation status of the tumor were associated with OS. The performance status was also associated with OS, which was assessed by all the methods including the KPS score (p=0.041), ECOG/WHO performance status (p=0.047), and NANO scale (p=0.023) (Table 4). However, the sex (p=0.372) and adjuvant therapeutic modality after surgery (p=0.217) were not associated with OS.
Multivariate analysis of the factors associated with overall survival
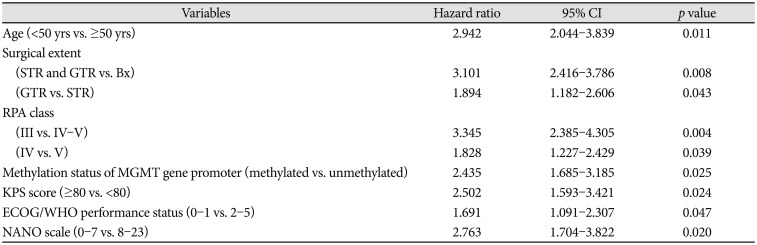
All variables found to be statistically significantly associated with OS of glioblastoma patients in the univariate analyses were examined in a multivariate analysis. All factors which were associated with OS in the univariate analysis were also associated with OS in the multivariate analysis independently; age <50 years (vs. age ≥50 years, p=0.011), GTR (vs. STR, p=0.043), resection (vs. biopsy, p=0.008), RPA class III (vs. class IV or V, p=0.004), RPA class IV (vs. class V, p=0.039), and methylated MGMT gene promoter (vs. unmethylated MGMT gene promoter, p=0.025) were statistically significantly associated with longer OS (Table 5). The Kaplan-Meier survival curve analysis and log-rank test also showed the same results (Supplementary Fig. 1 in the online-only Data Supplement).
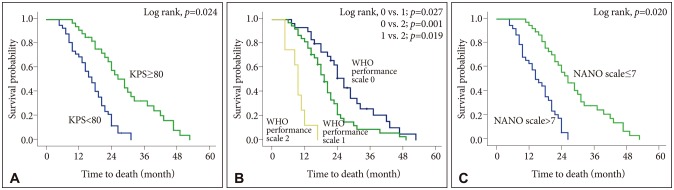
Regarding the performance status, the KPS score ≥80 (vs. score <80, p=0.024), ECOG/WHO performance status of 0–1 (vs. score of 2–5, p=0.047), and NANO scale score of 0–7 (vs. score of 8–23, p=0.020) were also associated with longer OS independently (Table 5). The Kaplan-Meier survival curve analysis and log-rank test indicated the same results (Fig. 1).
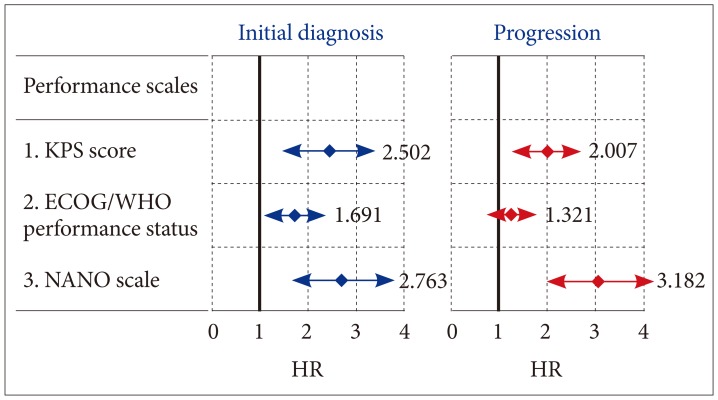
Interestingly, at the time of progression, several factors, which were associated with longer OS at the time of initial diagnosis, were not found to be associated with longer OS; age <50 years (vs. age ≥50 years, p=0.352), GTR (vs. STR, p=0.208), RPA class IV (vs. class V, p=0.413), and methylated MGMT gene promoter (vs. unmethylated MGMT gene promoter, p=0.117). Although the performance status was still associated with the OS even at the time of progression, the ECOG/WHO performance status (p=0.143) were not associated with the OS but a KPS score ≥80 (vs. <80, p=0.035) and NANO scale score of 0–7 (vs. score of 8–23, p=0.002) were associated with longer OS. In terms of the HR, it increased from 2.763 (95% CI 1.704–3.822) at the time of initial diagnosis to 3.182 (95% CI 1.993–4.371) at the time of progression only in the NANO scale score (Table 6). The HR of the NANO scale (3.182) was higher than that of the KPS score (2.007), which meant that the NANO scale had the stronger association with the OS than the KPS (Fig. 2).
DISCUSSION
In clinical practice, it is not unusual for neuro-oncologists to encounter glioblastoma patients with a high KPS score who do not survive longer than those with a low KPS score during conventional treatment under similar systemic conditions. Therefore, it is natural for neuro-oncologist to postulate whether KPS—a strong and well-established prognostic factor for survival—can reflect the true status of the performance of glioblastoma patients. The result of this retrospective study is the first to report that the NANO scale has a stronger power for predicting the prognosis of glioblastoma patients than that of the KPS, especially during tumor progression.
In fact, over the past decade, there has been a growing consensus that the lack of reliable and widely accepted tools to assess the response of treatment and clinical trial end points is a limiting factor in the identification of more effective therapies in neuro-oncology. To define the good or poor response and progression of brain tumor to the neuro-oncological treatment, the predominant method for assessment is contrast-enhancing conventional T1-weighted MRI according to the Macdonald criteria [19]. However, the degree of enhancement can be influenced by a variety of neuro-oncology-related factors, including corticosteroid use, imaging technique (1.5T vs. 3T, or dose and timing), surgical injury, inflammation, ischemia, edema, infection, seizures, and radiation injury. Increases in contrast enhancement, which is triggered by nontumoral events, can incorrectly be interpreted as progression (e.g., pseudo-progression). Decreases in contrast enhancement, for example, by a modification of the blood-brain barrier permeability, can be incorrectly interpreted as a response (e.g., pseudo-response). Even some tumor growth can be non-contrast-enhancing and not detected by conventional MRI [20].
Currently, there are the efforts to improve the response assessment in neuro-oncology clinical trials, including those led by the RANO working group [2122], as well as some of the remaining challenges. The RANO working group is an international collaboration of neuro-oncologists, medical oncologists, radiation oncologists, neurosurgeons, neuroradiologists, and regulatory groups commissioned to develop objective and tumor-specific response criteria for various tumor subtypes. In fact, the Macdonald criteria and RANO criteria usually define the radiologic parameters to classify therapeutic outcome among brain tumor patients rather than the functional parameters. While both radiological scales specify that clinical status must be incorporated in the overall assessment, neither scale provides specific parameters to do so. Furthermore, both scales had prioritized clinical status over radiology in that a response to it requires at least a stable clinical status, while clinical status is sufficient to declare disease progression. As a part of these efforts, the NANO scale is considered as the new method assessing the response of the treatment in terms of a neurological view rather than a radiological one [22]. Although the NANO scale contains a more detailed domain to assess the performance status of the brain tumor patients than KPS does, inter-observer or intra-observer discrepancy can occur because this method should be tested by an individual observer. For an objective scale of neurologic function to be useful as an outcome measure, the key requirements include that it should: 1) readily detect changes in neurologic function in response to treatment and disease progression and 2) exhibit adequate inter-observer agreement. Demonstration of acceptable interobserver variability also provides reassurance that the levels of functioning specified for each domain are clearly defined by the scale [13].
Although our study suggests a meaningful role of the NANO scale in predicting the prognosis of glioblastoma patients, we note several important limitations. First, the retrospective nature of the analysis in the present study is its main limitation. We attempted to partially mitigate this bias by extracting the patient data from complete medical and radiological records and by including patients who were treated with a similar treatment protocol such as surgical resection followed by adjuvant chemotherapy and/or radiotherapy. In fact, 13 patients among total 91 glioblastoma patients during the period were excluded in this analysis due to insufficient medical records with inability to assess the domain of performance status consisting NANO scale. Despite these efforts, however, the conclusions drawn from our study need further validation through prospective and randomized clinical trials. Second, the validation for correcting the inter-observer disagreement was not performed. The neurological assessment by the review of the medical record was performed by three investigators (Park SH, Lee J, and Kim YZ), which could reduce the risk of the inter-observer disagreement. If there was a discrepancy between the investigators, they discussed the cause and determined the optimal scores. Third, the present study showed the neurological outcome of the glioblastoma patients using the NANO scale only. However, this assessment of neurological function does not contain the domain of performance status. Other important domains for neurological assessment can be considered as follows [13]: symptom assessment by the MD Anderson Symptom Inventory Brain Tumor Module (MDASI-BT), quality of life assessment by the European Organisation for Research and Treatment of Cancer Quality of Life Questionnaire (EORTC QLQ-C30), EORTC QLQ-BN20 (specially for brain tumor patients), or the Functional Assessment of Cancer Therapy-Brain (FACT-Br), and neurocognitive assessment by the Mini-Mental State Examination (MMSE), Wechsler Adult Intelligence Scale-Revised (WAIS-R), Hopkins Verbal Learning Test-Revised (HVLT-R), Trail Making Tests (TMT), or Controlled Oral Word Association (COWA). Fourth, the relatively small number of patients and the data from single institute could be thought to be insufficient to have a strong statistical power.
In the present study, we investigated the prognostic role of the NANO scale as a new method to assess the performance status in glioblastoma patients retrospectively. We found that the performance status estimated by the NANO scale was significantly associated with OS. Moreover, we demonstrated that the NANO scale was a more powerful method to predict the prognosis of glioblastoma patients than the KPS in estimating the performance status during both initial diagnosis and disease progression. Our data were further validated by showing that the traditionally well-known prognostic factors such as age, surgical extent, and methylation status of MGMT gene promoter were also independently associated with the prognosis of glioblastoma patients. Therefore, these results can help in clinical trials enrolling glioblastoma patients to utilize the NANO scale to assess the performance status of these patients rather than the other assessment scales. However, the conclusions drawn from our study needs further validation through prospective and randomized clinical trials in multiple institutes.

 XML Download