Journal List > Brain Tumor Res Treat > v.5(1) > 1059712

Dho, Jung, Ha, Seo, Park, Won, and Yoo: An Updated Nationwide Epidemiology of Primary Brain Tumors in Republic of Korea, 2013

Abstract

Background

This report aims to provide accurate nationwide epidemiologic data on primary brain and central nervous system (CNS) tumors in the Republic of Korea. We updated the data by analyzing primary brain and CNS tumors diagnosed in 2013 using the data from the national cancer incidence database.

Methods

Data on primary brain and CNS tumors diagnosed in 2013 were collected from the Korean Central Cancer Registry. Crude and age-standardized rates were calculated in terms of gender, age, and histological type.

Results

A total of 11,827 patients were diagnosed with primary brain and CNS tumors in 2013. Brain and CNS tumors occurred in females more often than in males (female:male, 1.70:1). The most common tumor was meningioma (37.3%). Pituitary tumors (18.0%), gliomas (12.7%), and nerve sheath tumors (12.3%) followed in incidence. Glioblastomas accounted for 41.8% of all gliomas. In children (<19 years), sellar region tumors (pituitary and craniopharyngioma), embryonal/primitive/medulloblastoma, and germ cell tumors were the most common tumors.

Conclusion

This study should provide valuable information regarding the primary brain tumor epidemiology in Republic of Korea.

INTRODUCTION

Primary brain tumors include any tumors arising in the brain. Primary brain tumors can start from brain cells, meninges, nerves, or glands [1]. Although brain tumor is a rare disease, the incidence of brain tumors is gradually increasing worldwide due to the development of diagnostic technologies and the increased frequency of imaging tests [234]. The prognosis of malignant brain tumors is poor due to its histologic characteristics, however, some benign tumors are located in inoperable areas, and these tumors have similar bad prognosis and require the same economic burden as malignant brain tumors.
The Korea Central Cancer Registry (KCCR) started in 1980, and they collected malignant tumors only, excluding benign and borderline tumors. In order to collect benign and borderline brain tumors, the KCCR modified their registration guideline in corporation with the Brain Tumors Registration Committee of the Korean Brain Tumor Society in 2004, and started to register non-malignant brain tumors from year 2005 [5]. The scope of brain tumors included tumors of the meninges, pituitary gland, pineal gland and nerves, as defined in the International Classification of Diseases for Oncology, third edition (ICD-O-3). The first epidemiologic article of primary brain and central nervous system (CNS) tumors of the year of 2005 was published in 2010 [6], and the second paper of year 2010 was published in 2013 [7].
Many registries, such as the Central Brain Tumor Registry of the United States (CBTRUS) and surveillance epidemiology and end results program in USA, collect and disseminate the epidemiology of brain tumor [389101112]. Due to increase of screening with imaging testing, the incidence of brain tumor is increasing and the frequency of tumor diagnosis is changing with time, so the recent changes would be reflected in this paper. This report aims to provide the updated nationwide brain tumor incidence in the Republic of Korea.

MATERIALS AND METHODS

Brain tumor registration

A total of 11,827 brain and CNS patients were registered in 2013 from 396 hospitals. Basic information such as the demographic characteristics of patients, date of diagnosis, tools of diagnosis, topography, and histological type according to the ICD-O-3 were collected by the KCCR [1].

Data processing

Primary brain and CNS tumors with the following ICD-O-3 codes were included in the analysis: brain (C71.0–C71.9), meninges (C70.0–C70.9), spinal cord, cranial nerves and other parts of the CNS (C72.0–C72.9), and pituitary gland, craniopharyngeal duct and pineal gland (C75.1–C75.3). Their histology code was also classified by the ICD-O-3, which are divided into 3 groups: benign, uncertain whether benign or malignant (borderline), and malignant.
Histology groupings were based on the classification of the CBTRUS [3]. These groupings were broadly based on the World Health Organization categories for brain tumors. Unclassified tumors include unspecified neoplasms and all other tumors. Unspecified neoplasms refer to cases registered based on death certificates only. The tumors which classified into all other tumors were tumors that did not meet the CBTRUS criteria.
The population size used as a denominator to calculate cancer incidence was the mid-year population on 1 July 2013 with modification of the registered population released annually from the Statistics Korea [13]. Childhood tumors were defined as those diagnosed in patients less than 19 years of age.

Statistical analysis

Incidence measures the occurrence of newly diagnosed cases of disease. Crude rate is the rate of disease in an entire population and it is frequently adjusted for age to age-standardized rate to a common standard population, which allows for comparison of rates across different countries with different age structures. We used Segi's world standard population as a standard population in this report [14].

RESULTS

Overall incidence

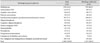
There were 11,827 newly diagnosed brain tumors from a population of 50.6 million in 2013 (Table 1). The overall crude rate of brain tumors was 23.39 per 100,000 person-years in 2013.
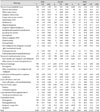
The incidence of meningiomas was over 3.5 times higher in females than in males. Nerve sheath tumors, pituitary tumors, andependymomas were also more common in females. On the other hand, germ cell tumors, gliomas (except pilocytic astrocytoma), and lymphomas were more common in males. Unclassified tumors accounted for 13.9% of all CNS tumors. The number of histological confirmed cases were 5,649 (47.8%) (Table 2). Pituitary tumors and nerve sheath tumors, accounted for 19.9% and 13.8% of all histologically confirmed tumors, respectively.

Incidence according to tumor biological behavior

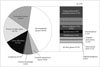
The overall incidence according to biological behavior is shown in Fig. 1. Tumors classified as benign, uncertain, and malignant tumors accounted for 73.2%, 8.8%, and 18.0% of all primary CNS tumors, respectively. The incidence in males was 37.1% and the incidence in females was 62.9%. Benign tumors developed nearly twice more frequently in females than in males (M:F=2,786:5,877). In contrast, the incidences of borderline tumors were noted to be similar.

Distribution of tumors according to originating site

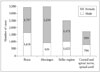
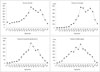
The incidence according to the originating site is shown in Fig. 2. Meninges (35.2%) were the most common site of primary brain tumors, followed by the brain parenchyma (29.0%), sellar region (21.1%), and cranial and spinal nerves (14.7%). Tumors of the meninges developed more than 3 times frequently in females (Fig. 2). The sellar region tumorsshowed 1.5 times incidence of males than females. The other sites showed no significant differences in incidence according to sex. The overall incidence of primary brain tumors increased with age until the sixth decade. The incidence of each site specific tumor according to age is shown in Fig. 3. Tumorsof the brain parenchyma reached a peak in the sixth decade. Tumors of the meninges seldom occurred in childhood, the incidence of which increased from the third decade and peaked in the sixth decade. Tumors of the nerves peaked in the sixth decade. Sellar tumors increased rapidly in late adolescents and peaked in the sixth decade, which decreased thereafter.

Incidence according to specific histology

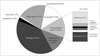
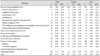
Distribution of the tumors according to histology is shownin Fig. 4 and 5. Histologically, tumors of meninges were the most common (37.9%), followed by tumors of the sellar region (19.3%) and neuroepithelial tumors (13.6%).Neuroepithelial tumors of neuroepithelial tissue were composed of astrocytic tumors, oligodendroglial tumors, ependymal tumors, choroid plexus tumors, pineal region tumors, and embryonal tumors. Most of the neuroectodermal tumors were gliomas (93.4%), which accounted for 12.7% of all primary brain tumors. Glioblastomas accounted for 5.3% of all tumors and 41.8% of allgliomas. Among histologically confirmed cases, glioblastomas accounted for 46.2% of all gliomas (Table 3).

Childhood primary brain tumors according to histology

Distribution of tumors according to histology in childhood is shown in Table 4 and Fig. 6.
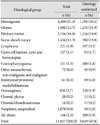
Children numbering 578 under 19 years of age were diagnosed with brain tumors in 2013, and crude rates of primary brain tumors in children was 5.27 per 100,000 person-years. The incidence was slightly higher in females (5.17) than in males (5.03). The most common histology in children included neuroepithelial tumors, germ cell tumors, and tumors of thesellar region. Neuroepithelial tumors accounted for 38.6% of all tumors in children. Embryonal/primitive/medulloblastoma was the most common tumor among neuroepithelial tumors in children. Glioblastomas accounted for only 3.3% of all primary brain tumors in children.

DISCUSSION

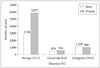
This is the third nationwide report on primary brain and CNS tumors, encompassing benign, borderline, and malignant tumors in the Republic of Korea. Compared to two previous reports of 2005 and 2010, crude rates for brain and CNS tumors increased from 11.7 per 100,000 in 2005 [6], to 20.1 in 2010 [7], and 23.4 in 2013. Age-standardized rates also increased from 10.2 in 2015, to 15.7 in 2010, and 17.1 in 2010. The incidences of all histological types increased in 2013 compared to 2010, however, most of this increase was due to benign tumors, including tumors of the cranial nerves, meninges, andsellar. The increased frequency of MRI scans could be a main reason for benign tumors increase. Age-standardized rate of malignant brain tumors was 2.9 per 100,000, and slightly lower than the worldwide incidence rate (3.4 per 100,000), according to Globocan 2012 [15]. Among children, the age-standardized rate of brain tumors also increased from 3.72 in 2005 to 5.00 in 2010, and 5.10 in 2013.
In conclusion, we updated the nationwide statistics of brain and CNS tumors in the Republic of Korea. Updated incidence of brain tumors will help to assess disease burden, facilitate etiologic studies, and establish cancer prevention and control strategies.

Figures and Tables

Fig. 1

Distribution of primary brain and CNS tumors according to sex and behavior, Republic of Korea, 2013. CNS, central nervous system.

btrt-5-16-g001
Fig. 2

Distribution of all brain and CNS tumors according to topography, Republic of Korea, 2013. CNS, central nervous system.

btrt-5-16-g002
Fig. 3

Distribution of primary brain and CNS tumors according to age for selected histology, Republic of Korea, 2013. CNS, central nervous system.

btrt-5-16-g003
Fig. 4

Distribution of brain and CNS tumors according to the histology, Republic of Korea, 2013. NOS, not otherwise specified; CNS, central nervous system.

btrt-5-16-g004
Fig. 5

Incidence according to sex and histology, Republic of Korea, 2013. NOS, not otherwise specified.

btrt-5-16-g005
Fig. 6

Distribution of primary brain and CNS tumors according to histology in children, Republic of Korea, 2013. CNS, central nervous system; NOS, not otherwise specified.

btrt-5-16-g006
Table 1

Incidence rates of primary brain and CNS tumors by histology and sex, Republic of Korea, 2013

btrt-5-16-i001
Histology Male Female Total
n CR ASR n CR ASR n % Age* CR ASR
Tumors of neuroepithelial tissue 848 3.35 2.98 761 3.01 2.69 1,609 13.6 52.0 3.18 2.82
 Pilocytic astrocytoma 25 0.10 0.15 25 0.10 0.19 50 0.4 12.5 0.10 0.17
 Diffuse astrocytoma 2 0.01 0.01 1 0.00 0.01 3 0.0 29.0 0.01 0.01
 Anaplastic astrocytoma 54 0.21 0.18 40 0.16 0.11 94 0.8 53.0 0.19 0.15
 Unique astrocytoma variants 18 0.07 0.07 16 0.06 0.08 34 0.3 30.5 0.07 0.07
 Astrocytoma, NOS 65 0.26 0.22 45 0.18 0.14 110 0.9 47.5 0.22 0.18
 Glioblastoma 344 1.36 0.99 285 1.13 0.78 629 5.3 61.0 1.24 0.87
 Oligodendroglioma 47 0.19 0.15 40 0.16 0.12 87 0.7 47.0 0.17 0.14
 Anaplastic oligodendroglioma 28 0.11 0.08 31 0.12 0.09 59 0.5 52.0 0.12 0.08
 Ependymoma/anaplastic ependymoma 34 0.13 0.14 47 0.19 0.15 81 0.7 46.0 0.16 0.15
 Ependymoma variants 11 0.04 0.04 15 0.06 0.05 26 0.2 47.0 0.05 0.04
 Mixed glioma 25 0.10 0.08 22 0.09 0.07 47 0.4 44.0 0.09 0.07
 Glioma malignant, NOS 84 0.33 0.32 76 0.30 0.25 160 1.4 50.0 0.32 0.28
 Choroid plexus 9 0.04 0.06 11 0.04 0.05 20 0.2 33.0 0.04 0.05
 Neuroepithelial 12 0.05 0.04 9 0.04 0.02 21 0.2 54.0 0.04 0.03
 Non-malignant and malignant neuronal/glial, neuronal and mixed 51 0.20 0.21 54 0.21 0.26 105 0.9 29.0 0.21 0.24
 Pineal parenchymal 13 0.05 0.05 9 0.04 0.03 22 0.2 37.5 0.04 0.04
 Embryonal/primitive/medulloblastoma 26 0.10 0.21 35 0.14 0.30 61 0.5 5.0 0.12 0.25
Tumors of cranial and spinal nerves 674 2.67 1.95 780 3.09 2.10 1,454 12.3 54.0 2.88 2.02
 Nerve sheath, non-malignant and malignant 674 2.67 1.95 780 3.09 2.10 1,454 12.3 54.0 2.88 2.02
 Other tumors of cranial and spinal nerves - - - - - - - - - - -
Tumors of meninges 996 3.94 2.77 3,485 13.79 8.36 4,481 37.9 61.0 8.86 5.68
 Meningioma 954 3.77 2.61 3,455 13.67 8.26 4,409 37.3 61.0 8.72 5.55
 Other mesenchymal, non-malignant and malignant 42 0.17 0.16 30 0.12 0.10 72 0.6 45.0 0.14 0.13
Lymphomas and hemopoietic neoplasms 124 0.49 0.34 97 0.38 0.25 221 1.9 63.0 0.44 0.29
 Lymphoma 124 0.49 0.34 97 0.38 0.25 221 1.9 63.0 0.44 0.29
Germ cell tumors, and cysts 92 0.36 0.48 35 0.14 0.18 127 1.1 18.0 0.25 0.34
 Germ cell tumors, cysts and heterotopias 92 0.36 0.48 35 0.14 0.18 127 1.1 18.0 0.25 0.34
Tumors of sellar region 911 3.60 2.68 1,366 5.40 4.31 2,277 19.3 50.0 4.50 3.45
 Pituitary 835 3.30 2.42 1,291 5.11 4.05 2,126 18.0 50.0 4.20 3.20
 Craniopharyngioma 76 0.30 0.26 75 0.30 0.26 151 1.3 45.0 0.30 0.26
Local extensions from regional tumors 6 0.02 0.02 10 0.04 0.03 16 0.1 44.5 0.03 0.02
 Chordoma/chondrosarcoma 6 0.02 0.02 10 0.04 0.03 16 0.1 44.5 0.03 0.02
Unclassified tumors 735 2.91 2.36 907 3.59 2.57 1,642 13.9 53.0 3.25 2.46
 Hemangioma 199 0.79 0.64 239 0.95 0.76 438 3.7 48.0 0.87 0.69
 Hemangioblastoma 67 0.27 0.20 45 0.18 0.13 112 0.9 48.5 0.22 0.17
 Neoplasm, unspecified 457 1.81 1.48 613 2.43 1.64 1,070 9.0 56.5 2.12 1.56
 All others 12 0.05 0.05 10 0.04 0.04 22 0.2 55.0 0.04 0.04
Total 4,386 17.34 13.58 7,441 29.44 20.49 11,827 100.0 56.0 23.39 17.09

*Median age at diagnosis. CR, crude rate; ASR, age-standardized rate; NOS, not otherwise specified; CNS, central nervous system

Table 2

The numbers of total and histologically confirmed cases by histological group, Republic of Korea, 2013

btrt-5-16-i002
Histological group Total Histology confirmed
n (%) n (%)
Meningioma 4,409 (37.3) 1,708 (30.2)
Glioma 1,506 (12.7) 1,235 (21.9)
Pituitary tumor 2,126 (18.0) 1,126 (19.9)
Nerve sheath tumor 1,454 (12.3) 780 (13.8)
Lymphoma 221 (1.9) 197 (3.5)
Germ cell tumors, cysts and heterotopias 127 (1.1) 94 (1.7)
Craniopharyngioma 151 (1.3) 100 (1.8)
Other mesenchymal, non-malignant and malignant 72 (0.6) 49 (0.9)
Embryonal/primitive/medulloblastoma 61 (0.5) 59 (1.0)
Hemangioma 438 (3.7) 110 (1.9)
Choroid plexus 20 (0.2) 13 (0.2)
Choroid/chondrosarcoma 16 (0.1) 11 (0.2)
Neoplasm, unspecified 1,070 (9.0) 58 (1.0)
All others 156 (1.3) 109 (1.9)
Total 11,827 (100.0) 5,649 (47.8)
Table 3

The numbers of total and histologically confirmed cases by histological type in gloimas, Republic of Korea, 2013

btrt-5-16-i003
Histological group in gliomas Total Histology confirmed
n (%) n (%)
Glioblastoma 629 (41.8) 570 (46.2)
Astrocytoma, NOS 110 (7.3) 89 (7.2)
Anaplatic astrocytoma 94 (6.2) 88 (7.1)
Pilocytic astrocytoma 50 (3.3) 48 (3.9)
Ependymoma/anaplastic ependymoma/ependymoma variants 107 (7.1) 100 (8.1)
Oligodendroglioma 87 (5.8) 83 (6.7)
Anaplastic oligodendroglioma 59 (3.9) 58 (4.7)
Glioma malignant, NOS 160 (10.6) 32 (2.6)
Neuroepithelial 21 (1.4) 12 (1.0)
Mixedglioma 47 (3.1) 45 (3.6)
Uniqueastrocytomavariants 34 (2.3) 23 (1.9)
Protoplasmic & fibrillary astrocytoma 3 (0.2) 3 (0.2)
Non-malignant and malignantneuronal/glial, neuronal and mixed 105 (7.0) 84 (6.8)
Total 1,506 (100.0) 1,235 (100.0)

NOS, not otherwise specified

Table 4

Incidence rates of primary CNS tumors by histology and sex in childhood (ages 0-19), Republic of Korea, 2013

btrt-5-16-i004
Histology Male Female Total
n CR ASR n CR ASR n CR ASR
Tumors of neuroepithelial tissue 113 1.98 2.09 110 2.09 2.27 223 2.03 2.18
 Pilocytic astrocytoma 15 0.26 0.28 21 0.40 0.43 36 0.33 0.35
 Anaplastic astrocytoma 5 0.09 0.10 2 0.04 0.04 7 0.06 0.07
 Astrocytoma, NOS 6 0.10 0.10 4 0.08 0.07 10 0.09 0.09
 Glioblastoma 9 0.16 0.12 10 0.19 0.17 19 0.17 0.15
 Ependymoma/anaplastic ependymoma 10 0.17 0.19 3 0.06 0.05 13 0.12 0.12
 Glioma malignant, NOS 14 0.24 0.28 9 0.17 0.20 23 0.21 0.24
 Non-malignant and malignant neuronal/glial, neuronal and mixed 14 0.24 0.23 16 0.30 0.33 30 0.27 0.28
 Embryonal/primitive/medulloblastoma 22 0.38 0.48 31 0.59 0.72 53 0.48 0.60
Tumors of cranial and spinal nerves 15 0.26 0.20 13 0.25 0.22 28 0.26 0.21
Tumors of meninges 14 0.24 0.22 14 0.27 0.24 28 0.26 0.23
Lymphomas and hemopoietic neoplasms 1 0.02 0.01 3 0.06 0.04 4 0.04 0.03
Germ cell tumors, and cysts 59 1.03 0.89 13 0.25 0.26 72 0.66 0.59
Tumors of sellar region 35 0.61 0.53 73 1.39 1.15 108 0.98 0.83
 Pituitary 27 0.47 0.38 62 1.18 0.95 89 0.81 0.65
 Craniopharyngioma 8 0.14 0.15 11 0.21 0.20 19 0.17 0.18
Local extensions from regional tumors - - - - - - - - -
Unclassified tumors 64 1.12 1.09 51 0.97 0.97 115 1.05 1.03
Total 301 5.27 5.03 277 5.27 5.17 578 5.27 5.10

CR, crude rate; ASR, age-standardized rate; NOS, not otherwise specified; CNS, central nervous system

Acknowledgments

This study was supported by the National Cancer Center Grant (NCC-1610200).

Notes

Conflicts of Interest The authors have no financial conflicts of interest.

References

1. Fritz A, Percy C, Jack A, et al. International classification of diseases for oncology. 3rd ed. Geneva: World Health Organizatiol;2000.
2. Bauchet L, Rigau V, Mathieu-Daudé H, et al. French brain tumor data bank: methodology and first results on 10,000 cases. J Neurooncol. 2007; 84:189–199.
crossref
3. Ostrom QT, Gittleman H, Liao P, et al. CBTRUS statistical report: primary brain and central nervous system tumors diagnosed in the United States in 2007-2011. Neuro Oncol. 2014; 16:Suppl 4. iv1–iv63.
crossref
4. Kaneko S, Nomura K, Yoshimura T, Yamaguchi N. Trend of brain tumor incidence by histological subtypes in Japan: estimation from the Brain Tumor Registry of Japan, 1973-1993. J Neurooncol. 2002; 60:61–69.
5. Shin HR, Won YJ, Jung KW, et al. Nationwide cancer incidence in Korea, 1999~2001; first result using the national cancer incidence database. Cancer Res Treat. 2005; 37:325–331.
crossref
6. Lee CH, Jung KW, Yoo H, Park S, Lee SH. Epidemiology of primary brain and central nervous system tumors in Korea. J Korean Neurosurg Soc. 2010; 48:145–152.
crossref
7. Jung KW, Ha J, Lee SH, Won YJ, Yoo H. An updated nationwide epidemiology of primary brain tumors in republic of Korea. Brain Tumor Res Treat. 2013; 1:16–23.
crossref
8. Committee of Brain Tumor Registry of Japan. Report of Brain Tumor Registry of Japan (1969-1996). Neurol Med Chir (Tokyo). 2003; 43 Suppl:i–vii. 1–111.
9. Hoffman S, Propp JM, McCarthy BJ. Temporal trends in incidence of primary brain tumors in the United States, 1985-1999. Neuro Oncol. 2006; 8:27–37.
crossref
10. Johannesen TB, Angell-Andersen E, Tretli S, Langmark F, Lote K. Trends in incidence of brain and central nervous system tumors in Norway, 1970-1999. Neuroepidemiology. 2004; 23:101–109.
crossref
11. Wöhrer A, Waldhör T, Heinzl H, et al. The Austrian Brain Tumour Registry: a cooperative way to establish a population-based brain tumour registry. J Neurooncol. 2009; 95:401–411.
crossref
12. Howlader N, Noone AM, Krapcho M, et al. SEER cancer statistics review, 1975-2013. National Cancer Institute;Accessed January 30, 2016. at http://seer.cancer.gov/csr/1975_2013/.
13. International Agency for Research on Cancer. Annual report of national cancer registration. Cancer incidence in 2005 and survival for 1993-2005. Accessed September 10, 2008. at http://www.iarc.fr/.
14. Segi M. Cancer mortality for selected sites in 24 countries (1950-1957). Sendai: Tohoku University School of Medicine;1960.
15. Ferlay J, Soerjomataram I, Ervik M, et al. GLOBOCAN 2012 v1.0, cancer incidence and mortality worldwide: IARC CancerBase No. 11. Accessed January 28, 2016. at http://www.globocan.iarc.fr.
TOOLS
Similar articles