

 PDF
PDF ePub
ePub Citation
 Print
Print


INTRODUCTION
Gene expression analysis provides insight into complex regulatory networks which will lead to the identification of genes involved in new biological processes or implicated in disease development. Quantitative real-time polymerase chain reaction (qPCR) is often used as a tool to determine the expression of target genes, which are normalized against a stable reference gene. qPCR has increasingly gained importance due to its high sensitivity, accuracy, reproducibility, and its potential for high throughput [1,2]. The validity of gene expression data determined by qPCR is dependent on the optimal selection of reference genes that are characterized by high stability and low expression variability [3,4,5]. Ideal reference genes should be stably expressed in all tissues or cells under investigation irrespective of tissue type, disease state, developmental stage or experimental treatment [6,7]. However, several reports have indicated that variation in the expression levels of endogenous reference genes may occur as a result of pathological change particularly in clinical samples associated with malignant diseases [6,8]. Thus, the selection of appropriate reference genes for clinical patient samples is vital to gene expression analysis. Several publications have shown that Beta-actin and GAPDH vary considerably and are thus unsuitable references for RNA transcription analysis [9,10,11,12]. Many studies make use of these reference genes without proper validation of their presumed stability of expression. Convenient housekeeping genes (HKGs) have to be verified prior to qPCR data analysis for each tissue type under investigation and each experimental setup used [13,14,15]. So far, normalization of qPCR data in glioblastomas (GBM) has mostly been performed with a single reference gene. The necessity to use a combination of at least two validated reference genes for accurate quantitative evaluation has not yet been considered [16]. It has been strongly suggested that more than one stably expressed HKG should be used to prevent misinterpretation of gene expression data [11,17,18].
Recently the traditional approach to cancer therapy has shifted towards personalized medicine [19]. Gene expression analysis is increasingly being used in combination with clinical variables to diagnose and model prognosis and response to therapy [20]. Despite intensive medical efforts, there is a lack of definite information regarding the etiology of malignant gliomas. Therefore, it is important to understand the complex biological interactions that regulate glioma development. GBM, the highest-grade malignant astrocytoma [21] are the most common and lethal type of tumors in the central nervous system. The mean survival time after diagnosis is one year [22]. This poor prognosis is due to their infiltrative nature and their resistance to cytotoxic treatments [23]. Many therapies based on characterized genetic alterations are in the clinical trials phase, but their efficacy is still below expectations [19]. Thus, there is a need for novel therapeutic targets for GBM treatment. In this regard, several studies are dedicated to explore expression profiles, using qPCR to identify novel genes differentially expressed in GBM. The present work is aimed to evaluate the suitability of selected HKGs for expression analysis in GBM.
The purpose of this study was to validate the expression of reference genes suitable for the normalization of qPCR gene expression data in GBM. To quantify differentially expressed genes in GBM, it is necessary to find a set of genes with constant expression across all samples. GAPDH, HPRT, and TBP are the most commonly used genes for normalization of qPCR data in glioma research. We investigated the expression profile and validated the stability of six HKGs (Table 1) involved in different cellular functions, and widely used as normalization genes in the literature for qPCR analysis in human GBM. For the first time we studied gene expression profiles of six HKGs from formalin fixed paraffin embedded (FFPE) GBM samples using qPCR. Our study demonstrated that FFPE samples retained important prognostic information and thus supports the use of FFPE sections for gene profiling in GBM. We determined that TBP and RPL13A are the most suitable reference genes for expression studies in GBM. These results will thus allow analysis of gene expression data in GBM research.
MATERIALS AND METHODS
Histopathology
Institutional ethical review board approval was obtained prior to initiation of this study (IERB/1/198/08). Based on clinical evidence and confirmation for GBM by a neurosurgeon at St. John's Hospital and Medical College, Bangalore, biopsy was collected from the patients. Tissues were processed and FFPE blocks were prepared. After histopathological confirmation by a pathologist, the tumor area was marked and re-blocked to ensure the absence of any normal brain tissue.
Tissue samples
A total of 10 GBM [World Health Organization (WHO) grade IV] FFPE samples from St. John's Hospital and Medical College, Bangalore, and 2 normal brain FFPE samples from Brain Bank, NIMHANS, Bangalore, were collected. Tumor samples were obtained from 4 female and 6 male patients with age ranging between 14 and 59 years (mean age 40 years). Normal brain samples (cerebral cortex, frontal lobe, grey and white matter) were obtained from 2 different individuals (50 years old male and 27 years old female) during autopsy.
Housekeeping genes
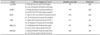
A total of 6 HKGs (GAPDH, HPRT, B2M, TBP, RN18S1, and RPL13A) that are most commonly used in gene expression analysis were chosen for our study from the literature (Table 1). All genes studied were found to have independent functions in cellular maintenance and their expression was not found to be directly related.
RNA isolation and cDNA synthesis
FFPE sections were deparaffinized by overnight incubation with TE buffer (Sigma Aldrich, MO, USA) and proteinase K (Invitrogen, CA, USA) at 65℃ on a thermomixer comfort (Eppendorf, Hamburg, Germany). Total RNA was isolated from samples using TRIzol reagent (Invitrogen) according to the manufacturer's instructions. The precipitated RNA was resuspended in nuclease free water. The concentration and purity of RNA were assessed on a NanoDrop 1,000 spectrophotometer (Thermo Scientific, Wilmington, DE, USA). The quality of RNA was satisfactory with 260/280 nm absorbance ratio between 1.7 and 2.0. The yield of RNA was approximately 2-14 µg in each sample. 1 µg of total RNA was reverse transcribed to cDNA with random primers using high capacity cDNA reverse transcription kit (Applied Biosystems, CA, USA) as per manufacturer's protocol in a 20 µL volume. cDNA was diluted 1:10 with nuclease free water to a final concentration of 5 ng/µL and stored at -20℃ until the next use.
Quantitative real-time PCR
qPCR was performed on StepOnePlus Instrument (Applied Biosystems, CA, USA) in 96 well microtiter plates. Amplification mixture consisted of SYBR Green master mix (Fermentas, MA, USA), 100 nM forward and reverse primers (Sigma Aldrich, MO, USA) and approximately 10 ng of cDNA template. Primer sequences (Table 2) were obtained from the literature and checked for their specificity through in silico PCR. Amplification was carried out with an initial denaturation step at 95℃ for 10 min followed by 40 cycles of 95℃ for 15 s, 60℃ for 30 s, and 72℃ for 30 s in 25 µL reaction volume. All reactions were run in duplicate and the mean was used for further calculations. Melt curve analysis was carried out after each run to confirm the lack of primer dimers.
Data analysis
qPCR data was analyzed by calculating the fold difference individually for each housekeeping gene. Cycle threshold (Ct) is defined as the number of PCR cycles at which the fluorescence signal rises above the threshold value and is inversely proportional to the amount of template present in the reaction. Ct values of genes in tumor (GBM) and control (normal brain) samples were compared and the fold difference calculated by the equation:
Statistical significance was determined by calculating probability values using GraphPad software (CA, USA). p values less than 0.05 were considered significant.
RESULTS
The expression levels of candidate housekeeping genes
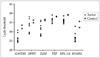
We investigated six HKGs commonly used as internal controls in expression studies, GAPDH, HPRT, B2M, TBP, RPL13A, and RN18S1 (Table 1). Transcriptional levels of the six selected genes were determined in a panel of 10 GBM samples from different individuals and 2 non-neoplastic samples using qPCR. The Ct values were plotted, assuming the same threshold for all genes evaluated. The six HKGs displayed a wide expression range, with Ct values between 24 and 39 (Fig. 1). These genes are thus distributed into different expression level categories, the genes with high abundance, RN18S1 and GAPDH; genes with moderate abundance, HPRT and B2M; and genes with low abundance, TBP and RPL13A. Ct values <40 were only used for calculation of the PCR efficiency. The efficiency of all assays were >96% (data not shown).
Stability of candidate housekeeping genes on normal and GBM tissues
Our main aim was to identify HKGs with minimal variability among non-neoplastic and GBM samples. By comparing raw Ct values of tumor versus non-neoplastic samples, significant differences in gene expression between GBM and normal brain samples were found for GAPDH, B2M, and RN18S1. The mRNA levels were significantly increased in tumor samples as compared to normal brain samples (Fig. 1). The encountered differences reveal that GAPDH, B2M, and RN18S1 are inadequate control genes for normalization studies in GBM. Genes whose expression levels did not significantly vary between normal and GBM tissues were HPRT, TBP, and RPL13A (p<0.05).
Genes TBP and RPL13A showed a lower RNA transcription range compared to other four genes. The range is defined as the difference between the highest Ct value and the lowest Ct value among all tissues, based on the same amount of cDNA template used in qPCR. The lowest RNA transcription range which is an indicator of constant RNA transcription across all tissues, was observed for the RPL13A gene (range=4.3) followed by TBP (range=4.6). The highest RNA transcription range was observed for HPRT (range=9.3) followed by B2M (range=8.6), RN18S1 (range=8.3), and GAPDH (range=6.6) gene.
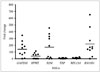
Ct values expressed as fold change for selected HKGs across all GBM samples along with average fold change is shown in Fig. 2. The most stable HKGs in GBM were TBP and RPL13A which showed an average fold change of <8 and <12 respectively, and a maximum fold change of <14 and <28 respectively. There was significantly greater fold change for GAPDH, HPRT, B2M, and RN18S1 with average fold change of >25 and a maximum fold change of >100 fold. The above data suggests that TBP and RPL13A would be the most suitable HKGs to be used in GBM studies within the context of current data set. Popular housekeepers, HPRT and GAPDH should be avoided.
DISCUSSION
qPCR is becoming the method of choice for accurate gene expression analysis because of its high sensitivity and precision along with wide dynamic range of quantification. It provides simultaneous measurement of mRNA expression in different samples for a number of genes. However, many different factors may affect the results, including the selection of appropriate HKGs. The 'ideal' HKG should be constantly expressed in all tissues and remain stable under different experimental conditions. Although the HKGs that regulate basic and ubiquitous cellular functions are usually assumed to be almost invariable between different samples, several studies have demonstrated that their expression may vary as a result of hypoxia, neoplastic growth, or experimental treatment [15,24]. These data show the mandatory requirement of prior exclusion of inappropriate genes to avoid errors in gene expression studies. However, it is impossible to find a 'universal' HKG having stable expression under all conditions. For example, GAPDH and Beta-actin are the most commonly used HKGs, but several studies have provided evidence that their transcription levels vary considerably between different cell types, developmental stages, pathological conditions and under different experimental setup [9]. For accurate quantification it is important to choose a reference target gene whose transcription level is same as that of gene of interest. Therefore, for accurate gene expression analysis, thorough validation of HKGs is crucial.
The present study is a systematic evaluation of candidate reference genes which can be used as normalisers in GBM expression studies. We analysed six commonly used HKGs in human GBM of WHO grade IV. In order to create maximum variability, we included subjects of different ages and sex. The expression levels of 6 HKGs in patients with GBM revealed only two genes suitable for normalization of mRNA levels. We found that TBP and RPL13A are the best choice as reference genes for mRNA expression analysis in GBM tissues. They remained constantly expressed and showed minimal changes in RNA transcription. Our results showed that the level of RNA transcription for some of the HKGs varied considerably across GBM samples and between tumor and normal brain samples. This was particularly the case with GAPDH, HPRT, B2M, and RN18S1 and thus would be completely inappropriate to use them as internal controls. Thus, until further improved analysis becomes available, we suggest TBP and RPL13A as adequate endogenous controls for normalization of target gene expression analysis in GBM. We suggest that for gene expression studies in GBM, the most frequently used internal controls GAPDH, HPRT, B2M, and RN18S1 are inadequate due to their significant variation in expression levels among tumor and normal brain samples. All of them not only showed variable expression among tumor tissues but also increased expression in tumor tissues compared to normal brain tissues.
For an accurate measurement of expression levels, normalisation by more than one HKG is suggested [11,17,25]. A recent study has identified TBP and HPRT1 as appropriate references for GBM expression analysis [9]. These results were partially contradictory to our findings. TBP indeed was evaluated as a possible reference gene for GBM in our experiment; however, HPRT was unsuitable as it displayed high variation in expression across tumor and normal brain tissues. Thus, our study shows that the accurate selection of appropriate reference genes is an absolute requirement for measurement of gene expression in human GBM. However, the small sample size was a limitation of our study. Hence, these findings cannot be generalized and considered as representative of the broader GBM population. Another limitation was the expression patterns of HKGs investigated in GBM samples alone. Expression of HKGs in other forms of cancers based on tissue type or cell origin should also be studied to understand the tissue specific gene expression patterns. These limitations will be addressed in future studies with a larger sample size including various cancers which would confirm the results.
In conclusion, gene transcription studies using qPCR should start with the selection of a suitable reference gene, for individual experimental setup. We agree with other authors that more than one reference gene should be used to obtain the most reliable results in gene expression studies. Our data showed that TBP and RPL13A are the most stable genes and are best suited for expression studies in GBM. Popular housekeepers, GAPDH and HPRT were inadequate for normalization studies since they showed high variability across samples in our experimental setup and thus were avoided. Together, these results highlight the importance of validation of HKGs for a particular experimental setup and in assessing any new setup.

 XML Download