Journal List > J Lipid Atheroscler > v.6(2) > 1059595

Park, Jung, Kim, Cho, Won, Shin, Lee, Lee, Kim, Kim, and Kim: Effect of Long-term Fenofibrate Therapy on Serum Creatinine and Its Reversibility in Hypertriglyceridemic Patients with Hypertension

Abstract

Objective

Previous studies have shown that fenofibrate therapy increases serum creatinine level and that there is a return of serum creatinine to baseline level after the discontinuation of the drug. We evaluated the effect of long-term fenofibrate therapy on creatinine levels and its reversibility in patients with hypertension and hypertriglyceridemia.

Methods

This retrospective study enrolled 54 hypertensive and hypertriglyceridemic patients taking fenofibrate for 3–6 years (Fenofibrate group) and 30 control patients with similar age, sex, follow-up duration, and creatinine levels (Control group). In 23 patients taking fenofibrate with low triglyceride level and/or with high creatinine levels, fenofibrate was discontinued, and creatinine levels were measured after 2 months.

Results

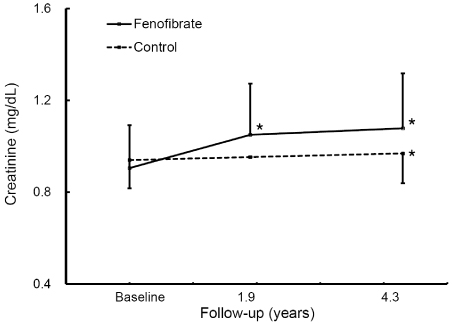
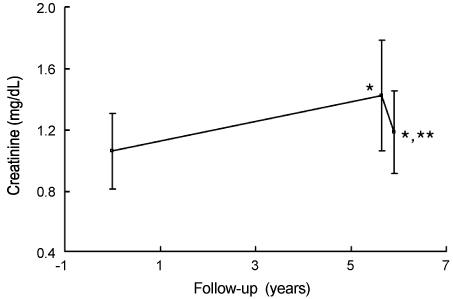
Creatinine levels increased in both the fenofibrate group (from 0.91±0.18 mg/dL to 1.09±0.23 mg/dL, p<0.001) and the control group (from 0.94±0.16 mg/dL to 0.98±0.16 mg/dL, p=0.04) compared to baseline. However, the elevation was more pronounced in the fenofibrate group than in the control group (21.1±15.4% vs. 4.5±11.3%, p<0.001). The discontinuation of fenofibrate lowered creatinine levels (from 1.39±0.32 mg/dL to 1.15±0.24 mg/dL, p<0.001) which were still higher than pre-treatment levels (p=0.013).

Conclusion

Long-term fenofibrate therapy significantly increased creatinine levels in hypertensive and hypertriglyceridemic patients. The effect of fenofibrate on creatinine level was partially reversible. This finding suggests that follow-up creatinine level is necessary with fenofibrate therapy.

REFERENCES

1. Shah A, Rader DJ, Millar JS. The effect of PPAR-alpha agonism on apolipoprotein metabolism in humans. Atherosclerosis. 2010; 210:35–40.
2. Kim CJ. Management of hypertriglyceridemia for prevention of cardiovascular diseases. J Lipid Atheroscler. 2013; 2:53–60.
crossref
3. Davidson MH, Armani A, McKenney JM, Jacobson TA. Safety considerations with fibrate therapy. Am J Cardiol. 2007; 99:3C–18C.
crossref
4. Lageder H. Comparative double-blind investigation of bezafibrate and clofibrate in patients with primary hyperlipoproteinaemia. Wien Klin Wochenschr. 1980; 92:95–101.
5. Dick TB, Marples J, Ledermann HM, Whittington J. Comparative study of once and 3-times daily regimens of bezafibrate in patients with primary hyperlipoproteinaemia. Curr Med Res Opin. 1981; 7:489–502.
crossref
6. Rössner S, Orö L. Fenofibrate therapy of hyperlipoproteinaemia. A dose-response study and a comparison with clofibrate. Atherosclerosis. 1981; 38:273–282.
crossref
7. Diabetes Atherosclerosis Intervention Study Investigators. Effect of fenofibrate on progression of coronaryartery disease in type 2 diabetes: the Diabetes Atherosclerosis Intervention Study, a randomised study. Lancet. 2001; 357:905–910.
8. Keech A, Simes RJ, Barter P, Best J, Scott R, Taskinen MR, et al. Effects of long-term fenofibrate therapy on cardiovascular events in 9795 people with type 2 diabetes mellitus (the FIELD study): randomised controlled trial. Lancet. 2005; 366:1849–1861.
9. ACCORD Study Group, Ginsberg HN, Elam MB, Lovato LC, Crouse JR 3rd, Leiter LA, et al. Effects of combination lipid therapy in type 2 diabetes mellitus. N Engl J Med. 2010; 362:1563–1574.
crossref
10. Messerli FH, Williams B, Ritz E. Essential hypertension. Lancet. 2007; 370:591–603.
crossref
11. Hopkins PN, Hunt SC, Wu LL, Williams GH, Williams RR. Hypertension, dyslipidemia, and insulin resistance: links in a chain or spokes on a wheel. Curr Opin Lipidol. 1996; 47:241–253.
crossref
12. Broeders N, Knoop C, Antoine M, Tielemans C, Abramowicz D. Fibrate-induced increase in blood urea and creatinine: is gemfibrozil the only innocuous agent? Nephrol Dial Transplant. 2000; 15:1993–1999.
crossref
13. Hottelart C, El Esper N, Rose F, Achard JM, Fournier A. Fenofibrate increases creatininemia by increasing metabolic production of creatinine. Nephron. 2002; 92:536–541.
crossref
14. Ritter JL, Nabulsi S. Fenofibrate-induced elevation in serum creatinine. Pharmacotherapy. 2001; 21:1145–1149.
crossref
15. Deighan CJ, Caslake MJ, McConnell M, Boulton-Jones JM, Packard CJ. Comparative effects of cerivastatin and fenofibrate on the atherogenic lipoprotein phenotype in proteinuric renal disease. J Am Soc Nephrol. 2001; 12:341–348.
crossref
16. Ansquer JC, Dalton RN, Caussé E, Crimet D, Le Malicot K, Foucher C. Effect of fenofibrate on kidney function: a 6-week randomized crossover trial in healthy people. Am J Kidney Dis. 2008; 51:904–913.
crossref
17. Brancati FL, Whelton PK, Randall BL, Neaton JD, Stamler J, Klag MJ. Multiple Risk Factor Intervention Trial. Risk of end-stage renal disease in diabetes mellitus: a prospective cohort study of men screened for MRFIT. JAMA. 1997; 278:2069–2074.
18. Ritz E, Orth SR. Nephropathy in patients with type 2 diabetes mellitus. N Engl J Med. 1999; 341:1127–1133.
crossref
19. Davis TM, Ting R, Best JD, Donoghoe MW, Drury PL, Sullivan DR, et al. Effects of fenofibrate on renal function in patients with type 2 diabetes mellitus: the Fenofibrate Intervention and Event Lowering in Diabetes (FIELD) Study. Diabetologia. 2011; 54:280–290.
crossref
20. Williams AJ, Baker F, Walls J. The short term effects of bezafibrate on the hypertriglyceridaemia of moderate to severe uraemia. Br J Clin Pharmacol. 1984; 18:361–367.
crossref
21. Angeles C, Lane BP, Miller F, Nord EP. Fenofibrateassociated reversible acute allograft dysfunction in 3 renal transplant recipients: biopsy evidence of tubular toxicity. Am J Kidney Dis. 2004; 44:543–550.
crossref
22. Dierkes J, Westphal S, Luley C. Serum homocysteine increases after therapy with fenofibrate or bezafibrate. Lancet. 1999; 354:219–220.
crossref

Fig. 1.
Changes in creatinine levels of patients in the fenofibrate group with available levels after medication for 1-3 years (solid) and in the control group (dotted). *; p<0.05 versus baseline levels
jla-2017-6-2-89f1.tif
Fig. 2.
Comparisons of creatinine levels at baseline, fenofibrate therapy for 5.4 years, and withdrawal of fenofibrate for 2 months. *; p<0.05 versus baseline levels, **; p<0.05 versus levels after fenofibrate therapy
jla-2017-6-2-89f2.tif
Table 1.
Comparisons of Baseline Demographic and Clinical Characteristics between the Control and Fenofibrate Groups
Control (n=30) Fenofibrate (n=54) p value
Men/women 16/14 34/20 0.49
Age (years) 59.0±9.5 56.1±10.0 0.21
Body mass index (kg/m2) 25.7±2.79 25.8±2.98 0.90
Hypertension 100% 100% 1.00
Ischemic heart disease 20% 15% 0.56
Diabetes mellitus 20% 19% 1.00
Alcohol 40% 50% 0.49
Smoking 17% 28% 0.30
Medications
 Aspirin 47% 30% 0.16
 Ca channel blocker 57% 65% 0.49
 Diuretics 53% 59% 0.65
 Beta blocker 33% 52% 0.12
 ACEI or ARB 50% 59% 0.49
 Statin 23% 15% 0.38
 Metformin 3% 11% 0.41
 Sulfonylurea 10% 13% 1.00
 Nitrate 13% 9% 0.72
Follow-up duration (years) 4.08±0.58 4.22±0.85 0.43
Creatinine (mg/dL) 0.94±0.16 0.91±0.18 0.38
BUN (mg/dL) 14.8±3.66 15.5±5.12 0.49
Cholesterol (mg/dL) 203±39.0 208±33.8 0.56
HDL-C (mg/dL) 43.3±7.59 40.4±7.78 0.10
nHDL-C (mg/dL) 160±35.5 168±32.1 0.28
LDL-C (mg/dL) 97.5±36.3 99.6±25.4 0.79
Triglyceride (mg/dL) 334±127 369±163 0.14
AST (IU/L) 31.3±12.9 25.6±7.92 0.033
ALT (IU/L) 33.0±17.8 30.2±13.4 0.41
Creatine kinase (IU/L) 91±33.6 100±47.3 0.37

ACEI; angiotensin converting enzyme inhibitor, ARB; angiotensin receptor blocker, BUN; blood urea nitrogen, HDL-C; high density lipoprotein cholesterol, nHDL-C; non-high density lipoprotein cholesterol, LDL-C; low density lipoprotein cholesterol, AST; aspartate aminotransferase, ALT; alanine aminotransferase

Table 2.
Comparisons of percent changes in renal functions and lipid profiles between the control and fenofibrate groups
Fenofibrate (n=54)
Control (n=30)
p value*
Percent change p value** Percent change p value**
Creatinine 21.1±15.4 0.000 4.5±11.3 0.04 0.000
BUN 19.0±37.1 0.025 25.4±28.0 0.000 0.30
Cholesterol -6.9±17.7 0.001 -6.2±18.3 0.021 0.93
HDL-C 18.6±21.5 0.000 8.4±22.4 0.12 0.024
nHDL-C -12.5±21.4 0.000 -9.1±23.1 0.006 0.52
LDL-C*** 25.3±34.6 0.000 22.7±53.0 0.39 0.40
Triglyceride -56.1±24.7 0.000 -16.8±58.3 0.003 0.000

BUN; blood urea nitrogen, HDL-C; high density lipoprotein cholesterol, nHDL-C; non-high density lipoprotein cholesterol, LDL-C; low density lipoprotein cholesterol

* ; control versus fenofibrate groups,

** ; baseline versus follow-up,

*** ; in patients with TG<400 mg/dL

Table 3.
Parameters associated with percent changes of creatinine levels
Total
Control group
Fenofibrate group
r p value r p value r p value
Sex 0.20 0.063 0.10 0.60 0.29 0.031
Age -0.08 0.45 -0.04 0.84 0.01 0.94
Body mass index 0.14 0.22 0.20 0.29 0.13 0.34
Alcohol 0.12 0.29 0.20 0.29 0.18 0.19
Smoking 0.22 0.045 0.14 0.46 0.28 0.040
Diabetes mellitus 0.25 0.023 0.15 0.44 0.36 0.007
IHD 0.02 0.82 0.35 0.060 0.12 0.40
Cholesterol -0.08 0.49 0.17 0.36 -0.26 0.061
HDL-C -0.10 0.36 0.25 0.18 -0.11 0.43
nHDL-C -0.05 0.67 0.13 0.49 -0.24 0.076
LDL-C -0.10 0.45 0.20 0.32 -0.34 0.037
Triglyceride 0.03 0.77 -0.04 0.84 -0.02 0.87
AST -0.10 0.36 -0.03 0.88 0.09 0.54
ALT 0.05 0.65 0.05 0.81 0.15 0.27
BUN 0.12 0.29 -0.27 0.15 0.19 0.18
Creatinine -0.06 0.62 -0.24 0.21 0.06 0.64
Follow-up duration 0.10 0.39 0.23 0.22 0.01 0.96
Fenofibrate therapy 0.50 0.000 - - - -

IHD; Ischemic heart disease, HDL-C; high density lipoprotein cholesterol, nHDL-C; non-high density lipoprotein cholesterol, AST; aspartate aminotransferase, ALT; alanine aminotransferase, BUN; blood urea nitrogen, FU; follow-up

Table 4.
Comparisons of parameter according to change of creatinine levels
<0.2 mg/dL (n=52) ≥0.2 mg/dL (n=32) p value
Men/women 30/22 20/12 0.82
Age (years) 57.0±10.4 57.4±9.1 0.85
Body mass index (kg/m2) 25.4±2.94 26.5±2.74 0.09
Ischemic heart disease 19% 13% 0.55
Diabetes mellitus 14% 28% 0.10
Alcohol 46% 47% 1.00
Smoking 17% 34% 0.11
Follow-up duration (years) 4.02±0.78 4.21±0.77 0.31
Creatinine (mg/dL) 0.94±0.16 0.88±0.19 0.10
BUN (mg/dL) 14.9±5.14 15.9±3.68 0.33
Cholesterol (mg/dL) 204±35.5 211±35.8 0.41
HDL-C (mg/dL) 41.4±6.95 41.5±9.12 0.95
nHDL-C (mg/dL) 163±34.4 169±32.6 0.40
LDL-C (mg/dL) 96.7±30.8 102±28.9 0.48
Triglyceride (mg/dL) 357±169 357±120 0.30
AST (IU/L) 28.3±11.2 26.6±8.7 0.48
ALT (IU/L) 30.9±16.2 31.7±13.2 0.82
Fenofibrate therapy 46% 94% 0.000

BUN; blood urea nitrogen, HDL-C; high density lipoprotein cholesterol, nHDL-C; non-high density lipoprotein cholesterol, AST; aspartate aminotransferase, ALT; alanine aminotransferase

TOOLS
Similar articles