

 PDF
PDF ePub
ePub Citation
 Print
Print


Abstract
Objective
The aim of this study was to analyze the long-term survival of subjects with peripheral artery disease (PAD).
Methods
The data included 415 Korean PAD patients aged ≥20 years hospitalized from 1994 through 2004 at a single tertiary center in Korea. Death data were obtained from all participants between 1994 and 2009.
Results
The mean of age was 64.4±9.3 years in PAD. The proportion of peripheral vascular bypass operation (re-vascularized) was about 50%. The proportion of males was 90.6% in PAD. Five- and 10-year survival rates were 79.2% and 60.5% in PAD, respectively. The 5- and 10- year survival rates were 83.0% and 64.1% in re-vascularized group, and 75.5% and 56.3% in non-revascularized group (p<0.05). For PAD, the adjusted hazard ratios (HRs) were 1.75 (95% confidence interval (CI) 1.17-2.68) in over 65 years, 1.53 (95% CI 1.05-2.27) in diabetes, and 2.21 (95% CI 1.51-3.23) in chronic kidney disease (CKD). Interestingly, HRs in PAD were 0.55 (95% CI 0.34-0.84) in overweight and 0.45 (95% CI 0.25-0.76) in obesity.
REFERENCES
1. Statistics Korea. The statistics of death cause in 2013[Internet]. Daejeon: Statistics Korea; 2014 [accessed on 1 March 2017]. Available from: http://kostat.go.kr/.
2. Jang SY, Ju EY, Cho SI, Lee SW, Kim DK. Comparison of cardiovascular risk factors for peripheral artery disease and coronary artery disease in the Korean population. Korean Circ J. 2013; 43:316–328.

3. Weisell RC. Body mass index as an indicator of obesity. Asia Pac J Clin Nutr. 2002; 11:S681–S684.
4. Levey AS, Coresh J, Balk E, Kausz AT, Levin A, Steffes MW, et al. National Kidney Foundation practice guidelines for chronic kidney disease: evaluation, classification, and stratification. Ann Intern Med. 2003; 139:137–147.
5. Dormandy J, Heeck L, Vig S. The natural history of claudication: risk to life and limb. Semin Vasc Surg. 1999; 12:123–137.
6. Criqui MH, Langer RD, Fronek A, Feigelson HS, Klauber MR, McCann TJ, et al. Mortality over a period of 10 years in patients with peripheral arterial disease. N Engl J Med. 1992; 326:381–386.
7. Adam DJ, Beard JD, Cleveland T, Bell J, Bradbury AW, Forbes JF, et al. Bypass versus angioplasty in severe ischaemia of the leg (BASIL): multicentre, randomised controlled trial. Lancet. 2005; 366:1925–1934.
8. Cang Y, Li J, Li YM, Zhou Y, Wu YZ, Li XK, et al. Relationship of a low ankle-brachial index with all-cause mortality and cardiovascular mortality in Chinese patients with metabolic syndrome after a 6-year follow-up: a Chinese prospective cohort study. Intern Med. 2012; 51:2847–2856.
9. Ademi Z, Liew D, Gorelik A, Bohensky M, Zomer E, Hollingsworth B, et al. Predictors of health care use among patients with or at high risk of atherothrombotic disease: two-year follow-up data. Int J Cardiol. 2014; 175:72–77.
10. Kumakura H, Kanai H, Aizaki M, Mitsui K, Araki Y, Kasama S, et al. The influence of the obesity paradox and chronic kidney disease on long-term survival in a Japanese cohort with peripheral arterial disease. J Vasc Surg. 2010; 52:110–117.
11. Wang Y, Guo X, Li J, Hu D, Zhao D, Ma H, et al. Predictive value of ankle-brachial index to all-cause mortality and cardiovascular mortality in Chinese patients with chronic kidney disease. Vasa. 2012; 41:205–213.
12. Luo Y, Li X, Li J, Wang X, Xu Y, Qiao Y, et al. Peripheral arterial disease, chronic kidney disease, and mortality: the Chinese Ankle Brachial Index Cohort Study. Vasc Med. 2010; 15:107–112.
13. Kim S, Popkin BM. Commentary: understanding the epidemiology of overweight and obesity--a real global public health concern. Int J Epidemiol. 2006; 35:60–67.
14. Flegal KM, Graubard BI, Williamson DF, Gail MH. Excess deaths associated with underweight, overweight, and obesity. JAMA. 2005; 293:1861–1867.
15. Galal W, van Gestel YR, Hoeks SE, Sin DD, Winkel TA, Bax JJ, et al. The obesity paradox in patients with peripheral arterial disease. Chest. 2008; 134:925–930.
16. Romero-Corral A, Montori VM, Somers VK, Korinek J, Thomas RJ, Allison TG, et al. Association of bodyweight with total mortality and with cardiovascular events in coronary artery disease: a systematic review of cohort studies. Lancet. 2006; 368:666–678.
17. Barba R, Bisbe J, Pedrajas JN, Toril J, Monte R, Muñoz-Torrero JF, et al. Body mass index and outcome in patients with coronary, cerebrovascular, or peripheral artery disease: findings from the FRENA registry. Eur J Cardiovasc Prev Rehabil. 2009; 16:457–463.
18. Lea JP, Crenshaw DO, Onufrak SJ, Newsome BB, McClellan WM. Obesity, end-stage renal disease, and survival in an elderly cohort with cardiovascular disease. Obesity (Silver Spring). 2009; 17:2216–2222.
19. Jee SH, Sull JW, Park J, Lee SY, Ohrr H, Guallar E, et al. Body-mass index and mortality in Korean men and women. N Engl J Med. 2006; 355:779–787.
20. Jang SY, Shin YI, Kim DY, Sohn MK, Lee J, Lee SG, et al. Effect of obesity on functional outcomes at 6 months post-stroke among elderly Koreans: a prospective multicentre study. BMJ Open. 2015; 5:e008712.
Fig. 1.
(A) Cumulative survival rates of the peripheral artery disease (PAD) group and (B) cumulative survival rates with revascularization or not in PAD using Kaplan-Meier curves.
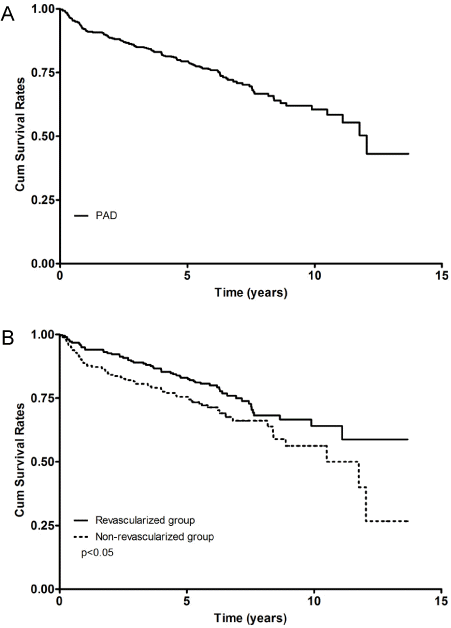
Fig. 2.
(A) Cumulative survival rates by over 65 years old and under with peripheral artery disease (PAD) using Kaplan-Meier curves (p<0.001), (B) cumulative survival rates by gender with PAD using Kaplan-Meier curves (p<0.001), (C) cumulative survival rates in hypertension (HT) patients with PAD using Kaplan-Meier curves (p<0.001), (D) cumulative survival rates in diabetes mellitus (DM) patients with PAD using Kaplan-Meier curves (p<0.001), (E) cumulative survival rates in dyslipidemia patients with PAD using Kaplan-Meier curves (p<0.001), (F) cumulative survival rates in smoker with PAD using Kaplan-Meier curves (p<0.001)
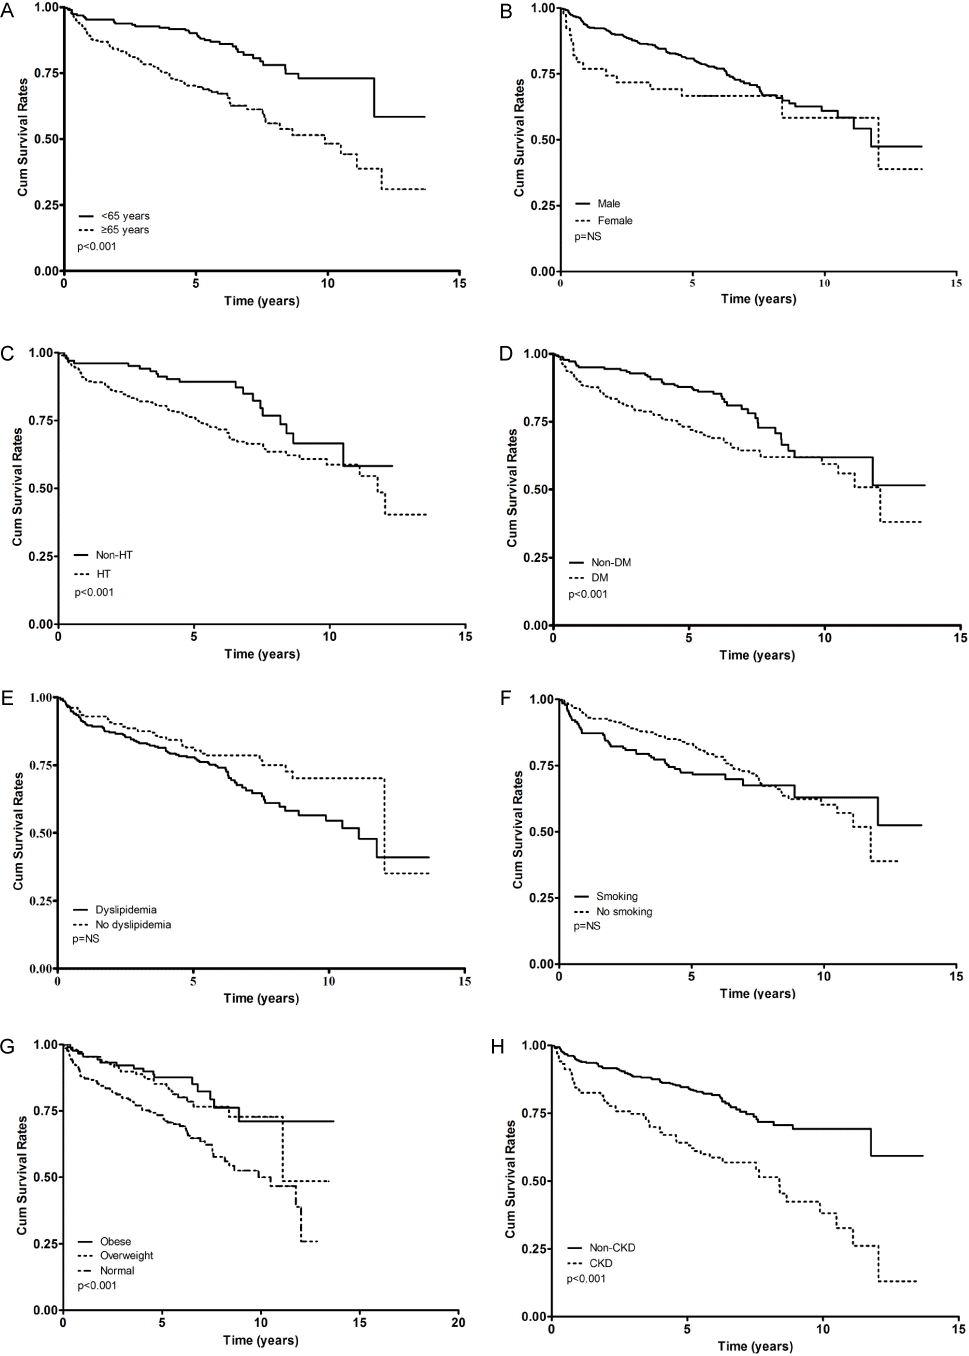
Table 1.
General and clinical characteristics in the peripheral artery disease (PAD) patients groups (n=415)
Table 2.
Associations between clinical variables and overall mortality in patients with peripheral artery disease (PAD)
| Variables | PAD* | p value |
|---|---|---|
| HR and 95% CI | ||
| Age, 65+ vs. <65 year | 1.75 (1.17-2.68) | 0.007 |
| Sex, male vs. female | 0.88 (0.51-1.63) | 0.674 |
| Hypertension | 1.46 (0.91-2.46) | 0.134 |
| Diabetes | 1.53 (1.05-2.27) | 0.029 |
| Dyslipidemia | 0.70 (0.48-1.01) | 0.061 |
| Smoking | 1.01 (0.68-1.53) | 0.963 |
| Body mass index | ||
| Normal | 1.0 | |
| Overweight | 0.55 (0.34-0.84) | 0.009 |
| Obese | 0.45 (0.25-0.76) | 0.004 |
| Chronic kidney disease | 2.21 (1.51-3.23) | <0.001 |
 XML Download