

 PDF
PDF ePub
ePub Citation
 Print
Print


Abstract
Objective
Effects of life style modifications on lipid profiles have been well established. However, data is scarce in Korean patients. We tried to quantify the effect of life style modifications on lipid profiles in relatively large number of Korean hyperlipidemic patients.
Methods
This study enrolled 1037 consecutive hyperlipidemic patients (total cholesterol or triglyceride levels ≥200 mg/dL) from 2003 to 2013. They were consisted of patients with hypercholesterolemia (n=308), borderline hypercholesterolemia (n=302), mixed hyperlipidemia (n=107), borderline mixed hyperlipidemia (n=156), and hypertriglyceridemia (n=164). Blood lipid levels were measured before and after life style modification for 2-4 months.
Results
Life style modification showed a small but significant reduction of body weight in all groups. It reduced low density lipoprotein (LDL) cholesterol by 9.1% (p=0.000), 5.9% (p=0.000), and 4.8% (p=0.003) in patients with hypercholesterolemia, borderline hypercholesterolemia, and mixed hyperlipidemia, respectively. LDL cholesterol was elevated in hypertriglyceridemic patients by 35% (p=0.000). Triglyceride levels decreased in patients with hypertriglyceridemia by 22% (p=0.000) and increased in hypercholesterolemic patients. There were no different effects of life style modification between men and women.
Figures and Tables
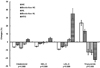 | Fig. 1Comparisons of Effects of Lifestyle Modification on Percent Changes of Lipid Profiles among Various Hyperlipidemia Groups. Mean±SE, HC; hypercholesterolemia, HL; mixed hyperlipidemia, HTG; hypertriglyceridemia, HDL-C; high density lipoprotein cholesterol, LDL-C; low-density lipoprotein cholesterol
|
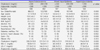
Table 1
Comparisons of baseline clinical and laboratory characteristics among hyperlipidemic groups
![]()
Table 2
Percent changes of lipid profiles among hyperlipidemic groups

![]()
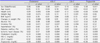
Table 3
Parameters associated with percent changes of lipid profiles
![]()
Table 4
Percent changes of lipid profiles between men and women

![]()
References
1. Tang JL, Armitage JM, Lancaster T, Silagy CA, Fowler GH, Neil HA. Systematic review of dietary intervention trials to lower blood total cholesterol in free-living subjects. BMJ. 1998; 316:1213–1220.

2. Eckel RH, Jakicic JM, Ard JD, de Jesus JM, Houston Miller N, Hubbard VS, et al. 2013 AHA/ACC guideline on lifestyle management to reduce cardiovascular risk: a report of the American College of Cardiology/American Heart Association Task Force on Practice Guidelines. Circulation. 2014; 129:S76–S99.
3. Hooper L, Summerbell CD, Higgins JP, Thompson RL, Capps NE, Smith GD, et al. Dietary fat intake and prevention of cardiovascular disease: systematic review. BMJ. 2001; 322:757–763.
4. Kim CJ. Management of hypertriglyceridemia for prevention of cardiovascular diseases. J Lipid Atheroscler. 2013; 2:53–60.
5. Stone NJ, Robinson JG, Lichtenstein AH, Bairey Merz CN, Blum CB, Eckel RH, et al. 2013 ACC/AHA guideline on the treatment of blood cholesterol to reduce atherosclerotic cardiovascular risk in adults: a report of the American College of Cardiology/American Heart Association Task Force on Practice Guidelines. Circulation. 2014; 129:S1–S45.
6. Task Force for the management of dyslipidaemias of the European Society of Cardiology (ESC) and the European Atherosclerosis Society (EAS). Catapano AL, Reiner Z, DeBacker G, Graham I, Taskinen MR, et al. ESC/EAS Guidelines for the management of dyslipidaemias: the Task Force for the management of dyslipidaemias of the European Society of Cardiology (ESC) and the European Atherosclerosis Society (EAS). Atherosclerosis. 2011; 217:Suppl 1. S1–S44.
7. Kim S, Sohn C, Chung WY. Effects of medical nutrition therapy on food habits and serum lipid levels of hypercholesterolemic patients. J Korean Diet Assoc. 2005; 11:125–132.
8. Park HS, Shin ES, Kim JJ, Lee JK. Efficacy of diet therapy in Korea hypercholesterolemic patients. Korean Circ J. 1994; 24:877–888.
9. Kim CJ. Effects of fenofibrate on C-reactive protein levels in hypertriglyceridemic patients. J Cardiovasc Pharmacol. 2006; 47:758–763.
10. Jung KS, Lee KE, Lee SH, Kim SJ, Lee KJ, Kim SW, et al. Effect of hydroxymethyl glutaryl coenzyme A reductase inhibitor on high sensitivity C-reactive protein levels in hypercholesterolemic patients without atherosclerotic diseases. Korean Circ J. 2004; 34:381–387.
11. Friedewald WT, Levy RI, Fredrickson DS. Estimation of the concentration of low-density lipoprotein cholesterol in plasma, without use of the preparative ultracentrifuge. Clin Chem. 1972; 18:499–502.
12. Lee KY, Park TJ, Kwon ER, Kim KJ. The effect of diet education provided by physicians and dieticians on serum lipid profiles during more than 1 year. J Korean Acad Fam Med. 2000; 21:1523–1533.
13. Sarkkinen ES, Uusitupa MI, Pietinen P, Aro A, Ahola I, Penttilä I, et al. Long-term effects of three fat-modified diets in hypercholesterolemic subjects. Atherosclerosis. 1994; 105:9–23.
14. Burr ML, Fehily AM, Gilbert JF, Rogers S, Holliday RM, Sweetnam PM, et al. Effects of changes in fat, fish, and fibre intakes on death and myocardial reinfarction: diet and reinfarction trial (DART). Lancet. 1989; 2:757–761.
15. The national diet-heart study final report. Circulation. 1968; 37:I1–I428.
16. Ehnholm C, Huttunen JK, Pietinen P, Leino U, Mutanen M, Kostiainen E, et al. Effect of diet on serum lipoproteins in a population with a high risk of coronary heart disease. N Engl J Med. 1982; 307:850–855.
17. Baron JA, Gleason R, Crowe B, Mann JI. Preliminary trial of the effect of general practice based nutritional advice. Br J Gen Pract. 1990; 40:137–141.
18. Watts GF, Lewis B, Brunt JN, Lewis ES, Coltart DJ, Smith LD, et al. Effects on coronary artery disease of lipidlowering diet, or diet plus cholestyramine, in the St Thomas' Atherosclerosis Regression Study (STARS). Lancet. 1992; 339:563–569.
19. Anderson JW, Garrity TF, Wood CL, Whitis SE, Smith BM, Oeltgen PR. Prospective, randomized, controlled comparison of the effects of low-fat and low-fat plus high-fiber diets on serum lipid concentrations. Am J Clin Nutr. 1992; 56:887–894.
20. Clarke R, Frost C, Collins R, Appleby P, Peto R. Dietary lipids and blood cholesterol: quantitative meta-analysis of metabolic ward studies. BMJ. 1997; 314:112–117.
21. Lee SG, Kim JJ, Park HS, Song JK, Park SW, Park SJ, et al. Efficacy of ciprofibrate monotherapy in patients with type II and type IV hyperlipidemia. Korean Circ J. 1995; 25:855–860.
22. Mozaffarian D, Appel LJ, Van Horn L. Components of a cardioprotective diet: new insights. Circulation. 2011; 123:2870–2891.
 XML Download