Journal List > J Lipid Atheroscler > v.5(2) > 1059571

Park, Kim, Lee, Han, Kim, Kim, Lee, Sung, Ahn, Park, and Baek: Prevalence, Treatment Pattern and Resource Use in Patients with Mixed Dyslipidemia Using Lipid Modifying Agents in Korea (PRIMULA): An Observational Study

Abstract

Objective

Limited information is available on the effectiveness of lipid-modifying therapy (LMT) for low-density lipoprotein cholesterol (LDL-C), high-density lipoprotein cholesterol (HDL-C), and triglyceride (TG) in the Korean population. The objective of this study was to describe the prevalence of different types of lipid disorders in Korean patients using LMT.

Methods

Eight hundred seventy-one dyslipidemia patients, who were LMT-naive for >1 year prior to retrospective enrollment, were included for analysis. Serum levels of LDL-C, HDL-C, TG and total cholesterol (TC) were assessed after >1 year of LMT. We also analyzed the therapeutic effects of LMT in the subjects with high cardiovascular risk factors (n=629), atherosclerotic cardiovascular disease (ASCVD) (n=296) or diabetes without ASCVD (n=316).

Results

The rates of elevated LDL-C without other abnormal lipids levels, elevated TG or decreased HDL-C (with normal LDL-C levels) and high LDL-C combined with elevated TG and/or decreased HDL-C were 33.4%, 13.0% and 53.6%, respectively. After at least one year on LMT (statin alone: 81%, statin and cholesterol absorption inhibitor: 10%, fibrates alone: 3%, others: 3%), 61% of patients had at least one lipid abnormality, with 3.4% failing to reach the therapeutic LDL-C target level or a normal level of HDL-C and TG. After LMT, 64.9% of patients with high cardiovascular risk factors, 64.5% of those with ASCVD or and 64.2% of those with diabetes without ASCVD also had at least one lipid abnormality.

Conclusion

Approximately two-thirds of patients did not reach the target or normal lipid profile after taking LMT, irrespective of combining disease and high cardiovascular risk factors. Tight lipid control is required, especially in patients with dyslipidemia and high cardiovascular risk factors or comorbid diseases.

REFERENCES

1. Randomised trial of cholesterol lowering in 4444 patients with coronary heart disease: the Scandinavian Simvastatin Survival Study (4S). Lancet. 1994; 344:1383–1389.
2. Shepherd J, Cobbe SM, Ford I, Isles CG, Lorimer AR, MacFarlane PW, et al. Prevention of coronary heart disease with pravastatin in men with hypercholesterolemia. West of Scotland Coronary Prevention Study Group. N Engl J Med. 1995; 333:1301–1307.
3. Heart Protection Study Collaborative Group. MRC/BHF Heart Protection Study of cholesterol lowering with simvastatin in 20,536 high-risk individuals: a randomised placebo-controlled trial. Lancet. 2002; 360:7–22.
4. Baigent C, Keech A, Kearney PM, Blackwell L, Buck G, Pollicino C, et al. Efficacy and safety of cholesterol-lowering treatment: prospective meta-analysis of data from 90,056 participants in 14 randomised trials of statins. Lancet. 2005; 366:1267–1278.
5. Gordon DJ, Probstfield JL, Garrison RJ, Neaton JD, Castelli WP, Knoke JD, et al. High-density lipoprotein cholesterol and cardiovascular disease. Four prospective American studies. Circulation. 1989; 79:8–15.
6. Grundy SM, Cleeman JI, Merz CN, Brewer HB Jr, Clark LT, Hunninghake DB, et al. Implications of recent clinical trials for the National Cholesterol Education Program Adult Treatment Panel III Guidelines. J Am Coll Cardiol. 2004; 44:720–732.
crossref
7. Robins SJ. Targeting low high-density lipoprotein cholesterol for therapy: lessons from the Veterans Affairs High-density Lipoprotein Intervention Trial. Am J Cardiol. 2001; 88:19N–23N.
crossref
8. Wilhelmsen L, Pyörälä K, Wedel H, Cook T, Pedersen T, Kjekshus J. Risk factors for a major coronary event after myocardial infarction in the Scandinavian Simvastatin Survival Study (4S). Impact of predicted risk on the benefit of cholesterol-lowering treatment. Eur Heart J. 2001; 22:1119–1127.
crossref
9. Cho HK, Shin G, Ryu SK, Jang Y, Day SP, Stewart G, et al. Regulation of small dense LDL concentration in Korean and Scottish men and women. Atherosclerosis. 2002; 164:187–193.
crossref
10. McBride PE. Triglycerides and risk for coronary heart disease. JAMA. 2007; 298:336–338.
crossref
11. Haim M, Benderly M, Brunner D, Behar S, Graff E, Reicher-Reiss H, et al. Elevated serum triglyceride levels and long-term mortality in patients with coronary heart disease: the Bezafibrate Infarction Prevention (BIP) Registry. Circulation. 1999; 100:475–482.
12. De Backer G, Ambrosioni E, Borch-Johnsen K, Brotons C, Cifkova R, Dallongeville J, et al. European guidelines on cardiovascular disease prevention in clinical practice: third joint task force of European and other societies on cardiovascular disease prevention in clinical practice (constituted by representatives of eight societies and by invited experts). Eur J Cardiovasc Prev Rehabil. 2003; 10:S1–S10.
crossref
13. Jacobson TA, Ito MK, Maki KC, Orringer CE, Bays HE, Jones PH, et al. National Lipid Association recommendations for patient-centered management of dyslipidemia: part 1 - executive summary. J Clin Lipidol. 2014; 8:473–488.
crossref
14. Kidney Disease Outcomes Quality Initiative (K/DOQI) Group. K/DOQI clinical practice guidelines for management of dyslipidemias in patients with kidney disease. Am J Kidney Dis. 2003; 41:I–IV. S1-S91.
15. Van Ganse E, Laforest L, Burke T, Phatak H, Souchet T. Mixed dyslipidemia among patients using lipid-lowering therapy in French general practice: an observational study. Clin Ther. 2007; 29:1671–1681.
crossref
16. Ghandehari H, Kamal-Bahl S, Wong ND. Prevalence and extent of dyslipidemia and recommended lipid levels in US adults with and without cardiovascular comorbidities: the National Health and Nutrition Examination Survey 2003-2004. Am Heart J. 2008; 156:112–119.
crossref
17. Robins SJ, Collins D, Wittes JT, Papademetriou V, Deedwania PC, Schaefer EJ, et al. Relation of gemfibrozil treatment and lipid levels with major coronary events: VA-HIT: a randomized controlled trial. JAMA. 2001; 285:1585–1591.
crossref
18. Chapman MJ, Assmann G, Fruchart JC, Shepherd J, Sirtori C. European Consensus Panel on HDL-C. Raising high-density lipoprotein cholesterol with reduction of cardiovascular risk: the role of nicotinic acid--a position paper developed by the European Consensus Panel on HDL-C. Curr Med Res Opin. 2004; 20:1253–1268.
19. Julius U, Leonhardt W, Schulze J, Schollberg K, Haller H. Insulin resistance in diabetics and non-diabetics with impaired triglyceride removal. Exp Clin Endocrinol. 1984; 83:225–230.
crossref
20. Hokanson JE, Austin MA. Plasma triglyceride level is a risk factor for cardiovascular disease independent of high-density lipoprotein cholesterol level: a meta-analysis of population-based prospective studies. J Cardiovasc Risk. 1996; 3:213–219.
crossref
21. Bansal S, Buring JE, Rifai N, Mora S, Sacks FM, Ridker PM. Fasting compared with nonfasting triglycerides and risk of cardiovascular events in women. JAMA. 2007; 298:309–316.
crossref
22. Jeppesen J, Hein HO, Suadicani P, Gyntelberg F. Relation of high TG-low HDL cholesterol and LDL cholesterol to the incidence of ischemic heart disease. An 8-year follow-up in the Copenhagen Male Study. Arterioscler Thromb Vasc Biol. 1997; 17:1114–1120.
23. Varbo A, Benn M, Tybjærg-Hansen A, Jørgensen AB, Frikke-Schmidt R, Nordestgaard BG. Remnant cholesterol as a causal risk factor for ischemic heart disease. J Am Coll Cardiol. 2013; 61:427–436.
crossref
24. Varbo A, Benn M, Tybjærg-Hansen A, Nordestgaard BG. Elevated remnant cholesterol causes both low-grade inflammation and ischemic heart disease, whereas elevated low-density lipoprotein cholesterol causes ischemic heart disease without inflammation. Circulation. 2013; 128:1298–1309.
crossref
25. Varbo A, Benn M, Smith GD, Timpson NJ, Tybjaerg-Hansen A, Nordestgaard BG. Remnant cholesterol, low-density lipoprotein cholesterol, and blood pressure as mediators from obesity to ischemic heart disease. Circ Res. 2015; 116:665–673.
crossref
26. Stone NJ, Robinson JG, Lichtenstein AH, Bairey Merz CN, Blum CB, Eckel RH, et al. 2013 ACC/AHA guideline on the treatment of blood cholesterol to reduce atherosclerotic cardiovascular risk in adults: a report of the American College of Cardiology/American Heart Association Task Force on Practice Guidelines. J Am Coll Cardiol. 2014; 63:2889–2934.
27. ATP acquisition broadens IHS' footprint in Europe, Asia and Middle East. Electron Inf Rep. 2005; 26:1–2.
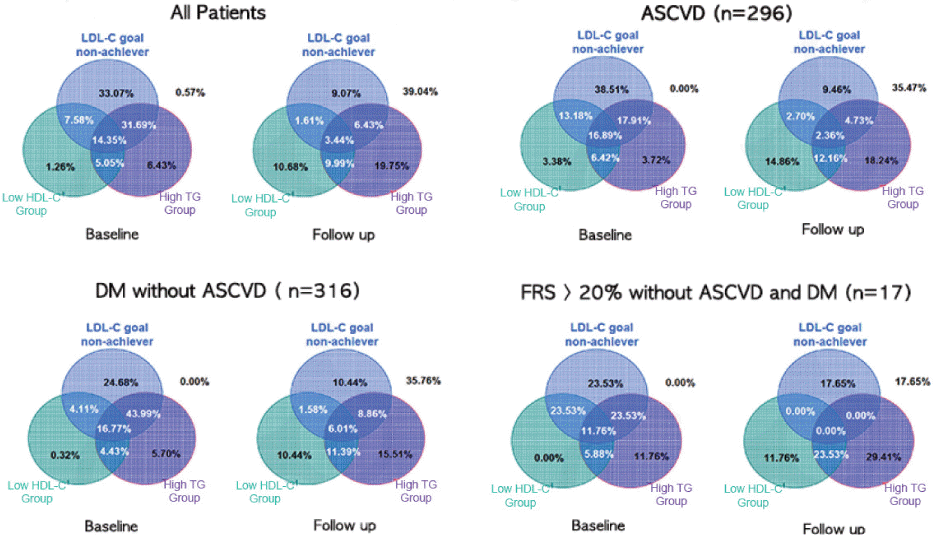
Fig. 1.
Distribution of dyslipidemia according to the underlying diseases and risk factors. Abbreviations: Atherosclerotic cardiovascular disease (ASCVD), Diabetes mellitus (DM), FRS (Framingham risk score), Low-density lipoprotein cholesterol (LDL-C), Triglyceride (TG), High-density lipoprotein cholesterol (HDL-C).
jla-2016-5-2-121f1.tif
Table 1.
Characteristics of patients before initiating pharmacotherapy for dyslipidemia
Variable Total sample No high-risk conditions High-risk conditions


ASCVD
DM without ASCVD
FRS>20% without ASCVD & DM
n (%) 871 (100.0) 242 (27.8) 296 (34.0) 316 (36.2) 17 (2.0)
Age (year) 58.7±10.1 58.1±10.0 60.8±10.0 57.0±9.8 62.4±12.2
Men (n (%)) 449 (51.6) 102 (42.2) 189 (63.9)** 144 (45.6) 14 (82.4)
Current smokers 147 (16.9) 26 (10.7) 79 (26.7)** 36 (11.4) 6 (35.3)**
Body mass index (kg/m2) 25.2±3.0 25.1±2.9 25.3±3.0 25.1±3.2 25.8±2.7
Systolic blood pressure (mmHg) 123.0±17.4 130.2±17.1 126.8±17.6 132.9±17.3 135.8±8.1
Diastolic blood pressure (mmHg) 79.3±11.2 80.6±10.9 77.3±11.5 80.3±10.9 82.4±8.4
Hypertension (n (%)) 697 (80.0) 174 (71.9) 271 (91.6)** 236 (74.7) 16 (94.1)
Total cholesterol (mg/dL) 223.0±38.7 239.9±36.1 205.8±38.8** 225.6±34.1** 233.9±34.0
LDL-C (mg/dL) 146.7±36.5 161.9±33.5 138.1±35.1** 142.4±36.6** 157.1±35.9
TG (mg/dL) 193.9±119.4 189.9±120.8 166.5±99.1 221.0±124.9 225.2±192.8
HDL-C (mg/dL) 48.3±12.5 52.8±12.6 44.7±12.3** 48.5±11.6** 41.8±6.8**
Non-HDL-C (mg/dL) 174.7±35.3 187.1±4.3 161.0±34.9** 177.1±32.1* 192.2±32.5
Fasting plasma glucose (mg/dL) 127.6±49.2 100.5±13.8 122.6±47.8** 151.9±55.1** 98.3±16.4

Data are expressed as number (percentage) or as mean±SD.

** Significantly different from those with no high-risk conditions (p<0.0001)

* Significantly different from those with no high-risk conditions (p<0.001)

ASCVD; Atherosclerotic cardiovascular disease, DM; Diabetes mellitus, FRS; Framingham risk score, LDL-C; Low-density lipoprotein cholesterol, TG; Triglyceride, HDL-C; High-density lipoprotein cholesterol

Table 2.
Distribution of lipid abnormalities
Variable Total sample No high-risk conditions High-risk conditions


ASCVD
DM without ASCVD
FRS>20% without ASCVD & DM
(n=871) (n=242) (n=296) (n=316) (n=17)
Baseline
High LDL-C only, n (%) 291 (33.4) 95 (39.2) 114 (38.5) 78 (24.7) 4 (23.5)
Elevated TG or decreased HDL-C (with normal LDL-C levels), n (%) 113 (13.0) 37 (15.3) 40 (13.5) 33 (10.4) 3 (17.6)
High LDL-C combined with elevated TG and/or decreased HDL-C, n (%) 467 (53.6) 110 (45.5) 142 (48.0) 205 (64.9) 10 (58.8)
Follow-up
No abnormalities, n (%) 340 (39.0) 119 (49.2) 105 (35.5) 113 (35.8) 3 (17.7)
High LDL-C only, n (%) 79 (9.1) 15 (6.2) 28 (9.4) 33 (10.4) 3 (17.7)
Elevated TG or decreased HDL-C (with normal LDL-C levels), n (%) 352 (40.4) 89 (36.8) 134 (45.3) 118 (37.3) 11 (64.6)
High LDL-C combined with elevated TG and/or decreased HDL-C, n (%) 100 (11.5) 19 (7.8) 29 (9.8) 52 (16.5) 0 (0.0)

ASCVD; Atheroscleotic cardiovascular disease, DM; Diabetes mellitus, FSR; Framingham risk score, LDL-C; Low-density lipoprotein cholesterol, TG; Triglyceride, HDL-C; High-density lipoprotein cholesterol

Table 3.
The patterns of pharmacotherapy for dyslipidemia
Total sample, n (%) No high-risk conditions, n (%) High-risk conditions


ASCVD, n (%)
DM without ASCVD, n (%)
FRS>20% without ASCVD and DM, n (%)
(n=871) (n=242) (n=296) (n=316) (n=17)
Statin alone, n (%) 708 (81.3) 198 (81.8) 234 (79.1) 262 (82.9) 14 (82.3)
Fibrate alone, n (%) 26 (3.0) 6 (2.5) 2 (0.7) 18 (5.7) 0 (0.0)
Niacin alone, n (%) 2 (0.2) 0 (0.0) 1 (0.3) 1 (0.3) 0 (0.0)
Omega-3 fatty acid alone, n (%) 1 (0.1) 0 (0.0) 0 (0.0) 1 (0.3) 0 (0.0)
Cholesterol absorption inhibitor alone, n (%) 3 (0.3) 1 (0.4) 1 (0.3) 1 (0.3) 0 (0.0)
Statin+fibrate, n (%) 16 (1.8) 8 (3.3) 4 (1.3) 4 (1.3) 0 (0.0)
Statin+niacin, n (%) 3 (0.3) 0 (0.0) 1 (0.3) 2 (0.6) 0 (0.0)
Statin+Omega-3 fatty acid, n (%) 11 (1.3) 3 (1.2) 7 (2.4) 1 (0.3) 0 (0.0)
Statin+cholesterol absorption inhibitor, n (%) 91 (10.4) 25 (10.4) 44 (14.9) 21 (6.7) 1 (5.9)
Statin+others, n (%) 4 (0.5) 1 (0.4) 2 (0.7) 0 (0.0) 1 (5.9)
Fibrate+omega-3 fatty acid, n (%) 2 (0.2) 0 (0.0) 0 (0.0) 1 (0.3) 1 (5.9)
Fibrate+cholesterol absorption inhibitor n (%) 0 (0.0) 0 (0.0) 4 (1.3) 0 (0.0)

ASCVD; Atherosclerotic cardiovascular disease, DM; Diabetes mellitus, FRS; Framingham risk score

Table 4.
Number of patients not at lipid goals or normal levels and mean distance to goals or normal levels
Variable Total sample, n (%)
No high-risk conditions
High-risk conditions
ASCVD
DM without ASCVD
FRS>20% without ASCVD & DM
(n=871) (n=242) (n=296) (n=316) (n=17)
LDL-C
No. not at goal, n (%) 179 (20.6) 34 (14.11) 57 (19.3) 85 (26.9) 3 (17.7)
Distance to goal, mg/dL 24.2±25.1 28.2±24.2 20.7±27.5 25.0±23.9 20.2±24.9
Mean percentage of the patients who did not reach the treatment goal 23.4% 24.0% 20.7% 25.0% 20.2%
TG
No. not at goal, n (%) 345 (39.6) 93 (38.4) 111 (37.5) 132 (41.8) 9 (52.9)
Distance to goal, mg/dL 71.3±86.0 64.3±66.3 77.6±105.9 70.6±79.6 76.3±89.1
Mean percentage of the patients who did not reach the treatment goal 47.5% 42.8% 51.8% 47.1% 50.9%
HDL-C
No. not at goal, n (%) 224 (25.7) 30 (12.4) 95 (32.1) 93 (29.4) 6 (35.3)
Distance to goal, mg/dL 4.4±3.9 3.9±4.1 4.0±3.6 5.0±4.0 3.3±4.5
Mean percentage of the patients who did not reach the treatmentgoal 10.9% 9.7% 10.1% 12.4% 8.3%
Non-high-density lipoprotein
No. not at goal, n (%) 157 (18.0%) 32 (13.2%) 48 (16.2%) 75 (23.7%) 2 (11.8%)
Distance to goal, mg/dL 23.7±19.2 23.1±16.9 30.2±21.7 19.3±16.7 44.5±36.1
Mean percentage of the patients who did not reach treatment goal 17.8% 15.8% 23.3% 14.8% 29.2%

ASCVD; Atherosclerotic cardiovascular disease, DM; Diabetes mellitus, FRS; Framingham risk score, LDL-C; Low-density lipoprotein cholesterol, TG; Triglyceride, HDL-C; High-density lipoprotein cholesterol

Table 5.
Logistic regression of attainment of lipid goals or normal levels according to individual lipid profiles
Variable LDL-C (n=572)
TG (n=346)
HDL-C (n=172)
Non-HDL-C (n=551)
OR (95% CI) p value OR (95% CI) p value OR (95% CI) p value OR (95% CI) p value
Age (per year) 0.995 (0.972-1.020) 0.716 1.010 (0.983-1.037) 0.477 0.974 (0.938-1.012) 0.178 1.007 (0.981-1.034) 0.600
Male gender 1.291 (0.793-2.103) 0.305 0.794 (0.466-1.355) 0.398 0.306 (0.122-0.766) 0.012 1.439 (0.850-2.437) 0.176
Body mass index (kg/m2) 0.933 (0.873-0.998) 0.043 0.961 (0.890-1.037) 0.309 1.004 (0.888-1.135) 0.951 0.908 (0.845-0.974) 0.007
Current smoker 0.651 (0.361-1.174) 0.154 0.491 (0.256-0.940) 0.032 0.774 (0.352-1.705) 0.525 0.665 (0.356-1.243) 0.201
Hypertension 1.736 (1.041-2.893) 0.034 0.614 (0.337-1.120) 0.112 1.086 (0.386-3.051) 0.876 2.156 (1.271-3.657) 0.004
ASCVD 0.718 (0.449-1.149) 0.167 1.186 (0.702-2.001) 0.524 1.702 (0.762-3.802) 0.194 0.586 (0.353-0.973) 0.039
DM 0.811 (0.524-1.255) 0.346 0.825 (0.520-1.309) 0.414 0.880 (0.435-1.781) 0.723 0.716 (0.453-1.134) 0.154
10-year ASCVD risk >20% 1.052 (0.489-2.263) 0.897 0.599 (0.262-1.369) 0.224 1.738 (0.678-4.458) 0.250 1.140 (0.506-2.566) 0.752

LDL-C; Low-density lipoprotein cholesterol, TG; Triglyceride, HDL-C; High-density lipoprotein cholesterol, ASCVD; Atherosclerotic cardiovascular disease, DM; Diabetes mellitus

Table 6.
Logistic regression of attainment of lipid goals in subjects with at least two abnormalities in LDL-C, triglycerides, non-HDL-C or HDL-C
Variable OR (95% CI) p value
Age (year) 1.000 (0.980-1.020) 0.978
Male gender 0.753 (0.498-1.138) 0.178
Body mass index (kg/m2) 0.924 (0.870-0.981) 0.009
Current smoker 0.916 (0.563-1.491) 0.724
Hypertension 1.576 (1.007-2.467) 0.046
ASCVD 0.703 (0.467-1.058) 0.091
DM 0.949 (0.657-1.371) 0.779
10-year ASCVD risk >20% 1.097 (0.592-2.033) 0.769
Fibrate use 0.468 (0.036-6.036) 0.561
Statin dose, per 20 mg 0.961 (0.791-1.167) 0.689
Baseline LDL-C, per 10 mg/dL 1.036 (0.915-1.173) 0.580
Baseline triglycerides, per 50 mg/dL 1.004 (0.893-1.130) 0.942
Baseline HDL, per 5 mg/dL 1.054 (0.972-1.142) 0.204
Baseline non-HDL-C, per 10 mg/dL 0.933 (0.824-1.057) 0.276

ASCVD; Atherosclerotic cardiovascular disease, DM; Diabetes mellitus, LDL-C; Low-lipoprotein cholesterol, HDL-C; Highlipoprotein density cholesterol

TOOLS
Similar articles