

 PDF
PDF ePub
ePub Citation
 Print
Print


INTRODUCTION
Arterial stiffness increases with age1 and is enhanced in subjects with hypertension (HTN), diabetes mellitus,2 atherosclerosis,3 and end-stage renal disease.4 The consequences of arterial stiffening are increased pulsatile blood pressure, which is caused by a higher systolic blood pressure (SBP) and a lower diastolic blood pressure (DBP) and leads to increased left ventricular (LV) afterload, and coronary artery disease and left ventricular hypertrophy, the most common cause of LV diastolic dysfunction.4,5 It has been reported that hypertensive patients have increased aortic stiffness,6,7 and that aortic stiffness is linked with LV structure and function and impaired diastolic function.5,8 However, the relationship between arterial stiffness and left ventricular end-diastolic pressure (LVEDP) remains to be determined.
Arterial stiffness can be assessed non-invasively with the use of echocardiographic aortic distensibility (AD) and pulse wave velocity (PWV). The AD, which is calculated from pulsatile changes in the ascending aorta, is an elasticity index of the aorta and reflects arterial stiffness.9 The brachial-ankle PWV (baPWV) is another technique for evaluating arterial stiffness, in which the velocity of the pulse wave to travel a given distance between two sites of the arterial system is measured. The baPWV is the conventionally adopted index of arterial stiffness and vascular damage, and is a widely used method.10 Measurement of the baPWV is inexpensive, convenient, and is believed to have a good potential as a screening device for subclinical cardiovascular risk and severe atherosclerotic vascular damage.11
The purpose of the present study was to assess arterial stiffness in patients with HTN compared with normotensive controls according to the degree of LVEDP measured by the E/E' ratio, and elucidate the correlation between the LVEDP and arterial stiffness as measured by the AD and baPWV.
PATIENTS AND METHODS
1. Study population
Between January 2008 and June 2010, 234 patients without clinical signs or symptoms of atherosclerotic cardiovascular disease underwent a cardiovascular check-up in an outpatient clinic in the Department of Cardiology. We analyzed 134 patients to match age and sex with available data among 243 patients. Sixty-nine hypertensive patients and 65 normotensive controls were enrolled. Institutional Review Board approved this protocol. For the purpose of the present study, subjects with known organic heart disease (hypertrophic cardiomyopathy, atrial fibrillation, ischemic heart disease, valvular heart disease, dilated cardiomyopathy, congestive heart failure, and coronary artery disease) were excluded. Patients with secondary HTN on the basis of classic laboratory and radiology tests, severe HTN (stage 3), insulin-dependent diabetes, severe renal insufficiency (creatinine >300 umol/L), aortic disease (aneurysm, Marfan syndrome, coarctation, and aortic surgery), and peripheral artery occlusive disease were not included in the study. Patients with all forms of cardiovascular diseases, with the exception of HTN which can influence LVEDP, were excluded. Hypertensive patients included the patients under treatment for hypertension. Each participant was reviewed in detail regarding personal medical history and tobacco use. All participants underwent a complete physical examination and routine biochemical analysis for blood and urine. Overnight fasting blood samples were collected for measuring plasma biochemical parameters including plasma triglycerides, total cholesterol, LDL-cholesterol, HDL-cholesterol, and glucose.
The patients were divided into four groups based on the E/E' ratio and the presence of HTN. Group I (n=34) consisted of patients with a normal E/E' ratio (≤8) without HTN, group II (n=31) consisted of patients with an elevated E/E' ratio (>8) without HTN, group III (n=20) consisted of patients with a normal E/E' ratio (≤8) with HTN, and group IV (n=49) consisted of patients with an elevated E/E' ratio (>8) with HTN.
2. Assessment of arterial stiffness
To evaluate arterial stiffness, the AD and baPWV were measured.
1) AD
Transthoracic echocardiographic evaluation was performed with a GE-Vingmed Vivid 7 System (GE-Vingmed Ultrasound AS, Horten, Norway) using a 2.5-3.5 MHz transducer. AD was determined non-invasively based on the relationship between changes in aortic diameter and pressure with each cardiac pulse.
Ascending aorta diameters were measured at a level 3 cm above the aortic valve by 2-dimensional-guided M-mode echocardiography in the left parasternal long-axis view. M-mode traces were recorded at a speed of 50 mm/sec. Aortic systolic (AoS) diameter was measured as the maximal anterior motion of the aorta, and the aortic diastolic (AoD) diameter at the peak of the QRS complex at the simultaneous electrocardiogram recording. After the echocardiographic examination, blood pressure was measured from the right arm with a standard sphygmomanometer. The pulse pressure (PP) was calculated as the systolic blood pressure minus the diastolic blood pressure. AD was calculated using the following formula: 2 × (pulsatile change in aortic diameter) / (diastolic aortic diameter) × (aortic pulse pressure).
2) baPWV
The right baPWV was measured using a volume-plethysmographic apparatus(VP1000, automated PWV/ABI analyzer(PWV/ABI); Colin Co. Ltd., Komaki, Japan). The VP1000 System is designed to determine the arterial stiffness from the pulse wave time interval and velocity measurements. Subjects were examined in the supine position after a 10-minute rest. The VP 1000 System records the PWV, blood pressure, ECG, and heart sounds simultaneously. ECG electrodes were placed on both wrists, and a heart sound microphone was placed on the left sternal border. The cuffs to measure the baPWV were wrapped around both upper arms and ankles, and connected to a plethysmographic sensor that determines the volume-pulse form. Volume waveforms were stored for a sampling time of 10 seconds with automatic gain analysis and quality adjustment. The PWV was calculated from measurements of the pulse transit time and the distance travelled by the pulse between two recording sites - the distance is measured on the surface of the body in meters - according to the following formula: PWV (cm/s)=distance (cm) / transit time (s).
3. Echocardiographic measurements and LVEDP
Echocardiographic measurements were obtained with patients in the left lateral decubitus position. The two-dimensional and M-mode echocardiograms were obtained according to the recommendation of the American Society of Echocardiographpy.12 Three consecutive cycles were averaged for every parameter. The LV end-diastolic and end-systolic dimensions were measured using M-mode echocardiography recorded from the parasternal long axis view. The LV end-diastolic and end-systolic volumes were measured. The LV mass was estimated from the following formula by Devereux and Reichek:13 LV mass (g) = 1.04 × ((interventricular septal thickness + LV posterior wall thickness + LV end-diastolic dimension)3 - LV end-diastolic dimension3) - 13.6. The LV mass was divided by body surface area to derive the LV mass index.
Diastolic function was determined based on Doppler echocardiography and evaluated by the analysis of peak transmitral inflow velocities (E: early diastolic mitral flow velocity, A: late diastolic mitral flow velocity). The deceleration time of the E waves were also measured. Using pulsed-wave tissue Doppler, peak velocities during early (E') and late (A') diastole obtained at the level of the septal mitral annulus were measured. Thereafter, E/A and E/E' ratios reflecting LVEDP were calculated. At least three cardiac cycles were averaged for each parameter measurement.
4. Blood pressure
Blood pressure was measured in the morning on the right upper arm in line with the heart in a sitting position after a minimum of 5 minutes of rest by mercury column sphygmomanometry. Blood pressure was measured twice with ten minutes interval and the mean value was calculated. HTN was defined as a systolic blood pressure ≥140 mmHg or diastolic blood pressure ≥90 mmHg measured with a minimum of 3 random measurements during the last month, or current treatment for HTN. The mean arterial pressure (MAP) was estimated from the systolic (SBP) and diastolic pressures (DBP) as follows: MAP=DBP+1/3 (SBP-DBP).The PP was calculated as the SBP minus the DBP.
5. Data analysis
All continuous values are expressed as the mean±SD. Differences in continuous variables between two groups were assessed using unpaired Student's t-tests, and differences between four groups were assessed using one-way ANOVA for normally distributed variables. Categorical variables were recorded as frequency counts and intergroup comparisons were analyzed by a chi-square test. The Pearson correlation method was used to calculate the relationships between variables. Statistical significance was set at a p<0.05. All statistical analyses were performed using SPSS 12.0 software (SPSS Inc., Chicago, IL, USA).
RESULTS
1. Overall population
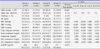
The clinical and biochemical characteristics of the patients according to each group are shown in table 1. One hundred thirty-four patients (69 men) were enrolled and the median age was 46.0±11.3 years (range, 20-77 years). Sixty-nine patients with HTN and 65 gender- and age-matched control subjects with no previous or existing HTN or heart disease were studied. As expected, the hypertensive subjects had higher SBP, DBP, and MAP than those of normotensive subjects, and the highest SBP, DBP, and MAP were obtained in the hypertensive and high LVEDP group (group IV). The mean age did not differ significantly among the study groups and the sex distribution was similar among each group. The plasma total cholesterol and LDL-cholesterol concentration were higher in group IV than group I (p=0.004 and p=0.022, respectively). There were no differences in smoking status between the study groups.
2. Arterial stiffness
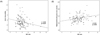
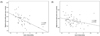
Arterial stiffness differed between the groups. Table 2 shows the arterial stiffness measured through AD and baPWV. The mean values of AD were 5.0±2.5, 4.6±1.8, 3.4±1.7, and 3.3±2.0 in group I, II, III, and IV, respectively. Group III had a lower AD compared to group I (p=0.015), and group IV had a lower AD compared to group II (p=0.001), but group I and II were comparable (p=0.403) and group III and IV were comparable (p=0.842). The mean baPWVs were 1186±178, 1259±238, 1422±182, and 1456±228 cm/sec in group I, II, III, and IV, respectively. Group III had a higher baPWV compared to group I (p<0.01), and group IV had a higher baPWV compared to group II (p<0.01), but group I and II were comparable (p=0.215) and group III and IV were comparable (p=0.575). A Pearson correlation analysis revealed that the E/E' ratio was negatively correlated with AD (r=-0.201, p=0.020) and positively correlated with baPWV (r=0.261, p=0.005; Fig. 1). AD had a negative correlation with the baPWV in groups with a lower E/E' ratio (group I and III; r=-0.580, p<0.01) and with those in groups with a higher E/E' ratio (groups II and IV; r=-0.284, p=0.020; Fig. 2).
3. Echocardiographic measurements and LVEDP
Table 3 presents echocardiographic and tissue Doppler image-derived parameters of the study groups. The LV end-diastolic volume, LV end-systolic volume, and LV ejection fraction were not significantly different among the 4 groups (p=0.783, p=0.413, and p=0.541 by ANOVA). Group I had a significantly higher E/A ratio compared to group III (1.4±0.5 vs. 1.1±0.3, p=0.017) and group II had a significantly higher E/A ratio compared to group IV (1.2±1.0 vs. 1.0±0.3, p=0.002).
DISCUSSION
To date, no reports have described the relationship between arterial stiffness and in non-invasively estimated LVEDP. The principal finding of the present study was that patients with HTN had a lower AD and higher baPWV compared to normotensive subjects, independent of the LVEDP. This result demonstrates that HTN itself influences arterial stiffness independently. A weak correlation between the E/E' ratio and AD and the baPWV suggest that LVEDP may also influence arterial stiffness.
Increased aortic stiffness and LV diastolic dysfunction have frequently been shown to occur together in the latest clinical investigations, although a causal relation is not certain.9,14-16 Recent study showed that there was a relationship between LV diastolic function and arterial stiffness in patients with diabetes, HTN, or both.9 In subjects with essential HTN, however, there is a report that arterial stiffness is increased regardless of LV diastolic dysfunction.1 The findings of the current study are consistent with these reports and further demonstrated the relationship between arterial stiffness and LVEDP. The present study is the first study to show results that arterial stiffness of hypertensive patients is increased regardless of the LVEDP. But weak correlation between LVEDP and AD suggests that diastolic function may affect arterial stiffness insignificantly.
It is well-known that impaired arterial stiffness is associated with older age, HTN, diabetes mellitus, and African-American ethnicity.9,17 Additionally, there is a report that decreased AD exists in current smokers and in subjects with lower HDL-cholesterol levels.17 The current study showed that there were no significant differences in the proportion of smokers and mean values of HDL-cholesterol in the four groups.
Although the mechanism by which HTN leads to an increase in arterial stiffness and the relationship between arterial stiffness and diastolic function is unclear, the followings are possible explanations. First, parallel changes may occur in the cardiac and arterial walls due to HTN or diabetes. Thus, LV diastolic dysfunction and arterial stiffness may be an epiphenomenon of myocardial and arterial injuries, which are well-characterized in patients with diabetes and HTN. The second possible explanation is that increased arterial stiffness may also increase afterload, inducing myocardial structural changes of the LV, and in turn LV diastolic dysfunction.9 Decreased AD and loss of elastic homogeneity of the aorta result in an increased PWV.18
In prior studies it was shown that pulsatile changes in the ascending aortic diameter can be measured during routine transthoracic echocardiography and non-invasive measurements of AD by echocardiography, based on aortic dimensions and blood pressure data, are as accurate as invasive methods.19 The PWV can be easily and automatically determined directly related to arterial wall stiffness and to wall thickness.1 Measurement of the PWV is accurate and highly reproducible. The PWV is not only a non-invasive method used to assess arterial stiffness, but also a useful, simple method to estimate the severity of HTN, end-stage renal disease, and atherosclerosis. A prior study described that PWV was inversely related to ascending and abdominal AD (r=-0.56 and r=-0.50, respectively).18 The baPWV, but not the carotid-femoral, heart-carotid, heart-femoral, or femoral-ankle PWV, is the combined measure of both central and peripheral arterial stiffness, and significantly correlated with LV diastolic function in hypertensive subjects, indicating that baPWV involving both central and peripheral components of arterial stiffness may be an early indicator of LV dysfunction.20 Moreover, the variation of repeated baPWV measurements is small.21 The current study also showed a correlation between AD and baPWV regardless of the degree of LVEDP. These finding suggests that these reliable methods can be used in place of the invasive method commonly in clinical use.
Our study had some limitations. First, we used non-invasive estimation of LVEDP without more accurate invasive measurement of LVEDP such as cardiac catheterization. However, many investigators have showed that E/E' ratio is correlated with LVEDP.22-26 Second, the current study is a retrospective study in a single center. Third, the study had a cross-sectional design, which precluded study of the causal relationship between HTN and arterial stiffness. Fourth, this study results may be influenced by several classes of antihypertensive medications shown to influence measurements of arterial stiffness. However, study population took optimal treatment and this study reflects real practice. The number of study population was too small to analyze the effect of antihypertensive medication. Fifth, the study subjects were a relatively small cohort of patients during a limited time frame. Further study evaluating more detailed diastolic function in a large number of subjects is necessary.
In conclusion, arterial stiffness is impaired in hypertensive patients compared to normotensive subjects, and this finding is independent of the LVEDP. The LVEDP may influence arterial stiffness insignificantly in all subjects, but further studies are needed to confirm a causal relationship. Echocardiographic AD and baPWV are highly correlated and accurate non-invasive methods for the measurement of arterial stiffness.


 XML Download