

 PDF
PDF ePub
ePub Citation
 Print
Print


INTRODUCTION
Increased arterial stiffness is a hallmark of the aging process and it is frequently accompanied with various diseases including DM mellitus (DM), atherosclerosis, and chronic renal insufficiency.1 Increase in arterial stiffness has been known to develop from a complex interaction of stable and dynamic changes in the structural and cellular elements of the vessel wall.1 Although systolic hypertension is known to be one of important contributors to the adverse prognosis associated with increased arterial stiffness, arterial stiffness can be a risk factor for stroke, coronary artery disease, and heart failure independent of increased blood pressure.2 Recent studies suggest that inflammatory conditions including elevated homocysteine (Hcy) are associated with increased arterial stiffness.3,4
Elevated plasma Hcy has been recognized as an independent risk factor for cardiovascular disease (CVD) as well as increased morbidity and mortality associated with CVD. The etiology of CVD includes endothelial dysfunction, smooth muscle cell proliferation, increased collagen synthesis, and structural changes in elastin.5 Although Hcy may be associated with CVD, its role in the development of premature vascular damage is not clear. Previous studies about the effect of excess plasma Hcy on arterial function have yielded inconsistent results.6-9 Furthermore, the effect of Hcy on arterial stiffness in patients with DM has not been extensively investigated, despite its known association with macro- and microvascular complications of DM.10,11 In this background, we aimed to evaluate the association of Hcy concentrations and arterial stiffness in subjects with type 2 DM using brachial-ankle pulse wave velocity (baPWV) as an index of arterial stiffness.
MATERIALS AND METHODS
1. Patients
The study population consisted of 1,516 Korean subjects with type 2 DM whose plasma Hcy levels and baPWV were measured between January 2009 and December 2010. All patients visited the DM clinic of Asan Medical center (AMC, Seoul, Republic of Korea). Information on smoking habits, medical history, drug use, and history of previous medical diseases and surgery was obtained through interview by a specially trained nurse. Age, sex, body mass index (BMI), duration of DM, systolic blood pressure (SBP), diastolic blood pressure (DBP), plasma concentrations of fasting glucose, hemoglobin A1c (HbA1c), total cholesterol, triglycerides (TG), high-density lipoprotein cholesterol (HDL-C), low-density lipoprotein cholesterol (LDL-C), Hcy, uric acid, serum creatinine, and high-sensitivity C-reactive protein (hsCRP) were recorded. Hypertension was defined as a mean of three independent measures of blood pressure ≥140/90 mmHg, or current use of an antihypertensive drug. Smoking behavior was recorded as nonsmoker, former smoker, or current smoker. Body mass index (BMI) was calculated as body weight (kg) divided by height squared (m2).
We analyzed data for 1,477 subjects after excluding subjects with liver cirrhosis (n=21) and history of liver tranplantation (n=5), subjects whose ankle brachial index (ABI) was >1.3 or <0.95 in order to ensure the accuracy of baPWV value (n=13). The Local Ethics Committee approved this retrospective review protocol.
2. Biochemical measurements
After overnight fasting, early morning blood samples were drawn from an antecubital vein into vacutainer tubes and then analyzed at a central, certified laboratory of the AMC. Fasting total cholesterol, HDL-C, LDL-C, TG, and uric acid levels were measured by an enzymatic colorimetric method, creatinine was measured using the Jaffe method, hsCRP was measured by the immunoturbidimetric method, and serum glucose was measured by the glucose oxidase method, all with the Toshiba 200FR Neo (Toshiba Medical System Co., Ltd., Tokyo, Japan). HbA1c was measured by an immunoturbidimetric method using the Integra 800 System (Roche Diagnostics., Basel, Switzerland). Total plasma Hcy was assayed using a direct competitive chemiluminescent enzyme immunoassay (ADVIA Centaur, Bayer, USA). Estimated glomerular filtration rate was calculated using the Cockcroft-Gault equation.
3. Assessment of arterial stiffness
Arterial stiffness measurements were conducted in the morning, in a quiet environment, at a stable temperature, and after at least 12 hour abstinence from caffeine, alcohol, and smoking. Bilateral brachial and ankle blood pressures (BPs) and arterial pulse waves were measured simultaneously using an automatic waveform analyzer (VP- 1000; Colin, Komaki, Japan). Subjects were examined in the supine position after at least 5 minutes of bed rest. Electrocardiograph electrodes were placed on both wrists. Pneumonic cuffs were wrapped around both left and right upper arms and ankles and connected to a plethysmographic sensor to measure the volume pulse waveform. Waveforms for the upper arm (brachial artery) and ankle (tibial artery) were stored for 10 second sample times with automatic gain analysis and quality adjustment. The baPWV value was calculated using the following equation: baPWV (cm/sec) = (La-Lb)/Δhe, where Δhe was the time interval between the fronts of the brachial and ankle waveforms. The path lengths from the suprasternal notch to the brachium (Lb) and from the suprasternal notch to the ankle (La) were estimated from the height of the subject. The index of arterial stiffness was the mean of the right and left baPWV values.
4. Assessment and definition of diabetic complications
Urinary albumin excretion (UAE) was expressed as the urine albumin-to-creatinine ratio (UACR) in a spot urine. The presence and severity of diabetic retinopathy were assessed from retinal photographs obtained using a wide-angle camera, classified as nonproliferative or proliferative, and scored at the study center by an expert or an ophthalmologist. CVD was defined by a physician-diagnosed history, (e.g., previous myocardial infarction, angina, history of coronary artery bypass graft, and/or stroke). Peripheral arterial disease was defined as a history of claudication confirmed by lower limb arteriograms. Presence of peripheral diabetic neuropathy was assessed using nerve conduction velocity studies.
5. Statistical analysis
Distributions of continuous variables were assessed for normality using the Kolmogorov-Smirnov test (cut off at p=0.05) and presented as means±standard deviation. Continuous variables with a skewed distribution were expressed as the median and interquartile ranges. Categorical variables were expressed as percentages (%). Serum triglyceride and hsCRP concentrations were log-transformed for analysis to correct for skewed distributions; the values presented in the tables were expressed as untransformed data for ease of interpretation.
Subjects were stratified into four groups (i.e., quartiles) according to plasma Hcy concentration in µmol/L: Q1≤9.6, Q2=9.7.11.6, Q3=11.7.14.2, Q4≥14.3. Clinical and biochemical characteristics according to the Hcy quartiles were compared using one-way analysis of variance (ANOVA) or the Kruskal-Wallis test for continuous variables or the Chi-square test for categorical variables. Associations between continuous variables were described using Pearson's correlation coefficients or Spearman's rho coefficients, depending on normality of the distribution. Multivariate linear regression analyses were performed for the effect of Hcy concentration on baPWVs; model 1 was adjusted for age, sex, BMI, SBP, smoking habits, and LDL-C, all of which are conventional risk factors for CVD; model 2 was adjusted for age, BMI, duration of DM, SBP, DBP, angiotensin converting enzyme inhibitor (ACEi) or angiotensin receptor blocker (ARB) use, TG, creatinine, and hsCRP, all of which showed a statistically significant (p<0.05) or borderline significant (p<0.10) associations in the univariate analysis; model 3 was adjusted for both model 1 and 2 variables. All independent variables in the multivariate models were tested for multicollinearity. If the variance inflation factor value exceeds 10, the variable was considered to be collinear. Data were analyzed with SPSS 17.0 statistical software (SPSS Inc., Chicago, IL, USA). A two tailed p-value less than 0.05 was regarded as statistically significant.
RESULTS
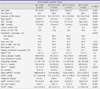
1. Patient Characteristics according to the plasma Hcy concentrations
The overall clinical and biochemical characteristics of the study population according to the Hcy quartiles are presented in Table 1. The mean age was 59.2±10.4 years, mean BMI was 25.1±3.2 kg/m2, and mean HbA1c was 7.5±1.3%. The mean Hcy concentration was 12.7±4.8 µmol/L and 21.8% of the subjects had values ≥15.0 µmol/L (n=322). Patients with high Hcy tended to be older, and were more likely to be male, and current smoker and have a longer duration of DM, higher SBP and DBP. The prevalence of retinopathy, and neuropathy showed the positive relationship with plasma Hcy quartile categories. Subjects assorted to higher plasma Hcy quartiles were also more likely to receive insulin treatment, to use ACEi or ARBs, and statins. We could also observe the significant positive relationship with the levels of UACR, TG, LDL-C, hsCRP, and uric acid levels and plasma Hcy quartile categories.
2. Association of plasma Hcy concentration with clinical characteristics including baPWV
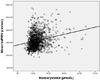
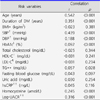
Overall, Hcy had a significant, positive correlation with age (r=0.154, p<0.0001), duration of DM (r=0.160, p<0.0001), BMI (r=0.092, p<0.0001), SBP (r=0.439, p<0.0001), DBP (r=0.144, p<0.0001), UACR (r=0.250, p<0.0001), hsCRP (r=0.065, p=0.022), and baPWV (r=0.245, p<0.0001, Fig. 1). Table 2 depicts the correlation analysis results between pulse wave velocity and other risk factors. Results of multivariate linear regression analyses are presented in Table 3. Hcy level was an independent risk factor for increased baPWV (standardized β=3.8, p=0.01) in each of the three models after controlling for factors known to influence Hcy levels such as age, sex, and creatinine.
DISCUSSION
In this cross-sectional study, we found a positive relationship between plasma Hcy concentrations and baPWV in adult subjects with type 2 DM, independent of conventional cardiovascular risk factors. Hcy, a sulfur-containing amino acid derived from the metabolism of methionine, has been known as a risk factor for atherothrombosis and CVD.12 Since the first discovery of the Hcy by Butz et al in 1932 in human, the description of homocysteinuria was firstly reported as a case study. Researchers described a case of a hyperhomocysteinemic mentally retarded 8-year-old boy who strangely died of a massive heart attack. After then, McCully et al linked vascular disease and high level of Hcy in 1969, and subsequent investigations have been done to confirm his hypothesis.12 However, mechanisms underlying elevated levels of Hcy and vascular diseases are still not well established.
Although the exact mechanism underlying the association between the elevated serum Hcy concentrations and the development of vascular diseases such as atherosclerosis is not known, several possible mechanisms have been suggested. It has been suggested that Hcy initially attacks the vascular endothelium and starts the negative cascade to vascular smooth muscle cells, platelets, lipids and coagulation factors.13 Hcy itself has the ability to generate potent reactive oxygen species (ROS) when oxidized due to its highly reactive sulfhydryl group.14 In the circulation, this thiol undergoes rapid metal-catalyzed sulfhydryl auto-oxidation, leading to the generation of superxoide and hydrogen peroxide.15 The Hcy-mediated oxidative toxicity is suggested to contribute to increase in inducible nitric oxide synthase activity and matrix metalloproteninase (MMP) mediated vascular remodeling15 and induce a chronic inflammatory state.16 Supporting this hypothesis, in our study, we could observe the significant positive relationship between serum Hcy quartile categories and hsCRP, a well-known marker of inflammation (Table 1).
Experimental studies have demonstrated that the diabetic status may reduce rather than increase the circulating Hcy levels due to enhanced Hcy catabolism through the transsulfuration pathway.15 It was demonstrated that cystathionine beta-synthase and cystathionine gamma-lyase, enzymes involved in the transsulfuration pathway were markedly increased by diabetic status.17,18 Also, glucocorticoids and glucagon, hormones whose concentrations are increased in DM, decrease Hcy and increase activities of cyastathionin beta-synthase and cystathionine gamma-lyase.19 From these experimental studies it is clear that diabetic status per se in the absence of other DM-associated risk factors or co-morbidities may decrease Hcy levels. For epidemiologic studies, debates still remained. Recently Mazza et al showed Hcy was 35% lower in DM compared with healthy subjects,20 but Ndrepepa et al showed that Hcy level was higher in diabetic than non-diabetic patients.21 For now, it is very hard to define the impact of DM per se in Hcy metabolism in human. However, the effect of Hcy on endothelial function in patients with type 2 DM, who are mostly characterized by endothelial dysfunction, is known to be higher than healthy subjects.22 In patients with DM, elevated Hcy levels have been reported to be associated with endothelial dysfunction,22 insulin resistance, prothombotic state and microvascular complications.11,23 Supporting these previous data, 21.8% (n= 322) of the subjects were hyperhomocysteinemic and elevated Hcy was significantly associated with microangiopathies in our study (Table 1).
Elevation in plasma Hcy are typically caused by either genetic defects in the enzymes involved in Hcy metabolism or nutritional deficiencies in vitamin cofactors. Nutritional deficiencies in the vitamin cofactors (folate and vitamins B6 and B12) required for Hcy metabolism may promote hyperhomocysteinemia.12 Alcohol and/or caffeine use, smoking habits can lead malnutrition and may affect Hcy levels. According to the data, smoking habits were significantly associated with Hcy levels in the present study (Table 1). For effects of drugs on Hcy levels, it has been known that ACEi and beta-blockers decrease serum Hcy levels,24,25 data regarding the effect of ARB on serum Hcy level is not available. Thus, the effects of ACEi or ARB were not analyzed in the present study.
Although the Hcy is a known independent risk factor of CVD as described above, the effect of Hcy on the arterial wall in diabetic patients has not been adequately investigated. Shargorodsky et al26 reported that Hcy was associated with PWV (r=0.540, p<0.001), but the study size was very small (n=86) and duration of DM or presence of microvascular complication were not included.26 Anan et al also demonstrated that elevated Hcy level was correlated with baPWV in a cross-sectional study8 (r=0.519, p<0.0001), but the study size was also small (n=108) and effect of HbA1c and underlying microvascular complications were not identified. Although our study was retrospective and hospital-based, the sample size was relatively large, and did identify HbA1c, microvascular complications and macrovascular complications. The present study showed relatively weak correlation between Hcy and arterial stiffness (r=0.235, p<0.0001). However, our study revealed that Hcy is an independent risk factor for arterial stiffness irrespective of HbA1c and duration of DM. Furthermore, well-characterized cardiovascular risk factors enable adjustment for a wide range of other covariates that may have confounded the association. Our results indicate that Hcy is associated with baPWV in patients with type 2 DM, supporting the previously illustrated pathophysiologic indications that Hcy might play a potential role in the vascular remodeling of the arterial wall leading to increased arterial stiffness.11,12,27
This study had several limitations. First, it was a retrospective study at a single center. Therefore, our results may not be generalizable to a broader population of Korean patients with type 2 DM. Second, because of the retrospective and cross-sectional nature of the study, we were unable to evaluate longitudinally the association between changes in arterial stiffness and Hcy concentration. Third, our data did not include levels of B vitamins. However, because B vitamin supplementation does not seem to alter the risk for cardiovascular events,26 we believe the data are valid without reference to vitamin B levels. Finally, although multiple regression analysis supports our conclusions, other, uncontrolled, variables may have influenced arterial stiffness. Especially hypertension is the widely known key factor of arterial stiffness, but the presence of hypertension itself was not evaluated in this study.
The importance elevated serum Hcy as an independent cardiovascular risk factor in type 2 DM remained unclear. In concurrence with previous studies, the present study showed a significant association between Hcy concentration and arterial stiffness irrespective of traditional cardiovascular risk factors in a large number of patients. The result of the present study suggests that hyperhomocysteinemia may be associated with atherogenesis in type 2 diabetic patients. Prospective studies to determine whether lowering of Hcy level can reduce arterial stiffness and cardiovascular morbidity in type 2 DM are warranted.

 XML Download