

 PDF
PDF ePub
ePub Citation
 Print
Print


Introduction
Dendritic cells (DCs) are the most potent antigen-presenting cells and play a critical role in the homeostasis of the immune system. They act as an interface between the innate and adaptive immune responses [1]. Activated DCs migrate to the draining lymph node, where they regulate the differentiation and proliferation of naïve T cells into effector T cells [23]. The optimization of DC function can be initiated by gene modification [4]. In most cases, the aim of DC gene modification is to enhance an immune response in the body, but it can also be used to prepare tolerogenic DCs. In our previous study, we found that early growth response 2 and disabled homologue 2 act as negative regulators of immunogenic DCs [56]. In the present study, we found that Src homology 2 (SH2) domain–containing adaptor protein B (SHB) is highly expressed in DCs and investigated the biological functions of SHB in DC immunogenicity.
SHB is a ubiquitously expressed adaptor protein that regulates several signal transduction cascades by linking activated receptors to downstream signaling components. Its role is well established in other immune cells but has never been investigated in DCs. SHB is involved in the signaling cascades downstream of vascular endothelial growth factor receptor 2 [7], platelet-derived growth factor receptor [8], T-cell receptor (TCR) [9], and interleukin 2 receptor (IL-2R) [10]. SHB interacts with both linker for activation of T cells and SH2 domain containing leukocyte protein of 76 kDa, which is accompanied by phosphorylation of the downstream targets vav guanine nucleotide exchange factor 1 and phospholipase C-γ1 (PLC-γ1) for the full TCR signaling cascade [1112]. IL-2R derived signals are also transmitted to T cells and natural killer cells via SHB [10]. SHB contains a SH2 domain [7] in its C-terminus, proline-rich sequences in its N-terminus, and a central phosphotyrosine-binding domain [9]. Overexpression of SHB in the PC12 cell line induces fibroblast growth factor (FGF)– and nerve growth factor–mediated neurite outgrowth [13]. SHB binds to tyrosine in the FGF receptor-1 and regulates the Ras/MEK/mitogen-activated protein kinase (MAPK) pathway, and the mutation of tyrosine 766 on SHB reduces the activation of MAPK [13]. Granulocyte-macrophage colony-stimulating factor (GM-CSF) also mediates MAPK signaling during DC development [1415]. To assess the protein associated with SHB expression, we used the Genecard software (http://www.genecards.org) and found that Foxa2 (previous name HNF3β) transcription factor might be involved in the expression of SHB. FoxaFoxa2 is a member of the Forkhead box protein family and is involved in a wide range of biological processes during development and adulthood [16]. Foxa2 is expressed in the respiratory epithelium, and conditional deletion of Foxa2 results in Th2 inflammation in the lungs [1718]. It has also been reported that SHB deficiency induces Th2 immune responses, which increase the severity of atopic dermatitis in mice [1920]. However, FoxaFoxa2 has never been investigated in relation to expression of SHB.
DCs lead to various T-cell polarizations, resulting in different types of T-cell immunity [20]. In addition, the cytokine profile of activated T cells determines the effector function of T cell–mediated responses [321]. Th2 immune responses protect the body from extracellular parasites through the secretion of Th2 cytokines such as IL-4, IL-5, and IL-13 [3222324]. Asthma and atopic dermatitis are caused by aberrant Th2 immune responses, characterized by the elevation of eosinophils and basophils in the blood, along with a high level of serum immunoglobulin E (IgE) [252627].
In the present study, we found that DCs express large amounts of SHB during their development. In a SHB-deficient condition, DCs induced Th2 polarization rather than that of Th1 in DC-mediated T cell responses in vitro. Inoculation of a murine model of atopic dermatitis with SHBKD DCs increased the severity of atopic dermatitis, which is consistent with the results shown in SHB-knockout (SHBKO) mice [20]. The development of more pronounced symptoms of atopic dermatitis in SHBKO mice compared to wild type (WT) mice is likely due to the effects of SHB-deficient DC–mediated Th2 polarization in vivo. In conclusion, SHB expression in DCs plays a critical role in DC-mediated T-cell immune homeostasis by regulating DC-mediated Th2 polarization.
Materials and Methods
Mice, cell lines, and reagents
Six- to 8-week-old female C57BL/6 (H-2b), C57BL/6-background OT-2 (OVA-specific CD4+ T cell receptor), and BALB/c mice were used. The experimental mice were maintained in the animal care facility of Sungkyunkwan University according to the University Animal Care and Use guidelines. 5,6-Carboxyflouroscein succinimidyl ester (CFSE) (BiolegendR), a p38 inhibitor (Cell Signaling, Beverly, MA, USA), and Protein A/G PLUS-Agarose (Santa Cruz Biotechnology, Santa Cruz, CA, USA) were used. SHB polyclonal antibodies were purchased from Abcam (Cambridge, UK) and Santa Cruz Biotechnology. Antibodies to p38 MAPK and p-p38 MAPK were purchased from Cell Signaling. Anti–β-actin and horseradish peroxidase (HRP)–conjugated anti-rabbit and anti-mouse IgGs were purchased from Sigma-Aldrich (St. Louis, MO, USA). Anti-phosphoserine antibody was obtained from Abcam. Murine GM-CSF was obtained from Creagene Inc. (Seongnam, Korea). Lipopolysaccharide (LPS, from O111:B4) was purchased from Sigma-Aldrich. Ovalbumin agonistic peptide (OVA323-339; ISQAVHAAHAEINEAGR) was synthesized and provided by Peptron (Daejon, Korea). fluorescein isothiocyanate (FITC)– or phycoerythrin (PE)-conjugated CD4, CD8, CD25, CD11c, CD40, CD80, CD86, MHC class II, MHCI, Foxp3 antibodies, and cytokine enzyme-linked immunosorbent assay (ELISA) kits for murine IL-6, IL-12p70, IL-10, IL-17A, IL-1β, tumor necrosis factor α (TNF-α), interferon γ (IFN-γ), and IL-4 were purchased from BioLegend (San Diego, CA, USA). A mouse IL-13 ELISA kit was purchased from Abcam.
Mouse bone marrow-derived DCs and splenic DCs
Bone marrow (BM)–derived DC (BMDCs) were generated as described previously [628]. Briefly, BM cells were collected from the femurs and tibiae of 6-week-old female C57BL/6 mice and treated with ACK lysing buffer (Lonza, Walkersville, MD, USA) to remove red blood cells. Cells were then washed and cultured in complete RPMI 1640 media (RPMI 1640 [GibcoR] supplemented with 10% fetal bovine serum [FBS], penicillin-streptomycin [GibcoR]) containing 10 ng/mL mGM-CSF (Creagene Inc.). Two days later, the non-adherent cells in the cultures were washed, and 2 mL of fresh complete media containing mGM-CSF (10 ng/mL) was added. On day 4, 1 mL of fresh media containing mGM-CSF (10 ng/mL) was added to the culture. On day 6, non-adherent cells were collected as immature DCs (imDCs) and were matured with 200 ng/mL LPS for 24 hours. Splenic DCs (spDCs) were isolated from the spleens of 6-8-week-old C57BL/6 mice using CD11c microbeads according to manufacturer's instructions (Miltenyi Biotech, Madrid, Spain).
SHB knockdown with small interfering RNA
SHB-specific small interfering RNA (siRNAs) were designed using BlOCK-IT RNAi Designer (Invitrogen, Carlsbad, CA, USA) to avoid any off-target effects. Two siRNAs, one specific to SHB 5'-CCGATCCCTTTGATGCCAA-3' (si-shb), and the other the control siRNA 5'-AGAGGGATCGGCTGAAAGAACCTAA-3' (si-con), were synthesized by Genolution (Seoul, Korea). DC precursor cells from cultures of mouse BM cells on day 4 were transfected with si-shb or si-con RNA using Lipofectamine RNAiMAX (Life Technologies, Carlsbad, CA, USA) [6]. Briefly, 100 µL of serum-free RPMI 1640 media containing 5 µL of 20 µM of siRNA was mixed with the same volume of serum-free RPMI 1640 media containing 5 µL of Lipofectamine RNAiMAX. The mixture was incubated for 20 minutes and then poured onto the DC culture in 6-well culture plates. After 24 hours of incubation, 1 mL of RPMI 1640 media supplemented with 10% FBS was added to the culture. Cells harvested 48 hours after transfection were washed and used as a source of SHB-knockdown imDCs (SHBKD imDCs).
Flow cytometry analysis
Immunofluorescent staining was performed for DC-surface phenotypic analysis as described previously [6]. DCs were stained in fluorescence-activated cell sorting (FACS) buffer (FACS flow, BD Bioscience, San Jose, CA, USA) with the appropriate antibodies and incubated at 4℃ for 20 minutes. FITC-labeled rat anti-mouse CD14 (rmC5-3), anti-mouse CD86 (GL1), anti-mouse I-A/I-E (2G9), anti-mouse H2-d (M1/42), PE-labeled hamster anti-mouse CD11c (HL3), anti-mouse CD80 (16-10A1), rat anti-mouse CD40 (3/23) with PE-or FITC-labeled isotype control antibodies were purchased from BD Pharmingen and BioLegend. After washing with FACS staining buffer, cells were analyzed using the BD FACSCalibur cell analyzer. For intracellular staining of SHB, cells were pre-stained with FITC-labeled CD11c antibody, then fixed and permeabilized using the BD Cytofix/Cytoperm kit (BD Bioscience Pharmingen). Cells were then incubated with SHB rabbit polyclonal antibody (Santa Cruz Biotechnology) for 1 hour, and stained with FITC-labeled secondary goat anti-rabbit IgG antibody. The stained cells were washed with BD Perm/wash buffer and analyzed with flow cytometry.
T-cell proliferation assay
WT and SHBKD imDCs were matured by culturing with LPS (200 ng/mL) for 24 hours. Before harvest, WT or SHBKD mature DCs (mDCs) were pulsed with 1 µg/mL OVA peptide (OVA323-339) for 1 hour. The OVA-pulsed mDCs were washed three times with cold phosphate-buffered saline (PBS) and then used for T-cell proliferation assays. T cells were isolated from the spleen of OT-2 transgenic mice as described previously [6]. T cells purified on nylon wool columns (Poly Sciences, Warrington, PA, USA) were labeled with CFSE (1 µM). These CFSE-labeled T cells were co-cultured with OVA peptide–pulsed DCs at different ratios (1:5, 1:10, and 1:20) for 4 days. T cells were gated, and calculations were performed using the formula for proliferation index (PI): PI=1,000/geometric sum of gated CFSE. The T-cell proliferation capacity of OVA peptide–pulsed DCs was represented by the fold increase over the PI of the T cells co-cultured with unpulsed DCs.
Quantitative real-time PCR
Total RNA from BMDCs was isolated and purified using a Ribospin kit (GeneAll, Seoul, Korea). cDNA was synthesized using the Maxima Enzyme Mix (Thermo Scientific, Waltham, MA, USA) and 5× reaction mix (Thermo Scientific). Quantitative PCR was performed using the Fast SYBR Green Master Mix kit (Life Technologies). The following primers were used: SHB (S) 5'-ATCTCCCCTAAGCACCGACT-3', (AS) 5'-CCTTTCCTGCTTTGCTCTTG-3'; GAPDH (S) 5'-AATGTGTCCGTCGTGGATCT-3', (AS) 5'-TCCACCACCCTGTTGCTGTA-3'; β-actin (S) 5'-GTATGCCTCGGTCGTACCA-3', (AS) 5'-CTTCTGCATCCTGTCAGCAA-3'.
Western blot analysis
Western blot analysis was performed as described previously [6]. Briefly, cells were washed in cold PBS and lysed with a buffer containing 50 mM Tris-HCl (pH 7.4), 150 mM NaCl, 1 mM dithiothreitol, 30 mM NaF, 10 mM Na3VO4, 0.5% NP40, and a protease inhibitor cocktail (Roche, Basel, Switzerland). Cell lysates were subjected to 8%-12% sodium dodecyl sulfate polyacrylamide gel electrophoresis (SDS-PAGE), and the protein bands were transferred to a PVDF membrane (Millipore, Billerica, MA, USA). For immunoblotting, membranes were blocked for 1 hour at room temperature with 5% nonfat dry milk in 0.5% TBST. Membranes were washed four times in TBST and incubated overnight at 4℃ with primary antibodies in 4% nonfat dry milk. After incubation, the membrane 4 additional times in TBST. The membrane was then incubated for 1 hour with HRP-conjugated secondary antibodies. Antibody binding was detected using a chemiluminescent HRP substrate (Millipore) and the Chemiluminescent Imaging System (Davinch Chemi, CoreBio, Seoul, Korea).
Immunoprecipitation
Immunoprecipitation (IP) was performed as described previously [6]. BMDCs were harvested, washed, and lysed with IP lysis buffer containing 25 mM HEPES (pH 7.4), 150 mM NaCl, 1 mM EDTA, and 0.5% TritonX-100. After adding the lysis buffer, samples were incubated for 5 minutes on ice. The samples were sonicated, the insoluble material was separated by centrifugation, and the supernatants were incubated with the appropriate concentration of primary antibody at 4℃ overnight with rotation. Then, Protein A/G PLUS-Agarose (Santa Cruz Biotechnology) was added, and the samples were allowed to incubate for 1 hour. The samples were washed and subjected to SDS-PAGE. The resolved proteins were transferred onto nitrocellulose membranes and immunoblotted with specific antibodies. The protein bands were detected by enhanced chemiluminescence.
MTT assay
To assess the total live T-cell population during DC/T cell co-culture experiments, the 3-(4,5-dimethylthiazol-2-yl)-2,5-diphenyltetrazolium bromide (MTT) assay was performed as described previously [12]. Briefly, DCs and T cells (OT-2) were co-cultured in 96-well plates at 37℃ and allowed to grow for 3 days. Then, 20 µL (5 mg/mL) of MTT solution was added to the cultures and incubated for 4 hours, followed by the addition of stabilizing buffer. The cultures were then incubated at 37℃, and absorbance was measured at 570 nm.
ELISA
DC precursor cells were transfected with si-shb and si-con on day 4 of culture. Then, 48 hours after transfection, cells were stimulated by LPS (200 ng/mL) for 24 hours. The cells were harvested, and culture supernatants were used for ELISA assay. BMDC (si-con or si-shb)-derived cytokines were detected by ELISA kits for mouse IL-6, IL-12p70, TNF-α, IL-1β, and IL-10. DC/T cell co-culture supernatants were harvested on day 3 of culture and were assessed via ELISA for the expression levels of IFN-γ, IL-17A, IL-4, and IL-13.
Generation of a murine atopic dermatitis model and inoculation with SHBKD DCs
Atopic dermatitis on the ears of BALB/c mice was generated as described previously [29] with minor modifications. Briefly, the ear surfaces of mice were stripped three times with surgical tape (Nichiban). Thirty minutes later, 20 µL of 1% dinitrocholorobenzene (DNCB; Sigma) was painted onto the ear surfaces. Four days later, they were repainted with 1% DNCB; this process continued for two weeks. On day 3 and day 10 of DNCB painting, the mice were vaccinated with OVA257-264 peptide-pulsed WT (si-con) and SHBKD DCs. Dermatitis symptoms were monitored every 3 days using a slide caliper until day 33. Then mice were humanely euthanized for histopathology.
Histopathology
Histopathology was performed as described previously [2930]. The ears with dermatitis were obtained from sacrificed mice on day 33 of the previously described method, fixed in 10% neutral-buffered formalin for 2 days, and then dehydrated and embedded in paraffin blocks. Sections (5 µm) were cut along the cross-sectional axis, mounted, and stained with hematoxylin and eosin as described previously [30].
Results
SHB expression during BMDC development
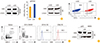
SHB was highly expressed in both immature and mature BMDCs when expression levels were examined by reverse transcriptase polymerase chain reaction and quantitative real-time PCR (qRT-PCR) (Fig. 1A), Western blot analysis (Fig. 1B), and FACS analysis (Fig. 1C). SHB expression was also detected by intracellular staining of spDCs (Fig. 1D). Moreover, SHB expression in spDCs was not changed by LPS treatment, as was shown in BMDCs (Fig. 1E). These data indicate that SHB is steadily expressed in in vitro–generated BMDCs and also in primary spDCs, regardless of the environmental conditions.
SHB is expressed in DCs in a p38-MAPK signaling-mediated FOXA2-dependent manner
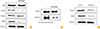
We found that SHB expression is likely to be associated with the Foxa2 transcription factor through Genecards analysis (http://www.genecards.com). To identify the mechanism underlying SHB expression during DC development in connection with Foxa2, we analyzed SHB expression in the presence of a p38-MAPK inhibitor (SB203580) and/or by Foxa2-depletion in DCs using FoxaFoxa2-specific siRNA (si-Foxa2). Treatment of DCs with SB203580 significantly reduced the expression of SHB without affecting Foxa2 expression (Fig. 2A). It is well established that MAPK signaling requires Foxa2 activation [12]. As expected, treatment with the p38-MAPK inhibitor significantly reduced FoxaFoxa2 phosphorylation in DCs even though the total amount of Foxa2 was not affected (Fig. 2B). In addition, FoxaFoxa2-knockdown in DCs using si-FoxaFoxa2 RNA also reduced the expression of SHB (Fig. 2C). These data suggest that SHB expression in DCs is dependent on Foxa2 activation under the control of p38-MAPK.
SHB controls the expression of MHC class II and co-stimulatory molecules during DC development
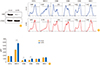
To investigate the effects of SHB expression on DC immunogenicity, we examined the surface phenotypes of SHBKD DCs after transfection withsi-shb. SHB was efficiently silenced by transfection of DCs with si-shb (Fig. 3A). SHBKD enhanced the expression of MHC class II and co-stimulatory molecules (CD80, CD86, and CD40) in BMDCs compared with WT (si-con) BMDCs (Fig. 3B). Quantitative results of DC surface phenotypes revealed that the levels of MHC class II and B-7 molecules (CD80, CD86) were significantly increased in si-shb BMDCs compared with si-con BMDCs (Fig. 3C). These data suggest that SHB expression in BMDCs might be involved in the control of DC immunogenicity.
SHB does not affect the Th1 cytokine expression of DCs
It has been reported that SHBKO mice display an augmented Th2 response [19]. We analyzed the expression levels of Th1-type cytokines secreted from WT and SHBKD DCs. We did not find any significant difference between WT and SHBKD DCs in the levels of pro- (IL-12p70, IL-6, TNF-α, and IL-1β) and anti-inflammatory (IL-10) Th1-type cytokines (Fig. 4). These data suggest that SHB expression does not affect DC-mediated Th1 immunity.
SHBKD in DCs enhances Th2 immunity
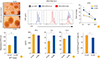
Next, we assessed the T cell proliferation capacity of SHBKD DCs. OVA323-339 peptide–pulsed SHBKD DCs were co-cultured with CFSE-labeled OT-2 T cells. In the co-culture, SHBKD DCs generated T-cell colonies that were larger on average than control DCs (Fig. 5A, upper) and the T-cell populations in co-culture with SHBKD DCs were significantly increased in MTT assay (Fig. 5A, lower). The enhanced OT-2 stimulation capacity of SHBKD DCs was further confirmed by FACS analysis (Fig. 5B), suggesting that the SHB expressed in DCs controls DC immunogenicity. In a cytokine analysis of the culture supernatants of DC/T cell co-cultures, we found that the levels of IL-4 and IL-13, Th2-type cytokines, were significantly enhanced in the co-cultures with SHBKD DCs compared with WT DCs, while there was no significant difference in IFN-γ, a Th1-type cytokine (Fig. 5C). These data strongly suggest that SHB controls the DC-mediated Th2 immune response in vitro.
Next, we evaluated the effect of SHBKD DCs on regulatory T cell (Treg) cell development. When OVA323-339 pulsed SHBKD DCs and OT-2 T cells were co-cultured for 4 days at a 1:5 ratio, CD4+CD25+Foxp3+ Treg cells were significantly decreased in SHBKD DCs (Fig. 5D). This suggests that SHB expression in DCs is involved in in control of DC-mediated Th2 immunity via stimulation of the CD4+CD25+Foxp3+ Treg population.
SHBKD DCs exacerbate the symptoms of atopic dermatitis in mice
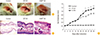
To assess the role of SHB in the immunogenicity of DCs, OVA323-339-pulsed SHBKD DCs were inoculated into BALB/c mice with atopic dermatitis. shbThe severity and rate of development of atopic dermatitis were increased in mice inoculated with SHBKD DCs compared with mice inoculated with WT DCs (Fig. 6A, B). In the histopathological analysis of ear sections, larger quantities of inflammatory cells were found to have infiltrated into the swollen ear tissues of mice inoculated with SHBKD DCs compared with WT DC-inoculated mice (Fig. 6C). These results indicate that SHB expressed in DCs plays a significant role in the control of DC-mediated pathologic Th2 inflammation.
Discussion
SHB is an adaptor protein that is widely expressed in immune cells and is involved in signaling cascades downstream of certain cell surface receptors [789]. In T cells, activated CD3 complex associated with SHB promotes the phosphorylation of TCR signaling components PLC-γ, Vav-1, and nuclear factor for activate T cells [1112]. Recently, SHB has been implicated as a regulator of Th2 cell differentiation. SHB is an integral component of the TCR signaling complex. In the absence of the SHB gene, the TCR is less responsive to stimulation, resulting in the preferential development of Th2 responses under in vitro stimulation conditions [20]. It has also been reported that SHB-deficient mice display a bias toward Th2 polarization [19]. In this study, we report for the first time that SHB expressed in DCs plays a critical role in immune balancing by controlling Th2 immune polarization.
SHB was found to be highly expressed not only in BMDCs generated in vitro, but also in in vivo spDCs regardless of maturation stage (Fig. 1). Through a Genecards analysis (http://www.genecards.com), we identified Foxa2 expression is likely to be associated with SHB expression and elucidated that Foxa2 is involved in the expression of SHB under the control of p38-MAPK in DCs (Fig. 2). Foxa2 expressed selectively in the respiratory epithelium has been shown to play a critical role in regulating Th2 cell–mediated pulmonary inflammation [18]. On the other hand, loss of SHB in T cells alters TCR signaling ability, which favors the development of Th2-driven inflammation and exacerbates allergic reactions [20]. However, Foxa2 has never been reported in association with SHB expression in any immune cells. In the present study, we found that Foxa2 is highly expressed and activated in BMDCs and is involved in SHB expression. We also demonstrated that Foxa2-mediated regulation of Th2 inflammation is attributable to SHB expression. Foxa2 expression has been shown to be under the control of p38-MAPK signaling during the differentiation of mouse BM mesenchymal stem cells [31], while GM-CSF–mediated p38-MAPK signaling is important for DC development [15]. Given this informations, we evaluateded the SHB expression in DCs, and found that SHB expression in DC is accompanied by activation of the p38-MAPK/Foxa2 signaling pathway. However, the biological function of SHB expressed in DCs might be quite different from the function of SHB in T cells.
Next, we investigated the cell surface phenotype and cytokine profile of SHBKD DCs to see the effects of SHB depletion on DC-mediated T-cell immunity. We found that the expressions of MHC class II and co-stimulatory molecules (CD80 and CD86) were significantly enhanced compared with WT DCs (Fig. 3), while there was no significant difference in expression of MHC class I or CD40. These findings suggest that SHBKD DCs may be better at stimulating CD4+ T cells than WT DCs. On the other hand, there was no significant difference in pro- or anti-inflammatory Th1-type cytokine profiles between SHB-deficient and normal DCs (Fig. 4). Taken together, these results indicate that SHB expression in DCs might be involved in the control of DC-mediated T-cell immunity by regulating the expression of immune molecules rather than by control of receptor-mediated signaling-based cytokine expression.
We therefore performed co-culture experiments with SHBKD DCs and OT-2 T cells and found that SHBKD DCs were more effective than normal DCs in stimulating OT-2 T cells (Fig. 5A, B). In a cytokine analysis of the culture supernatants, the levels of Th2-type cytokines were significantly enhanced in T cell co-culture with SHBKD DCs compared with normal DCs (Fig. 5C). These data suggest that SHB depletion modulated BMDCs to become a DC2-like phenotype, resulting in the induction of Th2 immunity. SHBKD DCs reduced the CD4+ Treg population in the co-culture experiment (Fig. 5D), suggesting that the Treg population is dependent, at least in part, on SHB-expressing DCs. Thus, SHBKD DC–mediated down-regulation of the Treg population might facilitate immune deviation toward Th2 immunity.
Finally, we evaluated the immunological effects of SHBKD DCs on Th2-type inflammation. In BALB/c mice with artificially induced atopic dermatitis, those inoculated with SHBKD DCs developed more pronounced symptoms of atopic dermatitis and serious immune cell infiltration compared to mice inoculated with control DC (Fig. 6). It was reported previously that SHB whole-knockout mice developed severe atopic dermatitis with Th2-driven inflammation, which was explained to be due to the malfunction of the TCR-signaling complex in SHB-deficient T cells [19]. However, in the present study, inoculation with SHBKD DCs resulted in similarly severe atopic dermatitis even though the mice in this study had normal T-cell expression and function. Taken together, these data suggest that SHB expression in DCs plays a critical role in the regulation of Th2-driven inflammation in DC-mediated T-cell immunity.
In conclusion, SHB is highly expressed in DCs, is involved in regulation of MHC class II and co-stimulatory molecules, and plays an important role in the immune balance of DC-mediated T-cell immunity by controlling Th2-driven inflammation. SHB might therefore serve as a therapeutic target to treat Th2-related diseases like extracellular parasitic infection. Further study of SHB activity and its interacting partners in DCs will provide a better understanding of DC-mediated T-cell immunity and provide useful insights on future drug development for Th2-driven allergies and atopic dermatitis.

 XML Download