

 PDF
PDF ePub
ePub Citation
 Print
Print


Introduction
Dengue viruses are belonging to genus Flavivirus of the family Flaviviridae. They are transmitted via mosquito Aedes aegypti. The dengue virus group comprises an independent serogroup of four closely related but antigenically distinct serotypes 1, 2, 3, and 4 [1]. It is estimated that more than 2.5 billion people are at the risk of infection by dengue virus. Dengue fever, dengue hemorrhagic fever (DHF), and dengue shock syndrome are important viral diseases caused by any of the four serotypes [2]. There is still no approved vaccine or drug for this virus. One of the challenges of dengue infection is that, although antibodies produced against the infecting serotype confer lifelong immunity against the infecting serotype, re-infection by another serotype has been associated with sever disease. Individuals with secondary dengue infection produce cross-reactive and non-neutralizing antibodies and also memory T cells, which can enhance virus replication and over production of cytokines, that in turn are risk factors for DHF [3]. The leading hypothesis to explain pathogenesis of dengue virus is the antibody-dependent enhancement of infection; which suggests cross reactive sub-neutralizing antibodies may enhance the severity of infection [2]. Therefore, an effective vaccine against dengue virus must induce a simultaneous and strong immune response against all four serotypes.
Dengue virus genome comprised of an 11-kb plus-sensed RNA, surrounded by an icosahedral scaffold and covered by a lipid envelope. The genome contains one open reading frame encoding a poly-protein, which after cleavage by host and viral enzymes, produces three structural and seven non-structural proteins (Fig. 1) [4]. The envelope protein (E protein) is the major component of the virus, which contains specific sites for host cell attachment and fusion. This protein is a dominant antigen, which is potent for induction of immune response in infected hosts and eliciting virus-neutralizing antibodies [56].
The E protein contains three domains (EDI, EDII, and EDIII) (Fig. 2). The EDIII contains C-terminal -100 amino acids and forms an immunoglobulin-like β-barrel structure composed of 10 anti-parallel beta-strands [7], which contains the virus receptor-binding sites [8]. Peptides of the EDIII have been used with promising results as antigens for serologic diagnosis and immunization against these viruses. The EDIII participates in major activities of the E protein and it is also the major antigenic domain of the whole protein [9]. These findings put together justify the choice of domain III for tetravalent vaccine design.
Several types of vaccine candidates are developed against dengue virus, that most of them are monovalent vaccines and mixed physically after production in order to formulate as a tetravalent vaccine [10]. Therefore, we attempted to design a multi-component antigen, which is expected to induce immune system against all four serotypes, simultaneously. This is very important for equal induction of immune system against all serotypes, and prevention of unbalanced immunity. Unequal immunity cause undesirable reactions such as antibody depended enhancement of disease. This construct should contain EDIII domains from all four serotypes of dengue virus. Therefore, in order to designing and construction of a tetravalent dengue vaccine we developed four consensus EDIII sequences, corresponding to four serotypes of the virus. Then, we have designed a new tetravalent protein by fusing four consensus sequences together with appropriate hydrophobic linkers. With this aim, a rational and novel in silico approach have used for prediction of structural and immunological properties of the fusion protein as a dengue vaccine candidate.
Materials and Methods
Sequence selection and multiple alignments
In the first step, the corresponding sequences of EDIII (103 amino acids) from serotype 1 (48 sequences), serotype 2 (53 sequences), serotype 3 (45 sequences), and serotype 4 (29 sequences) were collected from Genbank at NCBI website. Multiple sequence alignments using ClustalW method of MegAlign software were performed in order to identify a common fragment to all EDIII sequences from each serotype.
Construct design
Net servers and several types of bioinformatics software are applied in our study [111213141516171819202122]. The in silico gene analysis and optimization of the chimeric gene was performed using GeneRunner, EditSeq and online software such as Optimizer [11] and NEB cutter [12]. The mRNA secondary structure of the chimeric gene was predicted using Mfold program [13].
Bioinformatics analysis of recombinant fusion protein
For prediction of primary properties of fusion protein, EditSeq and online ProtParam software were used (http://web.expasy.org/protparam/). Secondary-structure prediction for fusion protein was performed by using the neural-network-based algorithm program PSIPRED (http://bioinf.cs.ucl.ac.uk/psipred/) and GOR4 method [14]. The Chou and Fasman method used for further analysis of secondary structure of protein (http://web.expasy.org/protscale/). Tertiary structure prediction was performed by three methods including Modeller (http://salilab.org/modeller/), TASSER (http://zhanglab.ccmb.med.umich.edu/I-TASSER/), and FOLDpro (http://mine10.ics.uci.edu/). The stability of produced structural models was analyzed by Pymol and swiss-pdbviewer. Evaluation of model stability was performed based on energy minimization and Ramachandran plot. The Ramachandran plots were created by Procheck based at the biotech validation site (http://nihserver.mbi.ucla.edu/SAVS1/). Relative solvent accessibility of different residues was evaluated by online SCRATCH server (http://scratch.proteomics.ics.uci.edu/). The DiNNNA online software was used for disulfide bound prediction (http://clavius.bc.edu/~clotelab/DiANNA/).
Prediction of B-cell epitopes
Web-based algorithm servers, Bcepred (http://www.imtech.res.in/raghava/bcepred/) and Discotope (http://www.cbs.dtu.dk/services/discotop/), were used for prediction of continuous and discontinue B-cell epitopes, respectively. MHC super type A1 by NetCTL 1.2 Server (http://www.cbs.dtu.dk/services/NetCTL/). Finally, we used the VaxiJen server to predict the immunogenicity of the whole tetravalent fusion protein (http://www.ddg-pharmfac.net/vaxijen/VaxiJen/VaxiJen.html).
Results
Designing and construction of fusion protein
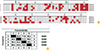
A multi-step immunoinformatic approach was used for designing a multivalent fusion protein from domain III of E protein. Firstly, the amino acid sequences of EDIII from all four serotypes were obtained from Genebank, presenting a variety of geographic and temporal origins. Multiple sequence alignments were performed in order to identify a consensus amino acid sequence for each serotype. Four consensus EDIII peptide sequences produced, and named as EDIII1, EDIII2, EDIII3, and EDIII4. Then, in order to identify sequence difference between four consensus EDIIIs, these sequences were aligned and compared, as depicted in Fig. 3. Several different residues between four EDIIIs are depicted in red blocks. As depicted in Fig. 3B, EDIII4 sequence shows maximum divergence with other EDIIIs, whereas the EDIII1 and EDIII3 are the most identical sequences (with 71.8% identity and 35.5% divergence).
Consensus EDIII sequences were used for designing a tetravalent fusion protein, which named as EDIIIF (GenBank accession No. JN985899). In order to efficient separation of the EDIIIs in fusion protein, linkers containing four repeated EAAAK sequences were inserted between EDIII sequences. It has been shown that the salt bridge Glu--Lys+ between repeated Ala residues can stabilize helix formation [15], which expected to provide independent folding of four EDIII domains. In order to, efficient purification of EDIIIF protein, a 6×-His tag sequence was added to carboxyl terminus of designed protein. The arrangement of fragments junctions and linker sites are shown in Fig. 4.
Prediction of primary and secondary structure of EDIIIF protein
On the basis of data obtained from prediction of EDIIIF properties by EditSeq software and online software ProtParam (in ExPASy tools), it is an approximately 52 kD protein (478 amino acid) with pH isoelectric 7.30. The instability index for this protein was computed to be 31.87, which classifies the protein as a stable protein in Escherichia coli. A similar analysis carried out using DiNNNA online software for disulfide bound prediction (Table 1). As depicted in the Table 1, prediction for numbers and positions of disulfide bonds in EDIIIF protein, showed that all of eight cysteine residues participate in disulfide bound formation. Clearly, there is one intra-domain disulfide bridge in each domain and no any inter-domain disulfide bond was predicted. These properties are essential for accurate conformation of EDIIIF protein, which predicted by temp-prot server analysis as well. Furthermore, predicted probability of antigenicity according the analysis by this server was 94%, which showed the EDIIIF has enough antigenicity as a vaccine candidate. The predicted antigenicity for the chimeric protein was higher than the predicted antigenicity for each EDIII proteins in separate form.
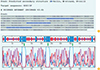
The secondary structure of the EDIIIF protein was predicted by online software. Several prediction methods were used and the results were compared for evaluation of the structure of this protein. These results indicated that helix structures lie in the regions of amino acid 104 to 123, 227 to 246, and 350 to 369, which are related to the hydrophobic amino acids entered between EDIII domains (Fig. 5).
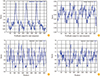
Furthermore, the accuracy of this secondary structure prediction confirmed using ProtScale server. These properties include the scores for α-helix structures, the average flexibility, the beta-sheets, and the beta turns (Fig. 6).
Prediction of tertiary structure of the EDIIIF protein
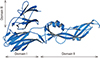
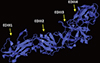
Comparative and homology modeling of the EDIIIF sequence was exploited to produce three dimensional models of the fusion protein. We used three methods for construction of three dimensional models of protein. The Modeller, Tasser1, and FOLDpro methods are very useful for this purpose. In order to precise evaluation of new EDIIIF protein several three dimensional models were generated. The models analyzed using Swiss-pdbViewer and Pymol software in order to determine the final structure of the protein. The evaluations showed that, there were three α-helixes and several β-sheets and β-turns, which were consistent with the results of secondary structure analyses, and also with the native structure of dengue virus envelope protein domain III. Formation of four separate domains in the recombinant fusion protein was approved by the results of tertiary structure prediction (Fig. 7).
In order to evaluation of EDIIIF protein stability, the profile of energy minimization was calculated by spdv software (-8,593.323 kJ/mol), which indicated the acceptable stability of recombinant protein. Additionally, the data generated by a Ramachandran plot confirmed the structural stability of the protein (Fig. 8).
Furthermore, the distribution of accessible regions to solvent (relative solvent accessibility), were predicted using the major hydrophobic and polarity properties of residual patterns. These patterns showed the acceptable solvent accessibility properties of the EDIIIF protein (Fig. 9). Accessible residues are distributed along all four domains of EDIIIF.
Prediction of B-cell epitopes
The epitopes located on the protein should be flexible and exposed to interact easily with antibodies. The Bcepred software was used to determine the continuous B-cell epitopes based on some characters including accessibility, hydrophilicity, flexibility, antigenicity, polarity, and exposed surface. There are several linear epitopes in each domain of EDIIIF, which are very important for antigenic properties of the protein (Table 2).
Furthermore, the constructed 3D models were used to predict the conformational B-cell epitopes. The 49 spatial epitopes were predicted by Discotope server (Table 3). By using the constructed 3D models we also predicted the MHC super type A1 epitopes. The most likely predicted MHC epitopes in EDIIIF protein were GTVLVQVKY, AAAKKGMSY, GTIVIRVQY, AAAKKGMSY, CTNTFVLKK, VSETQHGTI, GTILIKVEY, AAAKKGMSY, and GTTVVKVKY.
Bioinformatics analysis of the optimized synthetic gene
A synthetic sequence encoding the EDIIIF protein was designed using E. coli codon usage. The coding sequence was analyzed for codon usage and GC content by online Optimizer software. This optimization is reflected by the codon adaptation index (CAI). The CAI is a useful measure for evaluation of the relative adaptiveness of desired sequences with the sequence of highly expressed genes in the same host. The optimized gene (edIIIf) showed a CAI of 1.0, compared to the primary deduced gene, which was only 0.7. The GC content of this sequence optimized on about 52%, which is appropriate for efficient expression in E. coli host. Furthermore, the necessary restriction enzyme sequence sites (NdeI and XhoI) were introduced at the ends of the coding sequence for cloning purposes.
Finally, secondary structure of corresponding mRNA for edIIIf gene was predicted. As the folding pattern of mRNA is very important factor affecting translation efficiency, we used the mFold web based software, in order to determine the potential folding pattern of mRNA. The minimum free energy for secondary structure formed by mRNA molecule was also predicted (dG=-17.12). The results of this prediction showed enough stability of mRNA for efficient translation in bacterial host.
Discussion
In silico analysis of vaccine candidates is a useful approach for rational design of chimeric vaccines [16]. Bioinformatics tools for predicting antigenic properties and candidate vaccines analysis are now a standard approach. Rational design of vaccines and in silico analysis, combined with in vitro and in vivo verification, accelerate the vaccine discovery process by approximately 10-20 fold. Several bioinformatics software and servers are available that can help in the process for designing of chimeric vaccine design [17].
The minimalistic approach for dengue vaccine comes from the observations that EDIII based vaccines could induce virus neutralizing antibodies which were preventive for virus infection [9]. In the diagnostic context, it has been proposed that recombinant EDIII peptides containing virus-specific epitopes could be used for specific serological diagnosis of infections [18]. Recently, we reported immunogenicity of a recombinant EDIII protein from dengue virus type-3 in mice [19]. On the base of these studies, we conclude that the designed recombinant fusion protein also can be used for serologic diagnosis of dengue viruses from other flaviviruses.
Bioinformatics approach used for rational design of recombinant EDIIIF protein as a multivalent vaccine candidate, and the corresponding synthetic gene was optimized for appropriate protein expression, considering the codon usage and GC content of the expression host genome. Since the efficiency of heterologous protein production can be diminished by biased codon usage [20], the synthetic DNA fragment encoding the EDIIIF protein was constructed based on the codon usage table of E. coli. This index was increased from 0.75 in the primary sequence to 0.98 in designed synthetic gene. Furthermore, the percentage and distribution of GC in the coding gene were adjusted on 52%.
In the protein structure prediction, the EDIIIF protein models formed four domains that are separated by three main α-helix structures. In the 3D models of protein the three α-helix structures are related to the repeated EAAAK residues (104-123, 227-246, and 350-369), which are inserted between EDIII domains. The α-helix structures provide independent conformation possibility for all four domains without any interaction and by minimal steric hindrance between domains [21]. With these results we could expect that these α-helical parts could support the stable structure of protein. B-cell epitopes for the fusion protein could be predicted on the basis of the structural predictions and solvent accessibility. Several methods based on accessibility, hydrophilicity, flexibility, antigenicity, and secondary structure of proteins have been developed [22]. The integrated results based on different parameters showed that the most likely B-cell epitopes of this fusion protein were located in four distinct domains selected as the EDIII1, EDIII2, EDIII3, and EDIII4.
In conclusion, our results from bioinformatics analysis of the designed tetravalent EDIIIF, as a model, showed the feasibility of this approach in rational design and in silico evaluation of chimeric dengue vaccines.


 XML Download