

 PDF
PDF ePub
ePub Citation
 Print
Print


Introduction
According to the data of the Economic Statistics System of the Bank of Korea [1], the population in South Korea was 49,779 thousand, gross national income (GNI) was 1,240.5 trillion KRW, and GNI per person was 24,920 thousand KRW in 2011.
The Bank of Korea [1] and Korea Pharmaceutical Manufacturers Association [2] showed that regarding pharmaceutical companies in domestic industries in 2009, gross domestic product (GDP) was 10,63 trillion KRW and manufacturer GDP is 2.657 trillion KRW. The amount of gross drug production in Korea (everything below: completed+drug substances, quasi-drugs excluded) was 15 trillion 819.6 billion KRW which took 1.49% of total GDP and 5.95% of manufacture GDP.
With regard to the production output in the medium classification of major complete preparated drugs on a year-on-year basis, vaccines are important production functional agents, ranking itself in the 10th place in the small classification [3]. More specifically, annual vaccine production output/the amount of production of gross complete preparated drugs were 227.0/11,415.0 in 2007, 309.6/12,496.9 in 2008, 537.6/13,176.0 in 2009, 596.1/14,040.8 in 2010, 392.2/13,880.8 in 2011, respectively (unit: billion KRW) [3]. The annual growth of vaccine production output from 2007 to 2011 was 5.9%. Domestic vaccine production output between 2009 and 2010 was higher than that in 2007, 2008, and 2011. Most currently, vaccine production output in 2011 was 392.2 billion KRW, indicating 2.83% of completed drug production output and 13 trillion 880.8 billion KRW [3].
In other words, vaccines are not only identified as one of the most important items but also judged as items with the possibility of future development. Therefore, it is necessary to identify the overall economic scale of vaccines in the past five years in Korea, which can be an important indicator that provides background information in practical use.
This study tried to build basic information related to future production and sales of human vaccines in Korea by conducting research: 1) among domestic industries, with respect to the scale and trend of the drug production industry market produced by pharmaceutical industries in Korea, 2) on the portion of human vaccines, the amount of vaccine production, and the marketing scale of the actual output by the functional agent in the middle classification, 3) on sales of each major item of vaccines, 4) on the current situation of vaccine industry growth by sales of each treatment fields, and 5) on the portion of market and development situations of vaccines depending on its products.
Materials and Methods
Information about the national population in Korea, GNI, and GDP was obtained from the Economic Statistics System of the Bank of Korea [1]. Market situation of the drug industry, actual output of non-prescription and prescription drugs (current situation), actual output by drug industry classification, complete preparated drug records by drug industry functional agent, production output by functional agent in the medium classification (current situation), and the number of items of medical-pharmaceutical industry complete preparated drugs (non-prescription and prescription) were identified based on the statistical data from the 2012 Korea Pharmaceutical Industry Survey Report and Korea Health Industry Statistics System (KHISS) provided by Korea Health Industry Development Institute (KHIDI) [3,4], 2012 drug industry analysis report (published in December 2012) by KHIDI, domestic pharmaceutical industry statistics published by Korea Pharmaceutical Manufacturers Association [2], the actual exports of drugs from Korea Pharmaceutical Traders Association [5], etc. Information including the domestic market scale of vaccines, trade balance of vaccines, market portion and development situations depending on vaccine products, domestic major vaccine production companies, etc. were obtained from the monthly report, "Health Industry Trend" published by KHIDI [6]. Additionally, Newsletter for the National Immunization Program of Korea Centers for Disease Control and Prevention [7] provided information related to the current situation of essential vaccines in Korea.
Results
Drug industry trend (current situation) in Korea
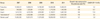
Table 1 shows the trend in the medical-pharmaceutical industry in Korea [2-6]. The whole market scale (production+import-export) was 15 trillion 62.1 billion in 2007, 16 trillion 957.7 billion in 2008, 17 trillion 970 billion in 2009, 18 trillion 908.4 billion in 2010, and 18 trillion 943.8 billion in 2011(unit: KRW). There was a 0.2% growth in 2011 compared to the previous year, and the annual average growth rate was 5.9% from 2007 to 2011. The annual average growth rate of the trade balance (import-export) was 9.2% from 2007 to 2011. The exchange rate about export and import was applied according to the year-on-year annual average basic exchange rate of the Bank of Korea [1].
The annual medical-pharmaceutical production output was 12 trillion 598.2 billion in 2007, 13 trillion 893.8 billion in 2008, 14 trillion 788.4 billion in 2009, 15 trillion 569.6 billion in 2010, and 15 trillion 440.3 billion in 2011 (unit: KRW). Drug production output decreased by 0.8% in 2011 compared to the previous year, and the annual average growth increased by 5.2% from 2007 to 2011. There was a continuous increasing trend after 2000, but it first decreased in 2011.
Actual output of the medical-pharmaceutical product industry by classification (production output)
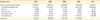
Regarding the medical-pharmaceutical product industry market scale and current situations in Korea mentioned earlier, the actual output of the medical-pharmaceutical product industry depending on the classification is shown in Table 2 [2,3]. Drugs included complete preparated drugs, narcotics, ultra-narcotics, psychotropic drugs, and drug substances, but quasi-drugs were excluded. The annual production output of medical-pharmaceutical products was 12 trillion 598.2 billion in 2007, 13 trillion 893.8 billion in 2008, 14 trillion 788.4 billion in 2009, 15 trillion 569.6 billion in 2010, and 15 trillion 440.3 billion in 2011 (unit: KRW). Table 2 shows the production output of complete preparated drugs, narcotics, ultra-narcotics, psychotropic drugs, and drug substances among all medical-pharmaceutical products. The production output of quasi-drugs was 835 billion in 2007, 856.6 billion in 2008, 1 trillion 31.3 billion in 2009, and 1 trillion 155.9 billion in 2010 (unit: KRW).
Production of prescription drugs
When complete preparated drugs were divided into non-prescription drugs and prescription drugs in 2011, the number of prescription drugs was 9,704 and these drugs produced 11 trillion 329 billion KRW; this showed that the number of items increased by 3.7%, but the production output decreased by 1.6%. While the portion of prescription drugs increased annually from 76.8% in 2007 to 82.0% in 2010, it showed 81.6% in 2011 decreasing by 0.4% compared to the previous year. Although the portion of the produced prescription drugs decreased compared to the previous year, it still had a high percentage of more than 80% (Table 3) [2,3].
Market scale of vaccines in Korea (estimates of Korea Centers for Disease Control and Prevention)
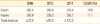
The market scale of vaccines based on the estimates of Korea Centers for Disease Control and Preventions was about 710 billion in 2011 and showed an annual average growth of 11% in the past 6 years. This was equivalent to about 2% of the vaccine market in the world (Table 4) [6,7]. In the portion of the amount of essential vaccines, the rate decreased from 68% in 2006 to 44% in 2011, but the amount of market scale increased from 289.1 billion KRW in 2006 to 308.9 billion in 2011, and the annual average growth rate was 1%. On the other hand, the rate of other vaccines increased from 32% in 2006 to 56% in 2011; the expenses also clearly increased from 133.9 billion KRW in 2006 to 399.8 billion in 2011, and the annual average growth rate was 24%. Therefore, in about 710 billion KRW of the vaccines market scale in Korea, the expenses of essential:other vaccines were 308.9 billion KRW:399.8 billion KRW (44%:56%), meaning that the market scale of other vaccines was higher than that of essential vaccines.
Portion of production output and vaccines of complete preparated drug in high ranking functional agents (in small classification)
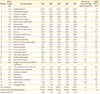
The production output of complete preparated drugs in high ranking functional agents is shown in Table 5 [2,3]. The upper 30 functional agents comprised 81.4% of the production output of complete preparated drugs. Vaccines (Classification number 631) were ranked 10th among the top 30 functional agents, and the production output was 227 in 2007, 309.6 in 2008, 537.6 in 2009, 596.1 in 2010, and 392.2 in 2011 (unit: billion KRW). The five year average growth rate was 14.7%. The reason for this significant increase in 2009 and 2010 came from the occurrence of epidemic diseases in Korea in the same years. The growth rate in 2011 was -34.2% compared to the previous year.
In 2011, the production output of vaccines was 392.2 billion which was 2.83% of the complete preparated drug production output, 13 trillion 880.8 billion which was 2.54% of the drug production output, and 15 trillion 440.3 billion (unit: KRW) (Table 5).
Market portion by vaccine products in 2011
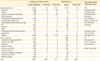
The size of the Korean vaccine market is classified as vaccines included in national immunization program (13 kinds) and other preventive vaccines. Subcategories such as amount of vaccine supply (production+import), market portion, standard amount (production cost, import cost) and market portion are shown in Table 6 [6].
In the supply (production+import) scale of vaccines market scale by products in Korea in 2011, among 13 essential vaccines, hepatitis B was 399.8 billion, varicella was 68.6 billion, Japanese encephalitis (inactivated) was 163.2 billion, intradermal Bacillus Calmette-Guérin (BCG) was 3.7 billion, diphtheria, tetanus and pertusiss (DTaP) was 246.3 billion, adult diphtheria/tetanus (Td) was 53.6 billion, adult diphtheria/tetanus (Tdap) was 15.1 billion, inactivated poliovirus vaccine was 152.1 billion, DTap-inactivated poliovirus vaccine was 33.2 billion, measles, mumps, rubella (MMR) was 120.5 billion, hemorrhagic fever with renal syndrome was 62.1 billion, typhoid fever was 16.4 billion, and influenza was 2.04 trillion. Regarding the other 10 types of vaccinations, Hemophilus influezae type B (Hib) was 151.7 billion, pneumococcal conjugate vaccine was 169.2 billion, rotavirus was 79.8 billion, hepatitis A (child) was 132.6 billion, human papillomavirus vaccine was 135.5 billion, percutaneous BCG was 18 billion, Japanese B encephalitis (live, activated) was 32 billion, pneumococcal polysaccharide vaccine was 49.4 billion, and hepatitis A (adult) was 109.4 billion (unit: KRW).
Trade balance of vaccine types in Korea
The domestic vaccines market has been led by expensive imported vaccines such as human papillomavirus vaccine, pneumococcal vaccine, and other expensive preventive-vaccines. Although the portion of other preventive-vaccines was only 20% in the entire vaccines market, it accounted for 56% of the total amount, and the growth rate of preventive-vaccines from 2006 to 2011 showed a 24% increase in the national qualification amount. On the other hand, while the portion of essential vaccines is 80% of the entire vaccine usage, it accounted for 44% of the total amount, and the annual average growth rate was only 1%. Accordingly, the vaccine trade deficit was approximately -$90 million in 2010 and then increased to approximately -$120 million in 2011 (Table 8) [6].
Vaccine development in Korea
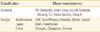
Currently, SK Chemicals, Green Cross, LG Life Sciences, Boryeong Biopharma, etc. have led the development of vaccines in Korea. and Il-Yang Pharm.Co., Ltd., and Chong Kun Dang Pharmaceutical Corps. are also participating in the vaccine development (Table 6) [6]. However, the investment in research and development is 61 billion KRW/yr, which is significantly low investment, compared to the average investment (160-650 billion KRW) of the premium vaccine development of multinational pharmaceutical companies on average. It is crucial to make systematic and expanded supports because vaccine development is sporadically supported by multiple government departments.
Discussion
In 2011, the production output of medical-pharmaceutical products was 15 trillion 440.3 billion KRW, and the market scale was 18 trillion 908.4 billion. The production output change by year increased by 5.9% from 2007 to 2011. In the portion of pharmaceutical industries among domestic industries in 2009, gross domestic product (GDP) was 10.63 trillion KRW, and manufacturer GDP was 2.657 trillion KRW; the amount of gross medical-pharmaceutical production in Korea (everything below: completed+drug substances, quasi-drugs excluded) was 15 trillion 819.6 billion KRW which comprise 1.49% of total GDP and 5.95% of manufacturing GDP [2-6].
The production output of complete preparated drugs was 13 trillion 880.8 billion in 2011. When dividing complete preparated drugs into non-prescription drugs and prescription drugs, the production output of non-prescription drugs was 2 trillion 552 billion and the production output of prescription drugs was 11 trillion 329 billion in 2011 [2,3].
The upper 30 functional agents (in a small classification) were 81.4% of the production output of complete preparated drugs. Vaccines (Classification number 631) were ranked 10th among the top 30 functional agents, and the production output was 227 in 2007, 309.6 in 2008, 537.6 in 2009, 596.1 in 2010, and 392.2 in 2011 (unit: billion KRW). The five year average growth rate was 14.7%. Vaccine production output in 2011 was 392.2 billion KRW, comprising a preparated drug production output of 2.83%, (13 trillion 880.8 billion KRW) and a medical-pharmaceutical product output of 2.54% (15 trillion 440.3 billion KRW) [2,3].
The market scale of vaccines in Korea was 710 billion in 2011, indicating an annual average growth rate of 11% in the past 6 years. This also indicates about 2% of the vaccine market throughout the world. There was a significant increase in which the market scale of essential vaccines was 308.9 billion in 2011 and the cost of other vaccines was 399.8 billion in 2011 [6,7].
The domestic vaccine market has been led by expensive imported vaccines such as human papillomavirus vaccine and pneumococcal vaccine as well as other expensive preventive-vaccines. Although the portion of other preventive-vaccines was only 20% in the entire vaccine market, it accounted for 56% of the total amount, and the growth rate of preventive-vaccines from 2006 to 2011 was 24% of the national qualification amount. The vaccine trade deficit in 2011 increased to approximately $120 million. Investment in research and development is in a significantly low level at 61 billion KRW/yr, compared to the average investment (160-650 billion KRW) of the premium vaccine development of multinational pharmaceutical companies [6].
Park [6], who analyzed the reality of Korea above, suggested that 1) safety enhancement of citizens through establishment of vaccine independency, 2) decrease of medical cost and consolidation of health insurance finance through preventive vaccination, 3) developing high value added vaccine industry, and 4) therapeutic vaccines armed with new high technology [6]. There are four factors that should be overcome by the Korea vaccine industry: 1) Improvement of domestic market reduction because of low birthrate and high dependence on imports, 2) development of technology improvement which leads to an increase of essential preventive vaccination value and premium vaccine improvement which is currently insufficient and has a limited value of creation, 3) industrialization and globalization of vaccines to overcome insufficient investment caused by the small scale of the domestic market while high cost and long time are required to develop them, and 4) strategic plan for consumers with the help of World Health Organization (WHO), Global Alliance for Vaccines and Immunization (GAVI), and International Vaccine Fund enter the global market [6]. The vaccine industry is becoming an emerging attractive industry. There are four opportunity factors. 1) vaccines have less failure and require less cost than synthetic drugs in the field of drug development and have more chances to enter the global market, 2) the global vaccine market scale is expanding in quantity, 3) as a new concept, the clinic oriented vaccines are growing in development and in the market, 4) there is an improvement of value added vaccines development techniques with contemporary growth of biomedicines and technical progress of biotechnology/nanotechnology and so on [6].
In conclusion, the scale of the pharmaceutical industry in Korea and the vaccine product output and portion in the industry were described. Vaccines have a significant portion as the 10th ranked drug in the classification of whole complete preparated drugs. Also, vaccines classified by each item were observed in market scale in terms of essential and general preventive vaccines. This observation presented the basic data about the production of vaccine items and market scale and the future direction for the vaccine industry in Korea. Based on the current analysis and the direction of future improvement, further development towards a better vaccine industry is expected in Korea.


 XML Download