

 PDF
PDF ePub
ePub Citation
 Print
Print


Introduction
Biology is an integrated study, which aimed to discover the various mechanisms in complex network. Although conventional experiments based on biochemical experiment can suggest 'clue' of individual mechanism in certain condition, but they restricted to reveal the 'real' phenomenon in whole cell or organism level. Molecular imaging is a powerful tool to discover various biological mechanisms, providing temporal and spatial information of cell and organism level [1,2]. The spatio-temporal analysis could provide the more exact mechanism in complex and changeable system, living organism. As researches become more complex with our knowledge of biological system, the role of molecular imaging are more increasing.
Infectious disease is one of the required fields with molecular imaging. Infection is complex process in whole organism related with various molecules in pathogens and host. As the biological effects of pathogen and immunological responses of host are varies at each time course and each organ [3], study of infectious disease requires analysis with various conditions. In conventional analysis with animal experiment as host system, enormous labor, time and animals are needed with long time-consuming experiment at separated time point. But, molecular imaging analysis which can chase the pathogens in organism level, pathogen can overcome the limitation of conventional analysis and biological and pathological process and be monitored. In recent study, it was discovered that bubonic plaque is colonized at lymph node first, and disseminated at liver and spleen by visualization of bioluminescence Yersinia pestis [4]. In similar analysis system, the primary germination site of Bacillus anthracis spore in organism was revealed as lung [5].
Vaccine is one of the ideal solutions against infectious disease. In order to develop efficient vaccine, efficacy evaluation methods with high accuracy are required. In conventional method for efficacy evaluation of vaccine have been dependent on detection of immunoglobulin for specific antigens or observation of animal lethality [3,6]. But, the former cannot provide direct efficacy against disease, the latter requires a lot of labors and animals. In vaccine efficacy evaluation, visualization of pathogens in whole organism at each time point would be able to reduce the consuming animals and provide the in vivo information within consistent background with identical organism.
In this study, we verified the application of in vivo molecular imaging system as vaccine efficacy evaluation method using fluorescent Escherichia coli, and suggest that the possibility of novel method for vaccine evaluation system.
Materials and Methods
Bacterial strain and growth condition
E. coli-green fluorescent protein (E. coli-GFP) strain MC1061 with GFP expression plasmid obtained from Korea National Institute of Health (KNIH; Osong, Korea). E. coli-GFP was cultured in Luria Bertani broth (Invitrogen, Carlsbad, CA, USA) in 37℃. One hundred µg/mL ampicilin (Invitrogen) was used as antibiotics to selection of bacteria containing GFP expression plasmid.
Whole-animal fluorescent imaging
Five to six weeks old of female BALB/c mice were purchased and used in bacteria injection experiment. All experiments were accomplished under the provision of KNIH Institutional Animal Care and Use Committee. E. coli-GFP was injected with intradermal (i.d.) of intraperitoneal (i.p.) route to BALB/c mice and injected mice were analyzed with IVIS spectrum whole live-animal imaging system (Perkin Elmer Inc., Waltham, MA, USA). Mice were anesthetized with isoflurane using a vaporizer, and fluorescent image was obtained GFP filter set (excitation wave length, 488 nm; emission wave length, 510 nm).
Results
Fluorescent signal was increased by bacterial replication
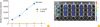
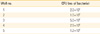
Compared to wild type E. coli strain, fluorescent intensity was increased proportionately by concentrating E. coli MC1061 strain which expresses GFP (E. coli-GFP), which suggest quantified fluorescent intensity can indicate the number of bacteria (Table 1, Fig. 1A). Fluorescent signal of E. coli-GFP was visualized by IVIS spectrum analysis and signal intensity could be represented by pseudo-color distribution (Table 1, Fig. 1B). Increasing of fluorescent signals was matched with the number of bacteria measured by optical density at 600 nm.
Injected bacteria was traced by fluorescent signal on the molecular imaging system
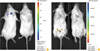
Visualizing of bacteria which reside inside of whole animal is most essential factor for in vivo live imaging. After confirmation of fluorescent signal increased by bacterial replication, GFP-tagged strain was injected at different colony-forming unit (CFU) through the various routes and the fluorescent signal was measured. To verify the possibility of applying fluorescence expressing pathogen to in vivo monitoring system of pathogen infection, we injected E. coli-GFP to mice with i.d. and i.p. route (Fig. 2). Over 109 CFU, injected E. coli-GFP in both cased was clearly visualized in IVIS analysis system, suggesting fluorescent signal can be pass through skin of animal and be detected. Although auto-fluorescent signal from naïve animal was strong, high intensity of fluorescent signal from E. coli-GFP was distinguishable and can be normalized with background signal.
Visualizing disseminated pathogen showed different signals in each organ
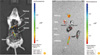
Infected pathogen can disseminated to several organs in animal, and targeting of pathogen toward specific organ is related with pathogenic disease. So, investigation of disseminated localization of pathogen is important to study of disease and also evaluation of vaccine efficacy. In anatomical condition, each organ which directly injected with E. coli-GFP was visualized by IVIS analysis system (Fig. 3A). Detached organ showed more obvious fluorescent signal, and intestine showed strongest fluorescent signal (Fig. 3B). This seems to be due to its cavity structure that could contain bacteria. Organ of infectious situation, which provide the condition of bacterial infiltration to cells of organ, would be represented with more obvious and strong signal.
Discussion
Vaccine efficacy is usually tested using IgG titer after vaccination or protection assay with animals. Of course those methods are very effective to confirm the efficacy and safety for newly developed vaccine candidates and currently available vaccines on the improvement. However we still can't get further information about the distribution and clearance of infected pathogens after vaccination. To fill the gap of information about the works of vaccines, in vivo imaging using GFP-conjugated pathogens can be applied for pathogen tracing and immune cell trafficking.
Injected bacteria was clearly distinguished organ by organ presumably representing bacterial replication levels or integrated bacterial number in each organ (Fig. 3). It was clear that fluorescence-tagged bacterial strain was replicated both on the culture plates and in the animals (Figs. 1, 3), however, in vivo tracing was not completely possible only with fluorescence-tagging on the current in vivo imaging apparatus due to the penetration capacity of fluorescence and the intensity of current fluorescence-tagging molecules [9].
There are several limits to use the GFP-conjugated bacteria to trace the pathogen distribution and clearance. First of all, GFP signals are usually not strong enough to be analyzed on currently available in vivo imaging systems, luciferase or other stronger signals could be considered for better signal tracing for infected pathogens [10,11]. Even though autofluorescence from animal body itself can be normalized using imaging software, still fluorescence signal seems not enough to show the track and localization of infected bacteria or other pathogens in each organ. Second, the sensitivity of fluorescence is not high enough to detect small number of infected pathogens, especially for chronic infection diseases without exponential replication such as acquired immunodeficiency syndrome or tuberculosis. Visualization of signal-tagged pathogens can be traced and measured after several multiplications in animal body, but the quick multiplication of infected pathogens cannot be expected in chronic infectious diseases. This low multiplicity of infection in chronic infection could be another limit for pathogen tracing in infected animals.
Even though these several limits, the visualizing methods using signal-tagged pathogens can be a good model system to enforce the efficacy tests of vaccines or new drug candidates because it can supply related information about the pathogen localization and distribution after infection, also about the pathogen clearance in each targeted organ [12-15]. With more strong visualizing signals such as luciferase or optical nanomolecules, the molecular imaging methods for pathogen tracing and clearance could be a highly confident way to evaluate the vaccine efficacy in the future.
 XML Download