

 PDF
PDF ePub
ePub Citation
 Print
Print


Geon Ju Kim1, Yu Mi Park1, Sul Mui Won1, Seung Jun Choi2 , Hwan Soo Kim1, Yoon Hong Chun1, Jong-Seo Yoon1, Hyun Hee Kim1, Jin Tack Kim1
, Hwan Soo Kim1, Yoon Hong Chun1, Jong-Seo Yoon1, Hyun Hee Kim1, Jin Tack Kim1
Abstract
Purpose
Acute lower respiratory infection (ALRI), which is frequently encountered in pediatric patients, is the leading cause of hospitalization. We aimed to identify particular cytokines that correlated with ALRI clinical characteristics. We also aimed to identify any differences in cytokines between respiratory syncytial virus (RSV)-related ALRI and non-RSV-related ALRI.
Methods
Cytokine levels were measured in the sera sampled from 103 pediatric patients diagnosed with ALRI and admitted to Seoul St. Mary's Hospital between May 2012 and April 2013. The correlations between cytokine levels and the length of hospitalization, the number of days with fever, body temperature, pulse rate, respiration rate, oxygen saturation upon admission, and duration of oxygen supplementation were analyzed.
Results
In children with ALRI, the level of interleukin (IL)-6, granulocyte-colony stimulating factor (G-CSF), and IL-10 were correlated with a higher body temperature on admission. In addition, the IL-8 level was correlated with pulse rate and respiration rate, and IL-1β level was related with oxygen saturation on admission. In children with RSV-related ALRI, the IL-6 was correlated the with duration of fever, and the IL-1β, IL-2, and IL-8 levels were related to pulse rate and respiration rate. In addition, the increase in interferon-gamma-inducible protein-10 (IP-10) level was correlated with a higher body temperature on admission and a longer duration of hospitalization in children with RSV-related ALRI.
Figures and Tables
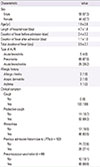
Table 1
Demographic and clinical characteristics of patients (n=103)
![]()
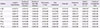
Table 2
Correlation between cytokines and clinical manifestations (n=103)
![]()
Table 3
Correlation between cytokines and clinical manifestations in virus other than RSV infection (n=59)
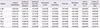
Values are presented as spearman correlation coefficient (P-value). Seven of patients affected virus other than RSV are checked initial O2 saturation.
RSV, respiratory syncytial virus; IL, interleukin; G-CSF, granulocyte-colony stimulating factor; IFN, interferon; IP-10, interferon-gamma-inducible protein-10; TNF, tumor necrosis factor.
*P<0.05.
![]()
Table 4
Correlation between cytokines and clinical manifestations (RSV infection: n=44)
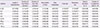
Values are presented as spearman correlation coefficient (P-value). Four of patients affected RSV virus are checked initial O2 saturation.
RSV, respiratory syncytial virus; IL, interleukin; G-CSF, granulocyte-colony stimulating factor; IFN, interferon; IP-10, interferon-gamma-inducible protein-10; TNF, tumor necrosis factor.
*P<0.05.
![]()
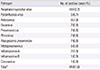
Table 5
Acute lower respiratory tract infection pathogens (n=103)
![]()
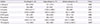
Table 6
Correlation between cytokines and number of pathogens
![]()
References
1. Grijalva CG, Nuorti JP, Arbogast PG, Martin SW, Edwards KM, Griffin MR. Decline in pneumonia admissions after routine childhood immunisation with pneumococcal conjugate vaccine in the USA: a time-series analysis. Lancet. 2007; 369:1179–1186.

2. Sinaniotis CA. Viral pneumoniae in children: incidence and aetiology. Paediatr Respir Rev. 2004; 5:Suppl A. S197–S200.
3. Wolf J, Daley AJ. Microbiological aspects of bacterial lower respiratory tract illness in children: atypical pathogens. Paediatr Respir Rev. 2007; 8:212–219.
4. Montón C, Torres A, El-Ebiary M, Filella X, Xaubet A, de la Bellacasa JP. Cytokine expression in severe pneumonia: a bronchoalveolar lavage study. Crit Care Med. 1999; 27:1745–1753.
5. Antunes G, Evans SA, Lordan JL, Frew AJ. Systemic cytokine levels in community-acquired pneumonia and their association with disease severity. Eur Respir J. 2002; 20:990–995.
6. Puren AJ, Feldman C, Savage N, Becker PJ, Smith C. Patterns of cytokine expression in community-acquired pneumonia. Chest. 1995; 107:1342–1349.
7. Glynn P, Coakley R, Kilgallen I, Murphy N, O'Neill S. Circulating interleukin 6 and interleukin 10 in community acquired pneumonia. Thorax. 1999; 54:51–55.
8. Kellum JA, Kong L, Fink MP, Weissfeld LA, Yealy DM, Pinsky MR, et al. Understanding the inflammatory cytokine response in pneumonia and sepsis: results of the Genetic and Inflammatory Markers of Sepsis (GenIMS) Study. Arch Intern Med. 2007; 167:1655–1663.
9. Kingsley SM, Bhat BV. Differential Paradigms in Animal Models of Sepsis. Curr Infect Dis Rep. 2016; 18:26.
10. Bennett BL, Garofalo RP, Cron SG, Hosakote YM, Atmar RL, Macias CG, et al. Immunopathogenesis of respiratory syncytial virus bronchiolitis. J Infect Dis. 2007; 195:1532–1540.
11. Hirose Y, Hamada H, Wakui T, Ogawa T, Terai M. Characteristic systemic cytokine responses in children with human bocavirus-positive lower respiratory tract infection. Microbiol Immunol. 2014; 58:215–218.
12. Palomino DC, Marti LC. Chemokines and immunity. Einstein (Sao Paulo). 2015; 13:469–473.
13. Brand HK, Ferwerda G, Preijers F, de Groot R, Neeleman C, Staal FJ, et al. CD4+ T-cell counts and interleukin-8 and CCL-5 plasma concentrations discriminate disease severity in children with RSV infection. Pediatr Res. 2013; 73:187–193.
14. Yu JM, Meng ZY, Dou GF. Recent advances in research on granulocyte colony-stimulating factor--review. Zhongguo Shi Yan Xue Ye Xue Za Zhi. 2008; 16:452–456.
15. Kim CK, Callaway Z, Koh YY, Kim SH, Fujisawa T. Airway IFN-γ production during RSV bronchiolitis is associated with eosinophilic inflammation. Lung. 2012; 190:183–188.
16. Petrone L, Cannas A, Aloi F, Nsubuga M, Sserumkuma J, Nazziwa RA, et al. Blood or Urine IP-10 Cannot Discriminate between Active Tuberculosis and Respiratory Diseases Different from Tuberculosis in Children. Biomed Res Int. 2015; 2015:589471.
17. Sumino KC, Walter MJ, Mikols CL, Thompson SA, Gaudreault-Keener M, Arens MQ, et al. Detection of respiratory viruses and the associated chemokine responses in serious acute respiratory illness. Thorax. 2010; 65:639–644.
18. Luo H, Wang D, Che HL, Zhao Y, Jin H. Pathological observations of lung inflammation after administration of IP-10 in influenza virus- and respiratory syncytial virus-infected mice. Exp Ther Med. 2012; 3:76–79.
19. Roe MF, Bloxham DM, Cowburn AS, O'Donnell DR. Changes in helper lymphocyte chemokine receptor expression and elevation of IP-10 during acute respiratory syncytial virus infection in infants. Pediatr Allergy Immunol. 2011; 22:229–234.
20. Fernández-Serrano S, Dorca J, Coromines M, Carratalà J, Gudiol F, Manresa F. Molecular inflammatory responses measured in blood of patients with severe community-acquired pneumonia. Clin Diagn Lab Immunol. 2003; 10:813–820.
 XML Download