Abstract
Purpose
Methods
Results
REFERENCES
 | Fig. 1.Number of study subjects who underwent that bronchial provocation tests in atopic asthma group (n=83) (A) and nonaopic asthma group (n=27) (B). |
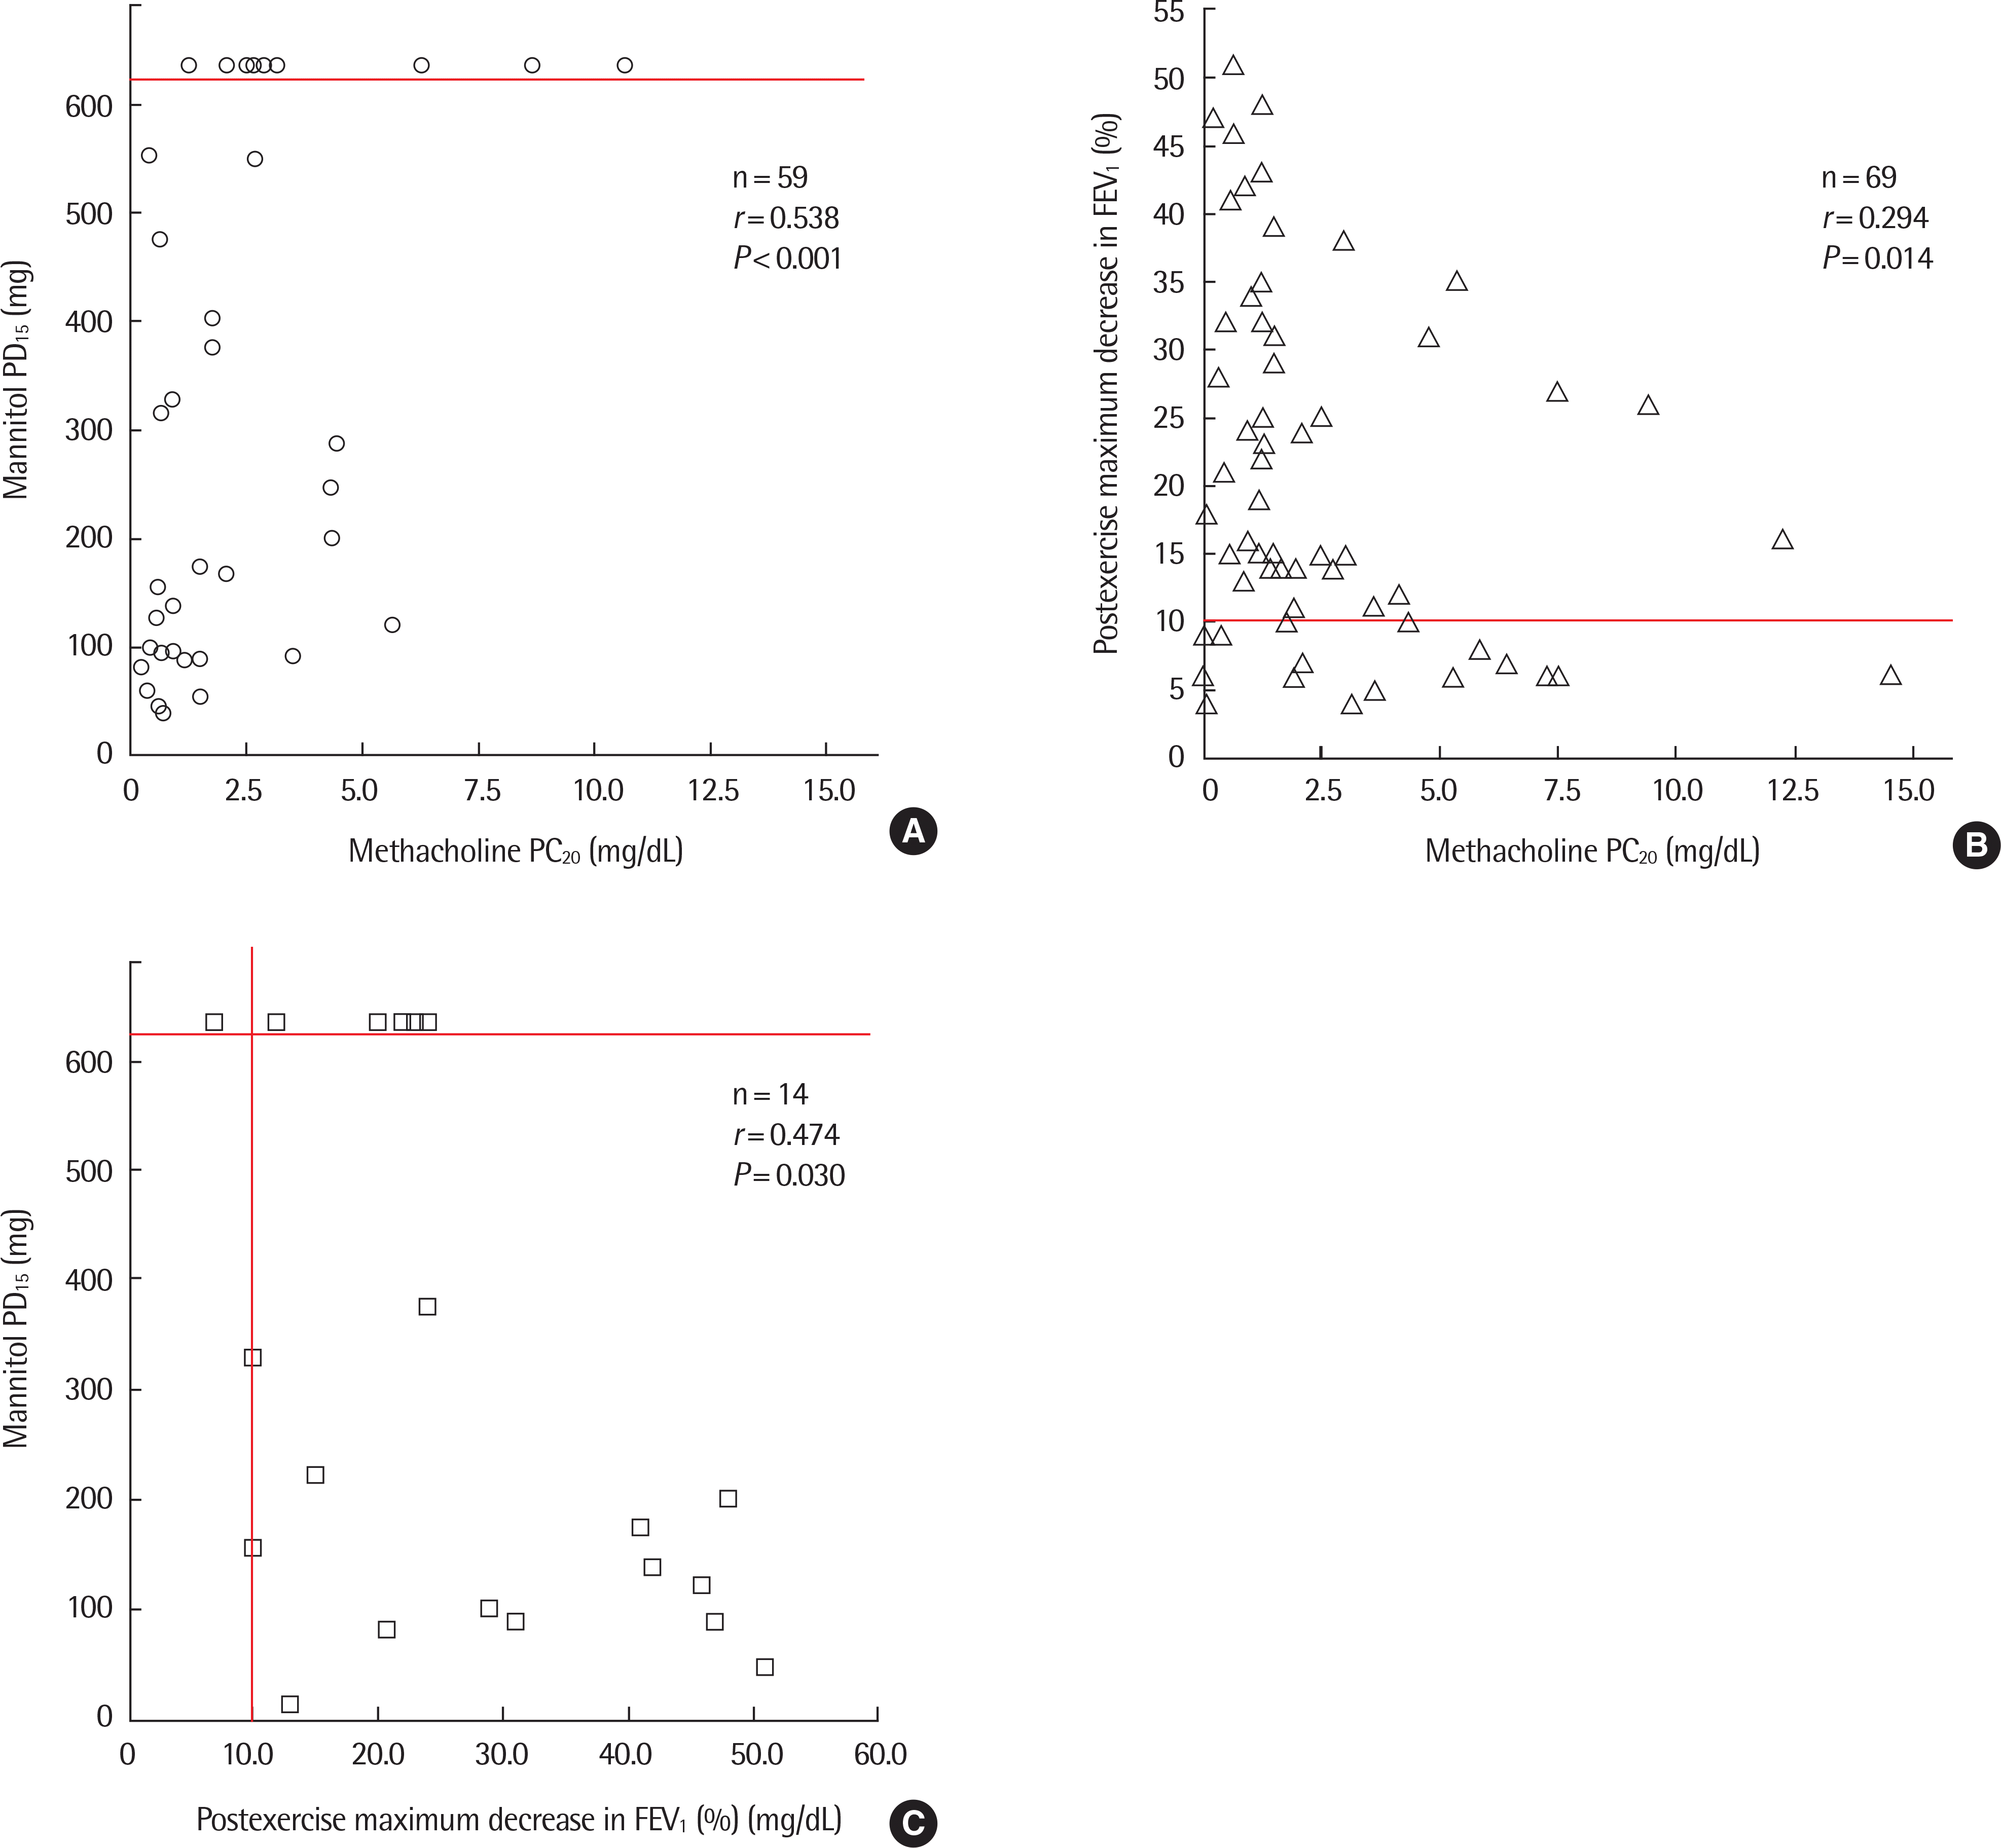
 | Fig. 2.Correlations between mannitol PD15, postexercise maximum decrease in FEV1, and methacholine PC20. The manntiol challenge was completed when a ≥15% fall in FEV1 from baseline occurred, which was considered to be a positive response, or when the maximum cumulative dose of mannitol (635 mg) was administered. An exercise bronchoprovocation test was used for EIB diagnosis, which was considered positive with a 10% or greater decrease in FEV1 after exercise. (A) Mannitol PD15 was significantly correlated with methacholine PC20 in asthmatic subjects (n=59, r=0.538, P<0.001). (B) Postexercise maximum decrease in FEV1 in asthmatic subjects was significantly correlated with methacholine PC20 in asthmatic subjects (n=69, r=-0.294, P=0.014). (C) Postexercise maximum decrease in FEV1 was significantly correlated with mannitol PD15 in asthmatic subjects (n=14, r=-0.474, P=0.030). PD15, cumulative provocative dose causing a 15% fall in FEV1; PC20, provocative concentration of methacholine inducing a 20% fall in FEV1; FEV1, forced expiratory volume in 1 second; EIB, exercise induced bronchoconstriction. r=Spearman correlation coefficients. |
Table 1.
| Characteristic | Atopic asthma (n=83) | Nonatopic asthma (n=27 ) | P-value∗ |
|---|---|---|---|
| Age (yr) | 9.50±3.11 | 9.11±2.44 | 0.955 |
| Height (cm) | 136.50±18.95 | 138.48±18.24 | 0.274 |
| Weight (kg) | 38.52±17.33 | 39.00±14.92 | 0.424 |
| Body mass index (kg/m2) | 20.25±3.50 | 19.27±3.82 | 0.925 |
| Male sex (%) | 63.9 | 66.7 | 0.491† |
| Prior ICS use (%) | 48.2 | 44.4 | 0.463 |
| Total IgE (IU/mL) | 394.93 (192.02–597.84) | 176.78 (92.41–445.94) | 0.041 |
| PB eosinophil (/μL) | 552.5 (134.8–970.2) | 230.0 (71.78–577.78) | 0.006 |
| ECP (ng/mL) | 83.53 (19.49–147.56) | 26.55 (7.47–243.25) | 0.011 |
Table 2.
| Variable | Atopic asthma (n=83) | Nonatopic asthma (n=27) | P-value∗ |
|---|---|---|---|
| Baseline | |||
| FEV1 (pred%) | 86.00±14.44 | 88.24±12.09 | 0.168 |
| FVC (pred%) | 94.67±14.15 | 93.96±12.69 | 0.344 |
| FEV1/FVC ratio | 81.17±6.09 | 82.68±8.00 | 0.775 |
| Postbronchodilator | |||
| ∆FEV1 (pred%) | 12.00±8.32 | 10.36±7.75 | 0.905 |
| FeNO (ppb) | 33.9 (27.8–40.0) | 16.6 (9.7–23.6) | 0.036 |
| PC20 (mg/mL) | 1.24 (0.60–1.87) | 4.97 (3.47–6.47) | 0.001 |
| BHR to mannitol | 32/48 (66.7) | 11/15 (73.3) | 0.737† |
| PD15 (mg) | 161.36 (96.12–226.59) | 225.34 (169.50–281.18) | 0.590 |
| RDR (%/mg) | 0.120 (0.043–0.198) | 0.074 (0.035 –0.144) | 0.744 |
| BHR to exercise | 45/55 (81.8) | 11/18 (61.1) | 0.091† |
| Postexcercise maximum decrease in FEV1 (%) | 31.9 (22.9–40.9) | 14.0 (9.4–18.6) | 0.015 |
Values are presented as mean±standard deviation, geometric mean (95% confidence interval), or number (%).
BHR, bronchial hyperresponsiveness; FEV1, forced expiratory volume in 1 second; pred%, predicted %; FVC, forced vital capacity; FeNO, fractional exhaled nitric oxide; PC20, provocative concentration of methacholine inducing a 20% fall in FEV1; PD15, cumulative provocative dose causing a 15% fall in FEV1; RDR, response–dose ratio (% fall in FEV1/cu-mulative dose of mannitol).
Table 3.
PD15, cumulative provocative dose causing a 15% fall in FEV1; PC20, provocative concentration of methacholine inducing a 20% fall in FEV1; FEV1, forced expiratory volume in 1 second; pred%, predicted %; FVC, forced vital capacity; FeNO, fractional exhaled nitric oxide; PB, peripheral blood; ECP, eosinophilc cationic protein.


 PDF
PDF ePub
ePub Citation
 Print
Print


 XML Download