Abstract
Purpose
Serum total and specific IgE levels have been widely used to diagnose allergic disease. However, it has recently been suggested that serum total IgE does not properly reflect specific IgE. Therefore, we evaluated the clinical significance of serum total IgE in pediatric allergic disease.
Methods
This study included 633 patients who visited Kyungpook National University Children's Hospital between March 2013 and April 2015. We used immunoCAP, an inhalant multiple allergen simultaneous test (MAST), and food MAST to measure specific IgE. We used a skin prick test in some patients and measured serum total IgE, eosinophil count, and serum eosinophil cationic protein in all patients.
Results
There was a positive correlation between serum total IgE and antigen level in the inhalant immunoCAP test. Specifically, the sum of immunoCAP levels was highly correlated with serum total IgE (r=0.631, P<0.001). Moreover, there was a positive correlation between serum total IgE and the sum of food immunoCAP levels (r=0.323, P<0.001). Among the food immunoCAP antigens, milk was highly correlated with serum total IgE (r=0.558, P<0.001). There was a positive correlation between serum total IgE and the sum of class levels of inhalant/food MAST tests (r=0.709, P<0.001 and r=0.686, P<0.001, respectively). There was also a positive correlation between serum total IgE and the number of positive skin prick tests (r=0.445, P<0.001).
REFERENCES
1. Klink M, Cline MG, Halonen M, Burrows B. Problems in defining normal limits for serum IgE. J Allergy Clin Immunol. 1990; 85:440–4.

3. Orgel HA. Genetic and developmental aspects of IgE. Pediatr Clin North Am. 1975; 22:17–32.
4. Ahmed I, Nasreen S. Frequency of raised serum IgE level in childhood atopic dermatitis. J Pak Med Assoc. 2007; 57:431–4.
5. Sunyer J, Antó JM, Castellsagué J, Soriano JB, Roca J. Total serum IgE is associated with asthma independently of specific IgE levels. The Spanish Group of the European Study of Asthma. Eur Respir J. 1996; 9:1880–4.
6. Koh HS, Lee KS, Han DH, Rha YH, Choi SH. Relationship between serum total IgE, specific IgE, and peripheral blood eosinophil count according to specific allergic diseases. Allergy Asthma Respir Dis. 2013; 1:123–8.

7. Jung SW, Oh EJ, Lee J, Kim Y, Kim SY, Kim Y, et al. Usefulness of total IgE in predicting positive allergen specific IgE Tests in Korean subjects. Korean J Lab Med. 2010; 30:660–7.

8. Woo SI, Lim JS, Hahn YS. Relationship of indoor aeroallergen specific IgE with total IgE and airway hyperresponsiveness in children with atopic asthma. Pediatr Allergy Respir Dis. 2009; 19:47–55.
9. Erwin EA, Rönmark E, Wickens K, Perzanowski MS, Barry D, Lundbäck B, et al. Contribution of dust mite and cat specific IgE to total IgE: relevance to asthma prevalence. J Allergy Clin Immunol. 2007; 119:359–65.
Fig. 3.
Comparison of total IgE levels between disease groups. BA, bronchial asthma; AR, allergic rhinitis; AD, atopic dermatitis; U, urticarial; FA, food allergy; NAR, nonallergic rhinitis.
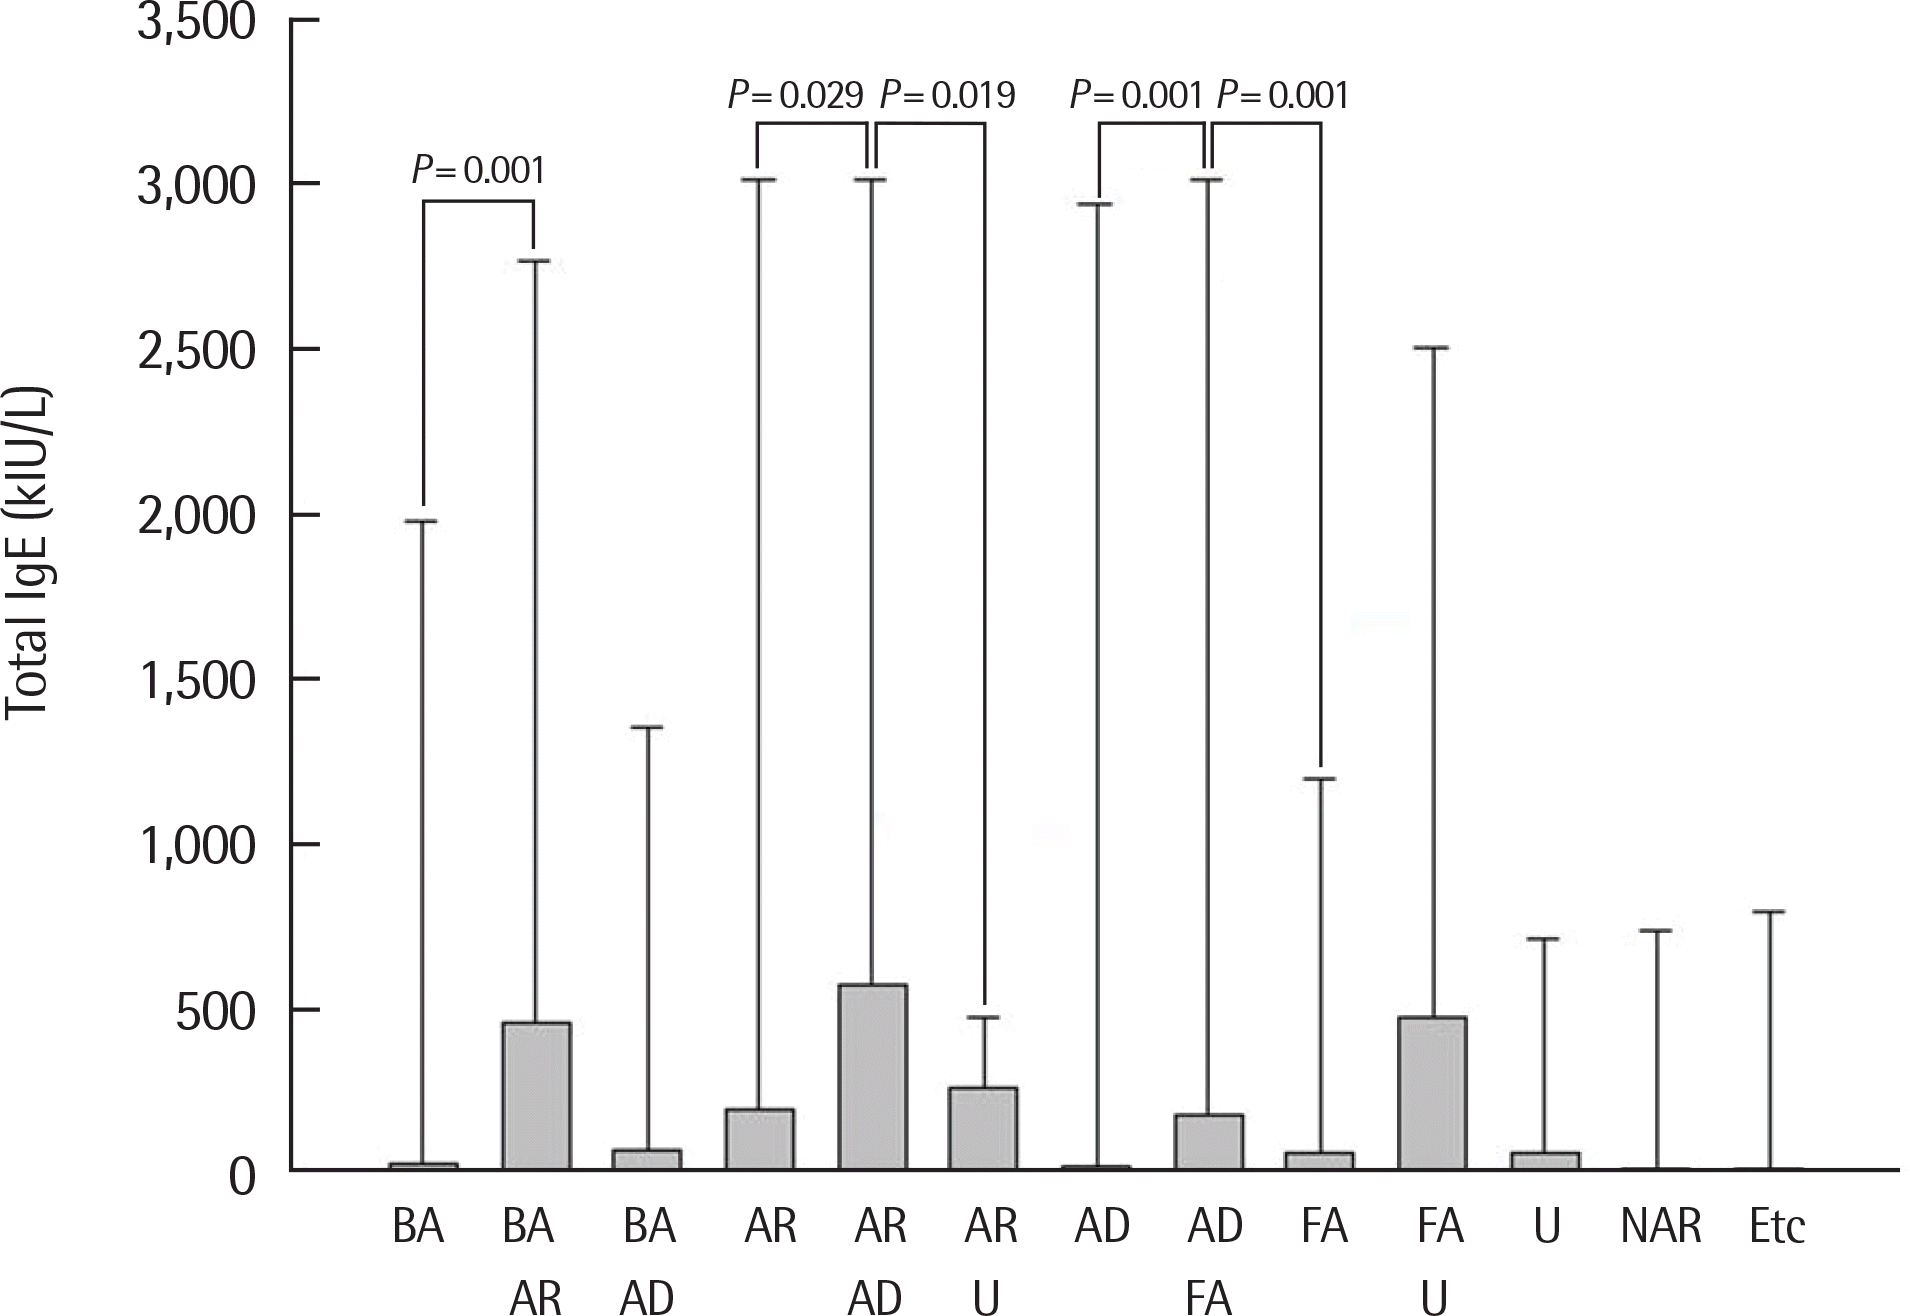
Fig. 4.
(A) Correlation between serum total IgE and sum of 6 inhalant immuno-CAP levels (n=256). (B) Correlation between serum total IgE and sum of 6 inhalant immunoCAP levels excluding subjects who showed positive values to other allergens in multiple allergosorbent test (n=210).
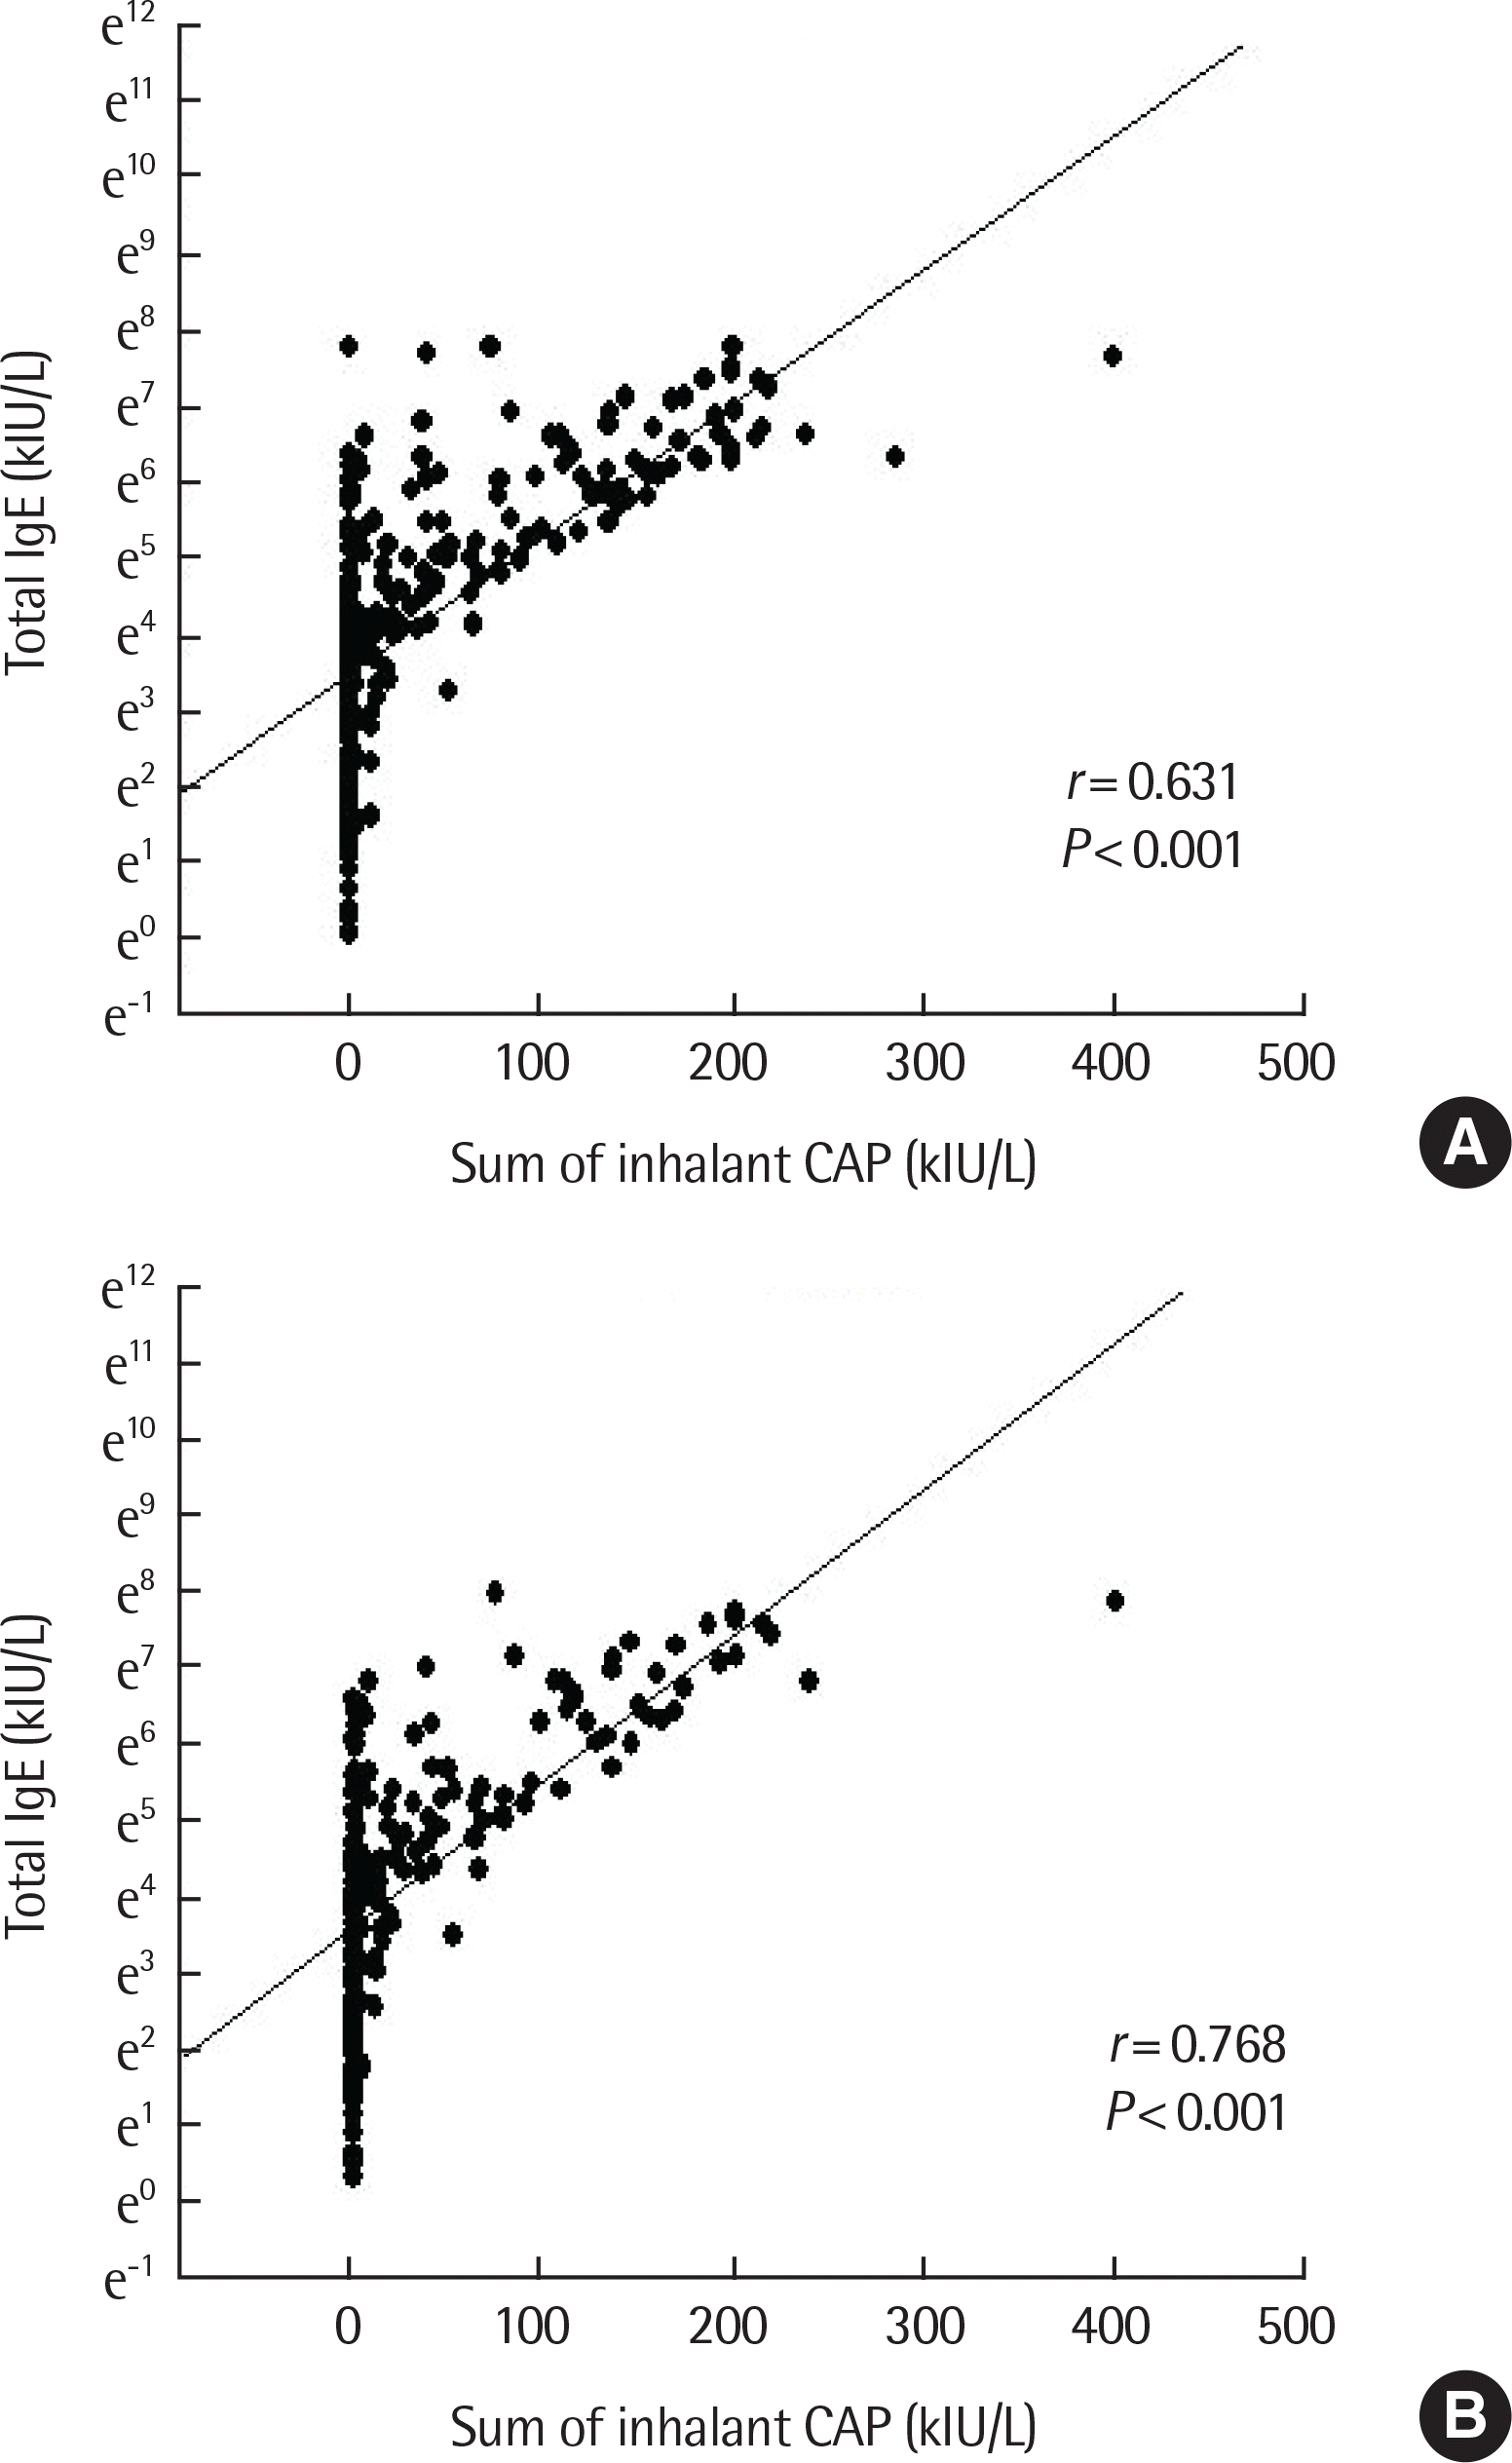
Fig. 5.
(A) Correlation between serum total IgE and sum of 6 food immunoCAP levels (n=263). (B) Correlation between serum total IgE and sum of 6 food immunoCAP levels excluding subjects who showed positive values to other allergens in multiple allergosorbent test (n=169).
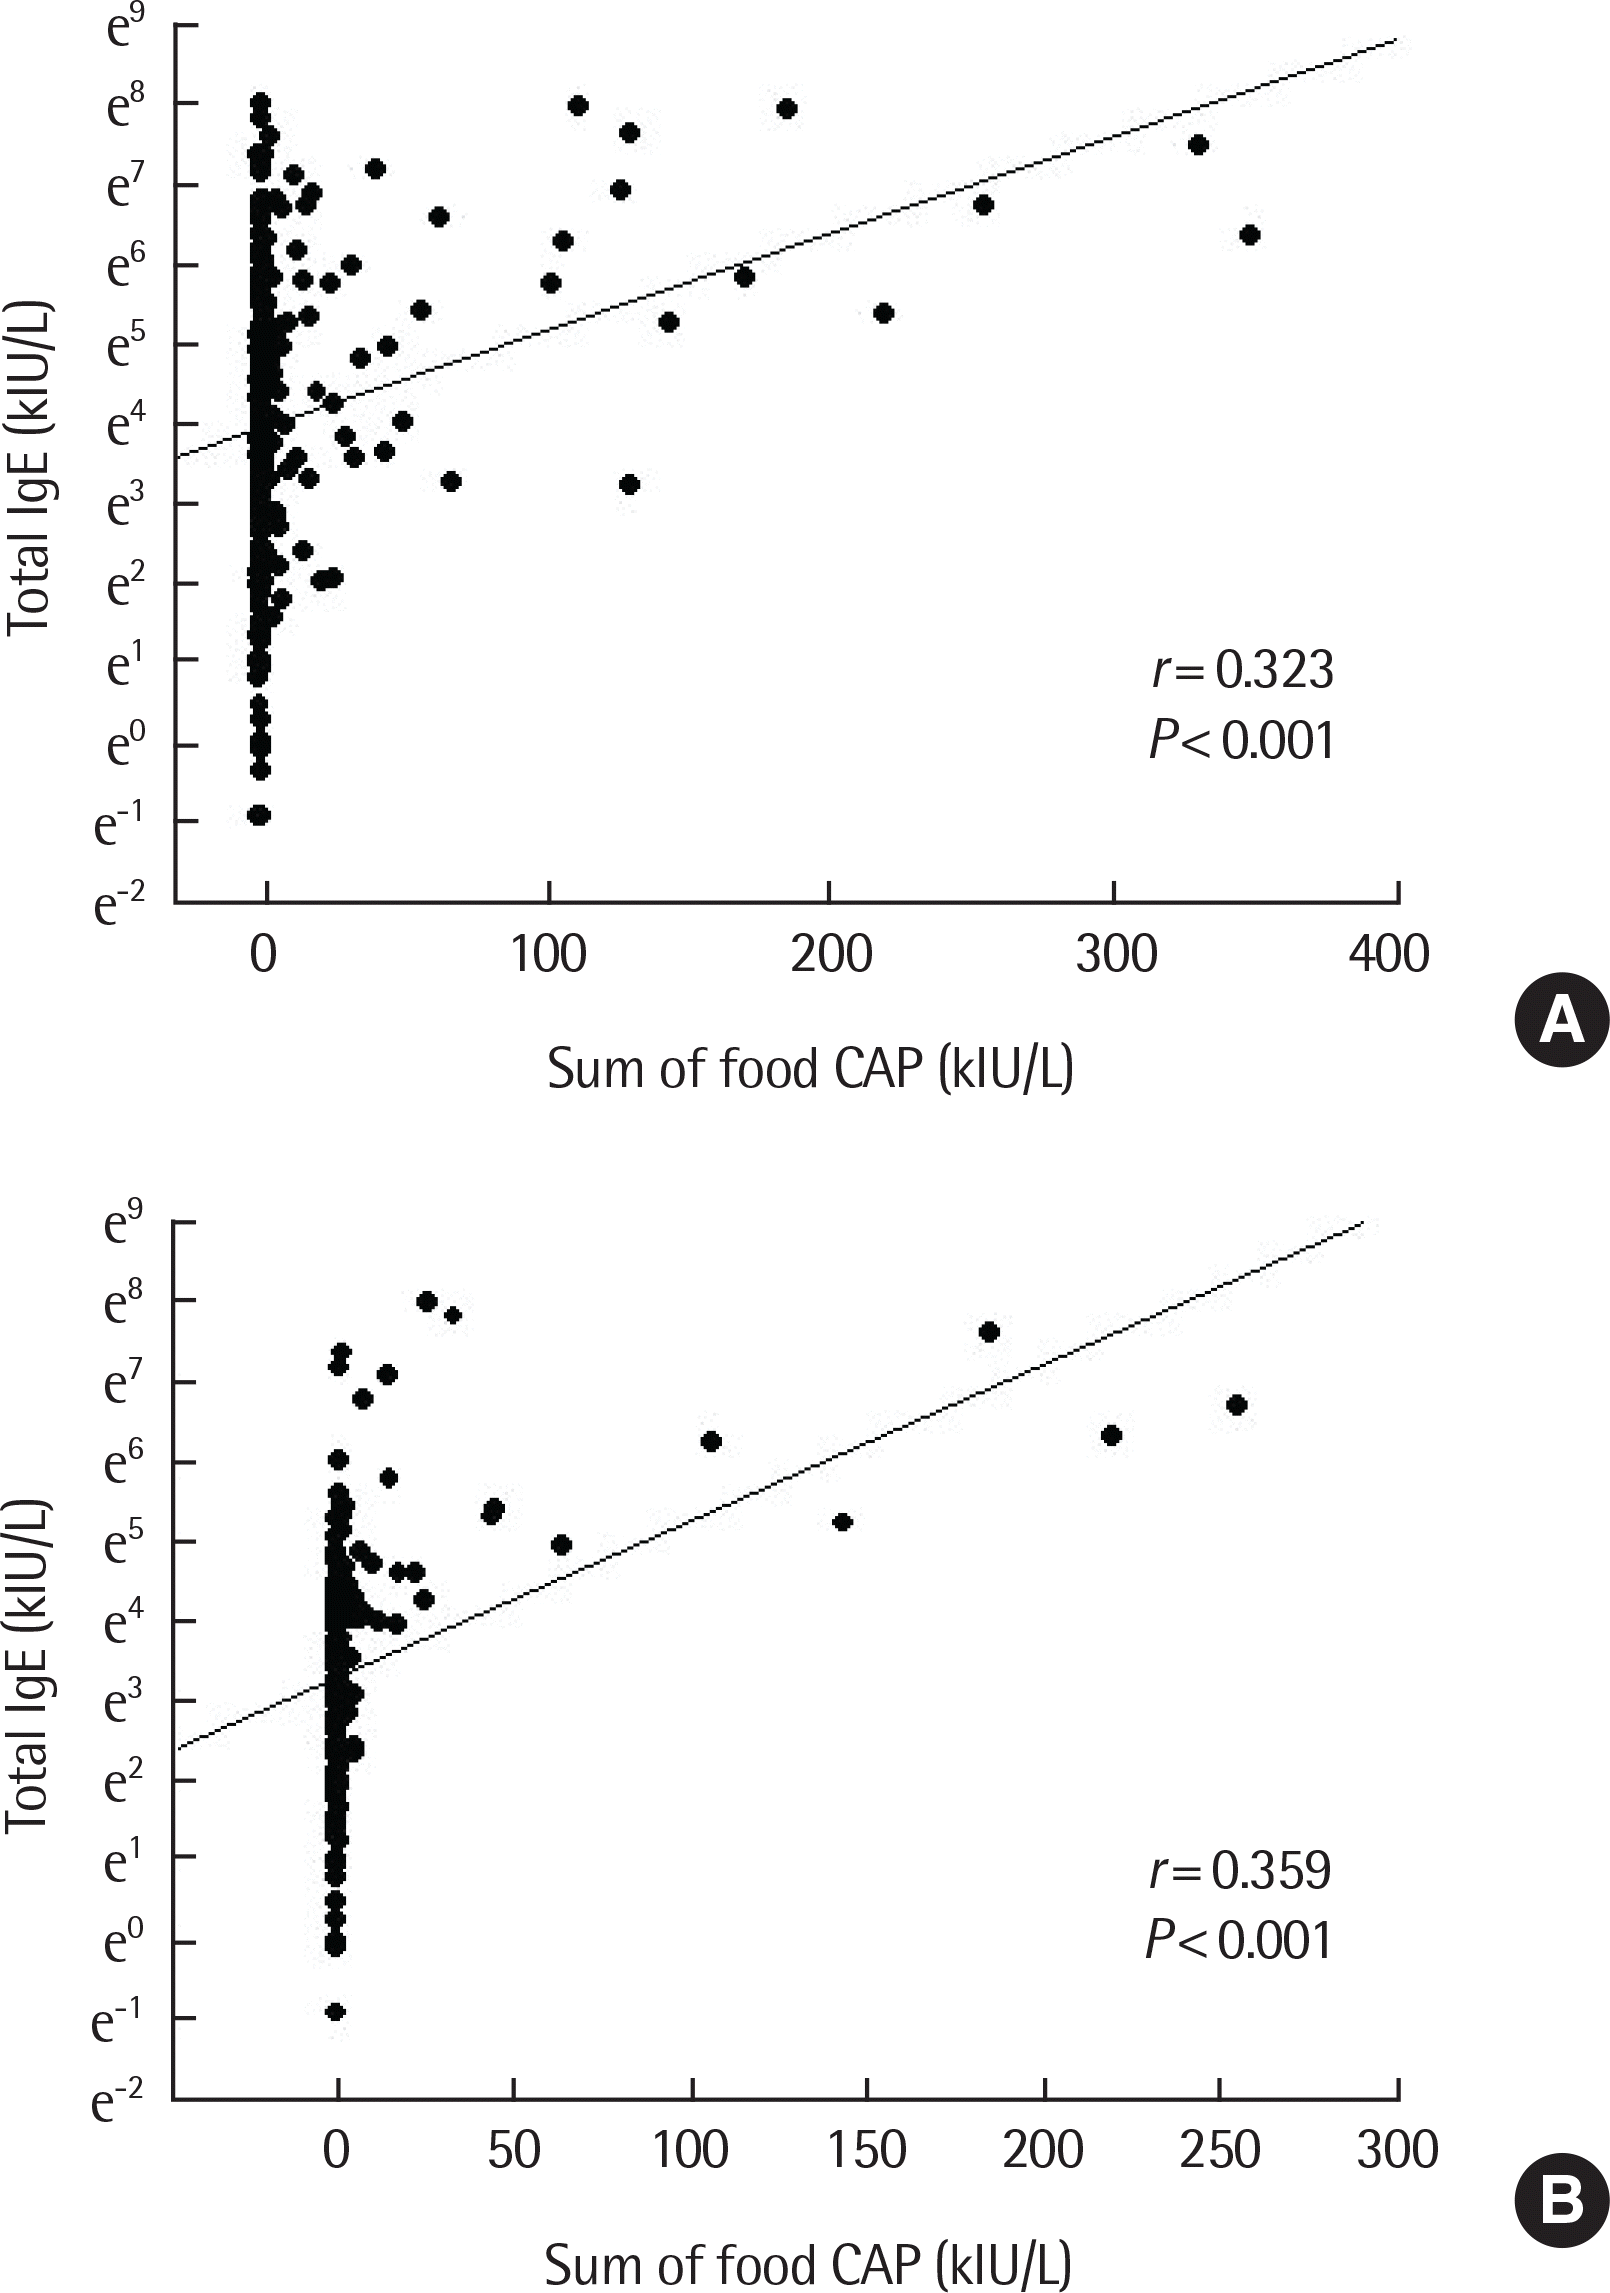
Fig. 6.
Correlation between serum total IgE and sum of class levels of inhalant multiple allergosorbent test (MAST) (n=181).
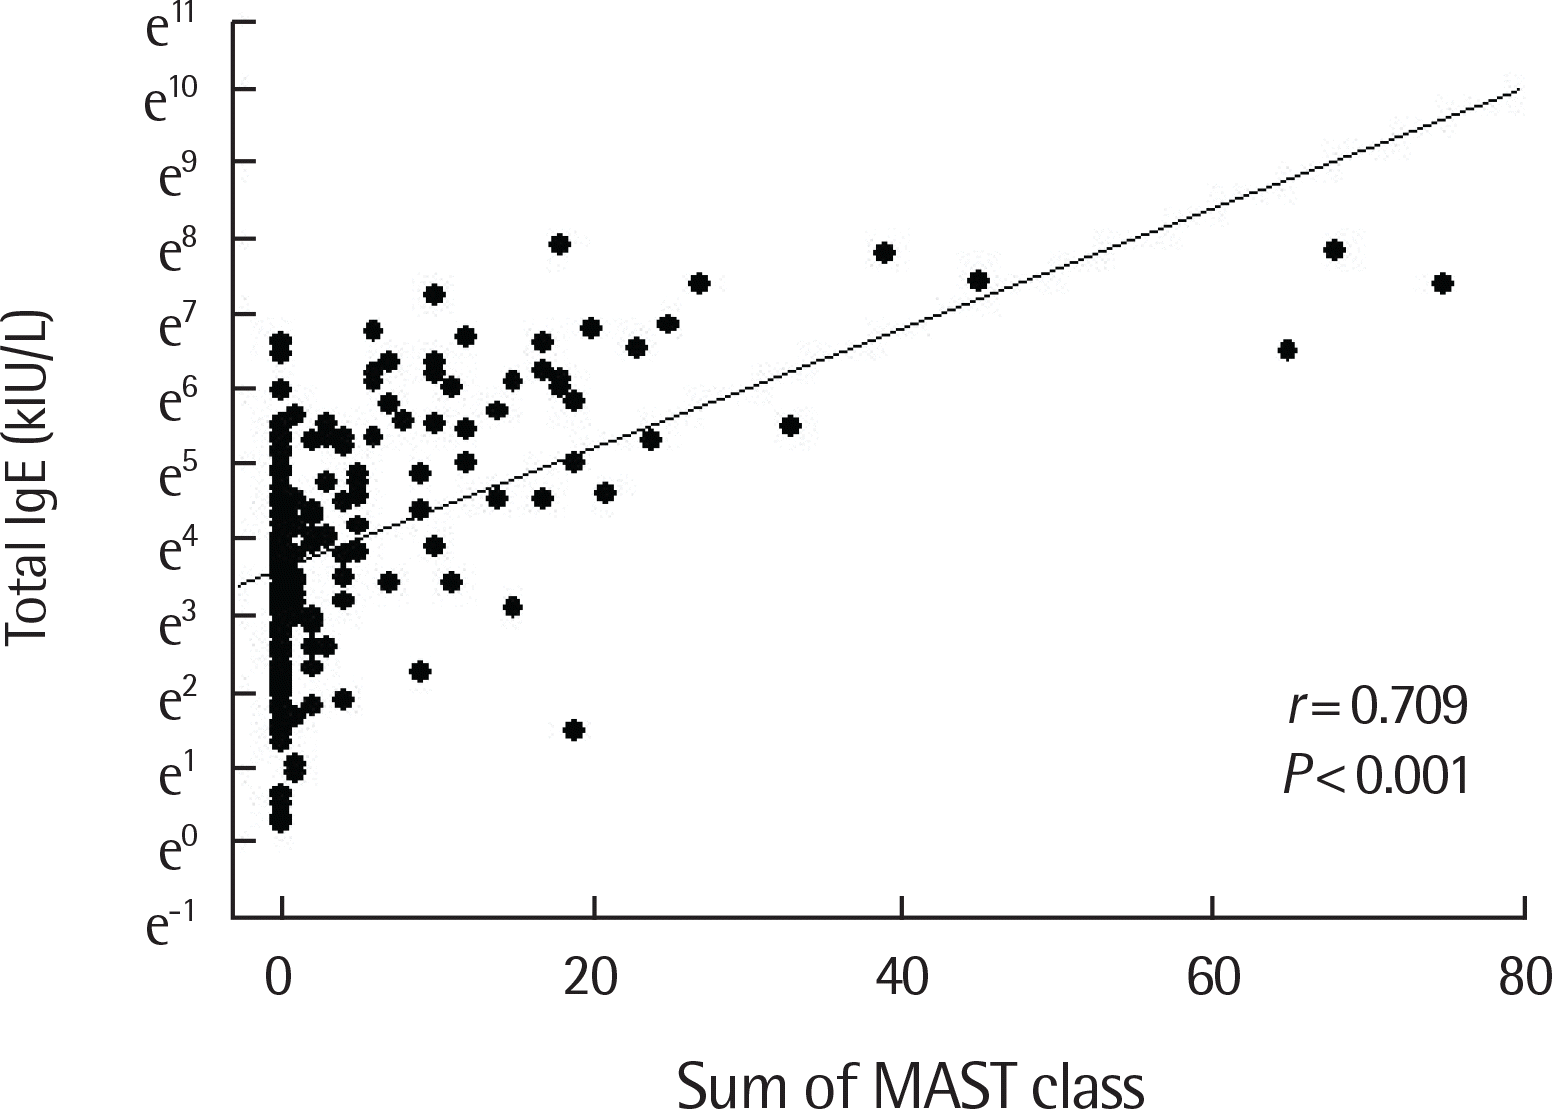
Fig. 7.
Correlation between serum total IgE and sum of class levels of food multiple allergosorbent test (MAST) (n=272)
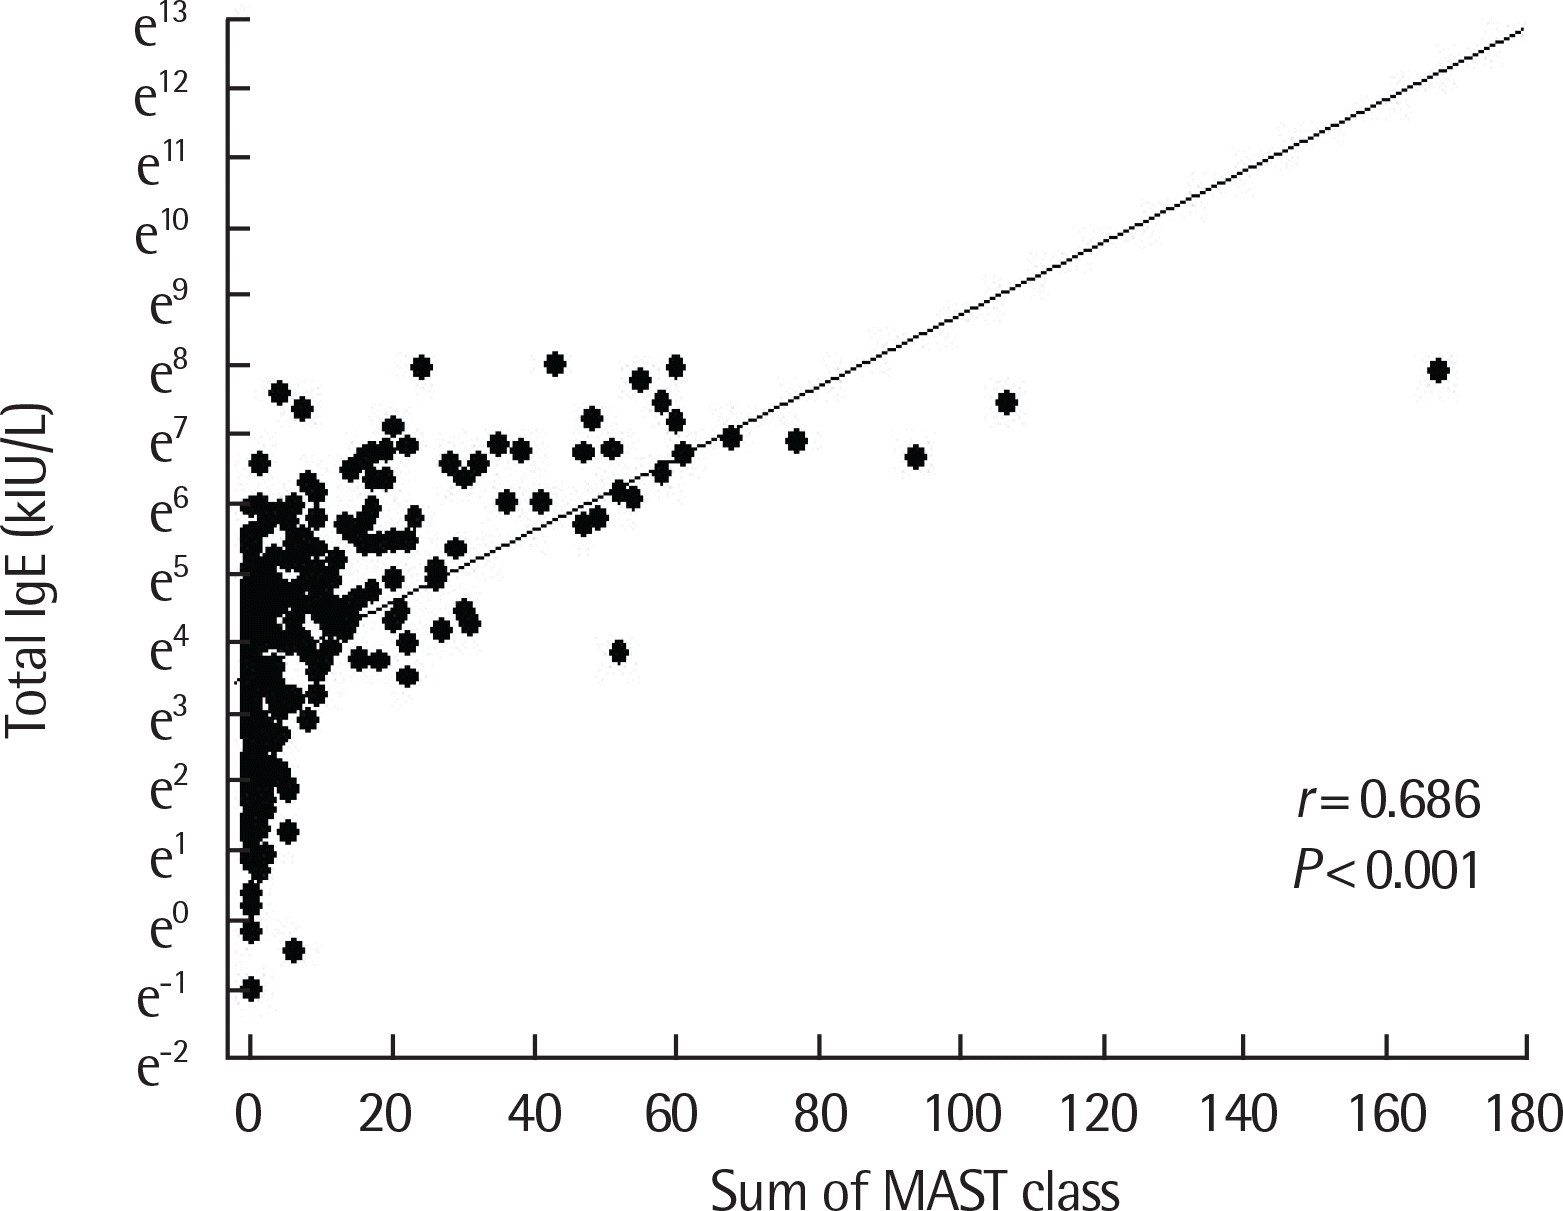
Fig. 8.
Correlation between serum total IgE and sum of the number of positive skin prick test (n=98).
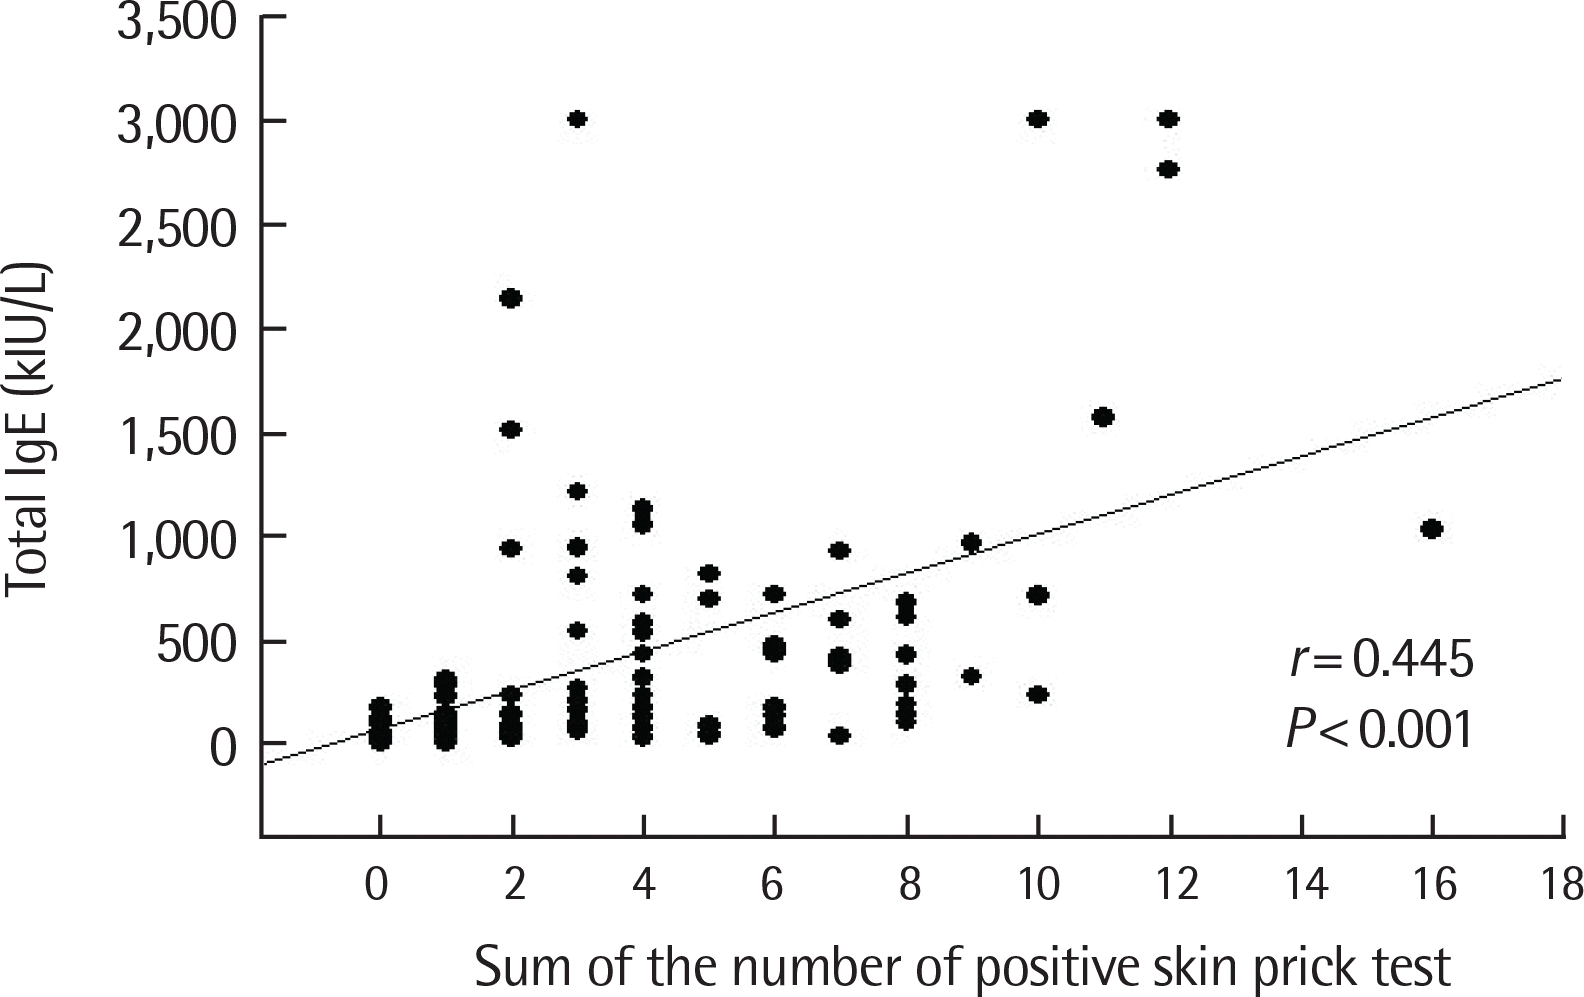
Table 1.
Correlation between total IgE and immunoCAP levels


 PDF
PDF ePub
ePub Citation
 Print
Print


 XML Download