

 PDF
PDF ePub
ePub Citation
 Print
Print


Yeol Ryoon Woo1, Hyun Jin Kim1, Min Sub Kim1, Hyo Jung Koh1, Seong Gyu Lee2, Yeon Hwa Ahn1
Abstract
Purpose
We investigated the clinical difference between single infection and coinfection with respiratory virus in hospitalized children with acute respiratory tract infections.
Methods
We reviewed 727 patients who were admitted with the diagnosis of acute respiratory infection at the Department of Pediatrics, Bundang Jesaeng Hospital between January and December of 2014. Diagnoses were made using the multiplex reverse transcriptase polymerase chain reaction (RT-PCR) assay targeting 16 viruses in nasopharyngeal swabs. Subjects were classified as the single virus infection and coinfection groups.
Results
A total of 439 patients were enrolled; 359 (77.2%) under 24 months. Single virus was detected in 279 (63.6%). Coinfection with multiple virus was detected in 160 (36.4%): 126 (28.7%) with 2 viruses, 30 (6.8%), and 4 (0.9%) with 3 to 4 viruses. Viral coinfection was detected in 28 samples (17.5%), with respiratory syncytial virus (RSV) A and rhinovirus being the most dominating combination. There were no clinical differences between the single infection and coinfection groups, except sputum and the frequency of high RSV load. Sputum was significantly more frequent in the coinfection group (P=0.043), and the frequency of high RSV load was significantly higher in the single infection group (P=0.029). Disease severity (high fever, the duration of fever [≥5 days], and the length of hospital stay [≥5 days], O2 therapy) did not differ significantly between both groups. RSV was a frequent virus of single infection during winter. Coinfection was most common in winter.
Figures and Tables
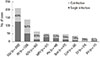 | Fig. 1Percentage of coinfection, by respiratory virus. RSV, respiratory syncytial virus; RV, rhinovirus; MPV, metapneumovirus; PIV, parainfluenza; AdV, adenovirus; BoV, bocavirus; CoV, coronavirus; EV, enterovirus; IFV, influenza virus.
|
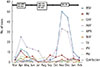 | Fig. 2Monthly distribution of single and coinfection. RSV, respiratory syncytial virus; RV, rhinovirus; MPV, metapneumovirus; PIV, parainfluenza; AdV, adenovirus; BoV, bocavirus; CoV, coronavirus; EV, enterovirus; IFV, influenza virus.
|
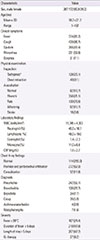
Table 1
Demographic and clinical characteristics of the subjects (n=439)
![]()
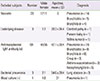
Table 2
Clinical characteristics of excluded subjects (n=128)
![]()
Table 3
Comparison of clinical characteristics between single and coinfection
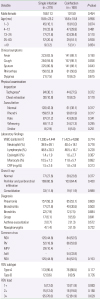
Values are presented as number, mean±standard deviation, or number of cases (%).
WBC, white blood cell; CRP, C-reactive protein; RSV, respiratory syncytial virus; RV, rhinovirus; AdV, adenovirus; MPV, metapneumovirus.
*1–12 months, respiratory rate≥55/min; 13–36 months, respiratory rate≥30/min; 37–72 months, respiratory rate≥25/min; ≥73 months, respiratory rate≥22/min.
![]()
Table 4
Comparison of severity between single and coinfection

![]()
Table 5
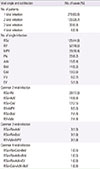
Prevalence of viral single and coinfection
![]()
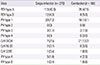
Table 6
Prevalence of single and coinfection for 4 viral subtypes
![]()
References
1. Henrickson KJ. Viral pneumonia in children. Semin Pediatr Infect Dis. 1998; 9:217–233.

2. Renois F, Talmud D, Huguenin A, Moutte L, Strady C, Cousson J, et al. Rapid detection of respiratory tract viral infections and coinfections in patients with influenza-like illnesses by use of reverse transcription-PCR DNA microarray systems. J Clin Microbiol. 2010; 48:3836–3842.
3. Falsey AR, Formica MA, Treanor JJ, Walsh EE. Comparison of quantitative reverse transcription-PCR to viral culture for assessment of respiratory syncytial virus shedding. J Clin Microbiol. 2003; 41:4160–4165.
4. Mengelle C, Mansuy JM, Pierre A, Claudet I, Grouteau E, Micheau P, et al. The use of a multiplex real-time PCR assay for diagnosing acute respiratory viral infections in children attending an emergency unit. J Clin Virol. 2014; 61:411–417.
5. Imaz MS, Sequeira MD, Videla C, Veronessi I, Cociglio R, Zerbini E, et al. Clinical and epidemiologic characteristics of respiratory syncytial virus subgroups A and B infections in Santa Fe, Argentina. J Med Virol. 2000; 61:76–80.
6. DeVincenzo JP, El Saleeby CM, Bush AJ. Respiratory syncytial virus load predicts disease severity in previously healthy infants. J Infect Dis. 2005; 191:1861–1868.
7. Semple MG, Cowell A, Dove W, Greensill J, McNamara PS, Halfhide C, et al. Dual infection of infants by human metapneumovirus and human respiratory syncytial virus is strongly associated with severe bronchiolitis. J Infect Dis. 2005; 191:382–386.
8. Huang JJ, Huang TY, Huang MY, Chen BH, Lin KH, Jeng JE, et al. Simultaneous multiple viral infections in childhood acute lower respiratory tract infections in southern Taiwan. J Trop Pediatr. 1998; 44:308–311.
9. Saunders M, Gorelick MH. Evaluation of the sick child in the office and clinic. In : Kliegman RM, Stanton BF, St. Geme JW, Schor NF, Behrman RE, editors. Nelson textbook of pediatrics. 19th ed. Philadelphia: Elsevier Saunders;2011. p. 280.
10. Denny FW, Clyde WA Jr. Acute lower respiratory tract infections in nonhospitalized children. J Pediatr. 1986; 108(5 Pt 1):635–646.
11. Korean Academy of Asthma, Allergy and Clinical Immunology. Korean Academy of Pediatric Allergy and Respiratory Disease. National Strategic Coordination Center for Clinical Research. 2015 Korean guideline for asthma. Seoul: Korean Academy of Asthma;Allergy and Clinical Immunology;Korean Academy of Pediatric Allergy and Respiratory Disease;National Strategic Coordination Center for Clinical Research;Korean guideline for asthma;2015. p. 33–41.
12. ICD10Data.com. Acute nasopharyngitis [Internet]. c2015. cited 2016 Jan 1. Available from: http://www.icd10data.com/ICD10CM/Codes/J00-J99/J00-J06/J00-/J00.
13. Simoes EA. Environmental and demographic risk factors for respiratory syncytial virus lower respiratory tract disease. J Pediatr. 2003; 143:5 Suppl. S118–S126.
14. Hall CB, Weinberg GA, Iwane MK, Blumkin AK, Edwards KM, Staat MA, et al. The burden of respiratory syncytial virus infection in young children. N Engl J Med. 2009; 360:588–598.
15. Wilkesmann A, Schildgen O, Eis-Hübinger AM, Geikowski T, Glatzel T, Lentze MJ, et al. Human metapneumovirus infections cause similar symptoms and clinical severity as respiratory syncytial virus infections. Eur J Pediatr. 2006; 165:467–475.
16. Peng D, Zhao D, Liu J, Wang X, Yang K, Xicheng H, et al. Multipathogen infections in hospitalized children with acute respiratory infection. Virol J. 2009; 6:155.
17. Calvo C, García-García ML, Blanco C, Vázquez MC, Frías ME, Pérez-Breña P, et al. Multiple simultaneous viral infections in infants with acute respiratory tract infections in Spain. J Clin Virol. 2008; 42:268–272.
18. Drews AL, Atmar RL, Glezen WP, Baxter BD, Piedra PA, Greenberg SB. Dual respiratory virus infections. Clin Infect Dis. 1997; 25:1421–1429.
19. Foulongne V, Guyon G, Rodière M, Segondy M. Human metapneumovirus infection in young children hospitalized with respiratory tract disease. Pediatr Infect Dis J. 2006; 25:354–359.
20. Richard N, Komurian-Pradel F, Javouhey E, Perret M, Rajoharison A, Bagnaud A, et al. The impact of dual viral infection in infants admitted to a pediatric intensive care unit associated with severe bronchiolitis. Pediatr Infect Dis J. 2008; 27:213–217.
21. Marguet C, Lubrano M, Gueudin M, Le Roux P, Deschildre A, Forget C, et al. In very young infants severity of acute bronchiolitis depends on carried viruses. PLoS One. 2009; 4:e4596.
22. Greer RM, McErlean P, Arden KE, Faux CE, Nitsche A, Lambert SB, et al. Do rhinoviruses reduce the probability of viral co-detection during acute respiratory tract infections? J Clin Virol. 2009; 45:10–15.
23. Eem YJ, Bae EY, Lee JH, Jeong DC. Risk Factors associated with respiratory virus detection in infants younger than 90 days of age. Korean J Pediatr Infect Dis. 2014; 21:22–28.
24. Kim HJ, Kim JH, Kang IJ. Association of respiratory viral infection and atopy with severity of acute bronchiolitis in infants. Pediatr Allergy Respir Dis. 2011; 21:302–312.
25. Choi EH, Lee HJ, Kim SJ, Eun BW, Kim NH, Lee JA, et al. The association of newly identified respiratory viruses with lower respiratory tract infections in Korean children, 2000-2005. Clin Infect Dis. 2006; 43:585–592.
26. Cebey-López M, Herberg J, Pardo-Seco J, Gómez-Carballa A, Martinón-Torres N, Salas A, et al. Viral co-Infections in pediatric patients hospitalized with lower tract acute respiratory infections. PLoS One. 2015; 10:e0136526.
27. Papadopoulos NG, Moustaki M, Tsolia M, Bossios A, Astra E, Prezerakou A, et al. Association of rhinovirus infection with increased disease severity in acute bronchiolitis. Am J Respir Crit Care Med. 2002; 165:1285–1289.
28. Jung HD, Cheong HM, Kim SS. Prevalence of respiratory viruses in patients with acute respiratory infections, 2014. Public Health Wkly Rep. 2014; 9:26–36.
29. Jartti T, Lehtinen P, Vuorinen T, Koskenvuo M, Ruuskanen O. Persistence of rhinovirus and enterovirus RNA after acute respiratory illness in children. J Med Virol. 2004; 72:695–699.
30. Franz A, Adams O, Willems R, Bonzel L, Neuhausen N, Schweizer-Krantz S, et al. Correlation of viral load of respiratory pathogens and co-infections with disease severity in children hospitalized for lower respiratory tract infection. J Clin Virol. 2010; 48:239–245.
31. El Saleeby CM, Bush AJ, Harrison LM, Aitken JA, Devincenzo JP. Respiratory syncytial virus load, viral dynamics, and disease severity in previously healthy naturally infected children. J Infect Dis. 2011; 204:996–1002.
32. Brand HK, de Groot R, Galama JM, Brouwer ML, Teuwen K, Hermans PW, et al. Infection with multiple viruses is not associated with increased disease severity in children with bronchiolitis. Pediatr Pulmonol. 2012; 47:393–400.
33. Houben ML, Coenjaerts FE, Rossen JW, Belderbos ME, Hofland RW, Kimpen JL, et al. Disease severity and viral load are correlated in infants with primary respiratory syncytial virus infection in the community. J Med Virol. 2010; 82:1266–1271.
34. Jansen RR, Wieringa J, Koekkoek SM, Visser CE, Pajkrt D, Molenkamp R, et al. Frequent detection of respiratory viruses without symptoms: toward defining clinically relevant cutoff values. J Clin Microbiol. 2011; 49:2631–2636.
 XML Download