

 PDF
PDF ePub
ePub Citation
 Print
Print


 , Hyun-Hee Kim2, Yoon-Seok Chang3, Kwang-Ha Yoo4, Keon-Tae Sohn5
Abstract
Purpose
Methods
Figures and Tables
Fig. 1
Box plot showing distribution of patients with asthma by sex and age group. M, man subject; W, woman subject. M1 and W1: 0–2 years old, M2 and W2: 3–6 years old, M3 and W3: 7–18 years old, M4 and W4: 19–64 years old, M5 and W5: 65 years old.
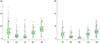
Fig. 2
Histogram showing distribution of patients with asthma by sex and age group. M, man subject; W, woman subject. M1 and W1: 0–2 years old, M2 and W2: 3–6 years old, M3 and W3: 7–18 years old, M4 and W4: 19–64 years old, M5 and W5: 65 years old.
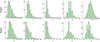
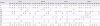
Table 1
Potential predictors of asthma
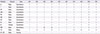
Numbers indicate the significant lag times (days) between environmental factors and the Health Insurance Review and Assessment Service data (occurrence of asthma symptoms).
A, autocorrelated factor; T, mean temperature; DT, daily range; MH, minimum humidity; PR, pressure; HS, hours of sunshine; OZ, concentration of ozone; PL, pollen; FL, proportion of flu patients; PM, concentration of yellow sand; YS, presence of yellow sand; D, day of the week; M, man; W, woman.
Table 2
Assessment of model validity and predictability
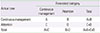
| Actual case | Forecasted category | ||
|---|---|---|---|
| Continuous management | Attention | Total | |
| Continuous management | A | B | A+B |
| Attention | C | D | C+D |
| Total | A+C | B+D | A+B+C+D |
Table 3
Asthma cases in the HIRA dataset according to sex, age group (1–5), and season
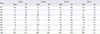
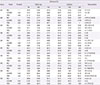
Table 4
Potential predictors
A circle means that the predictor is significantly correlated with the corresponding group.
A, autocorrelated factor; T, mean temperature; DT, daily range; MH, minimum humidity; PR, pressure; HS, hours of sunshine; OZ, concentration of ozone; YS, presence of yellow sand; PM, concentration of yellow sand; PL, pollen; FL, proportion of flu patients; M, man; W, woman.
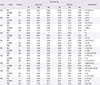
Table 5
Comparison of binary forecasting models for the spring season
A threshold cannot be used to determine the category of symptoms in the multiple regression model.
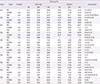
HR, hit rate; POD, probability of detection; FAR, false alarm rate; A, autocorrelated factor; T, mean temperature; DT, daily range; MH, minimum humidity; PR, pressure; HS, hours of sunshine; OZ, concentration of ozone; PL, pollen; FL, proportion of flu patients; PM, concentration of yellow sand; YS, presence of yellow sand; D, day of the week; M, man; W, woman.
*No numerical value. **There is no significant predictive factor or dummy variable denoting day of week.
Table 6
Comparison of the binary forecasting models for the summer season
A threshold cannot be used to determine the category of symptoms in the multiple regression model.
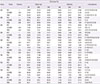
HR, hit rate; POD, probability of detection; FAR, false alarm rate; A, autocorrelated factor; T, mean temperature; DT, daily range; MH, minimum humidity; PR, pressure; HS, hours of sunshine; OZ, concentration of ozone; PL, pollen; FL, proportion of flu patients; PM, concentration of yellow sand; YS, presence of yellow sand; D, day of the week; M, man; W, woman.
*No numerical value. **There is no significant predictive factor or dummy variable denoting day of week.
Table 7
Comparison of the binary forecasting models for the autumn season
A threshold cannot be used to determine the category of symptoms in the multiple regression model.
HR, hit rate; POD, probability of detection; FAR, false alarm rate; A, autocorrelated factor; T, mean temperature; DT, daily range; MH, minimum humidity; PR, pressure; HS, hours of sunshine; OZ, concentration of ozone; PL, pollen; FL, proportion of flu patients; PM, concentration of yellow sand; YS, presence of yellow sand; D, day of the week; M, man; W, woman.
*No numerical value. **There is no significant predictive factor or dummy variable denoting day of week.
Table 8
Comparison of the binary forecasting models for the winter season.
A threshold cannot be used to determine the category of symptoms in the multiple regression model.
HR, hit rate; POD, probability of detection; FAR, false alarm rate; A, autocorrelated factor; T, mean temperature; DT, daily range; MH, minimum humidity; PR, pressure; HS, hours of sunshine; OZ, concentration of ozone; PL, pollen; FL, proportion of flu patients; PM, concentration of yellow sand; YS, presence of yellow sand; D, day of the week; M, man; W, woman.
*No numerical value.
Table 9
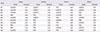
Proposed models and thresholds for binary asthma forecasting
 XML Download