

 PDF
PDF ePub
ePub Citation
 Print
Print


Yeong-Ho Kim1, So-Yeon Lee2, Eun Lee3, Hyun-Ju Cho1, Hyo-Bin Kim4, Ji-Won Kwon5, Song-I Yang2, Eun-Jin Kim6, Jeom-Kyu Lee6, Soo-Jong Hong1
Abstract
Purpose
There are many reports that the prevalence of food allergy (FA) is globally increasing. We investigated the change in FA prevalence since the last 20 years in elementary school children, in Seoul, Korea.
Methods
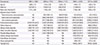
A modified International Study of Asthma and Allergies in Childhood questionnaire survey was done to elementary school children in Seoul, Korea in 1995, 2000, 2005, 2008, and 2012. The numbers of subjects included in the analysis were 7,963, 7,971, 7,131, 3,975, and 3,307, respectively. Blood and skin prick tests were done in 2008 and 2012.
Results
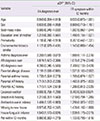
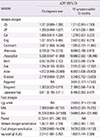
The prevalence rates of FA diagnosis ever were 4.6% (95% confidence interval [CI], 4.1–5.1), 5.2% (95% CI, 4.7–5.7), 6.4% (95% CI, 5.9–7.0), 5.5% (95% CI, 4.8–6.3), and 6.6% (95% CI, 5.8–7.6) in 1995, 2000, 2005, 2008, and 2012, respectively (P-value for trend <0.001). Asthma (adjusted odds ratio [aOR], 2.209; 95% CI, 1.589–3.072), allergic rhinitis (aOR, 1.874; 95% CI, 1.473–2.384), and atopic dermatitis (aOR, 4.288; 95% CI, 3.340–5.506) were associated with FA diagnosis. Parental allergic disease history (aOR, 2.191; 95% CI, 1.666–2.881), antibiotics use in infancy (aOR, 1.484; 95% CI, 1.170–1.883), and house mold exposure in infancy (aOR, 1.540; 95% CI, 1.172–2.024) were risk factors for FA diagnosis. Sensitization to inhalant allergens (aOR, 1.867; 95% CI, 1.091–3.194) and increased serum total IgE (aOR, 2.014; 95% CI, 1.081–3.752) were associated with FA diagnosis.
Figures and Tables
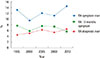
Table 1
Characteristics of the subjects
![]()
Table 2
Prevalence of food allergy by year with 95% confidence interval

![]()
Table 3
Prevalence of FA diagnosis ever by age

![]()
Table 4
The risk factors for food allergy
![]()
Table 5
Adjusted odds ratio of specific allergen sensitization for food allergy
![]()
References
1. Sicherer SH, Munoz-Furlong A, Godbold JH, Sampson HA. US prevalence of self-reported peanut, tree nut, and sesame allergy: 11-year follow-up. J Allergy Clin Immunol. 2010; 125:1322–1326.

2. Kotz D, Simpson CR, Sheikh A. Incidence, prevalence, and trends of general practitioner-recorded diagnosis of peanut allergy in England, 2001 to 2005. J Allergy Clin Immunol. 2011; 127:623–630.e1.
3. Keet CA, Savage JH, Seopaul S, Peng RD, Wood RA, Matsui EC. Temporal trends and racial/ethnic disparity in self-reported pediatric food allergy in the United States. Ann Allergy Asthma Immunol. 2014; 112:222–229.e3.
4. Sicherer SH, Sampson HA. Food allergy: epidemiology, pathogenesis, diagnosis, and treatment. J Allergy Clin Immunol. 2014; 133:291–307.
5. McGowan EC, Keet CA. Prevalence of self-reported food allergy in the National Health and Nutrition Examination Survey (NHANES) 2007-2010. J Allergy Clin Immunol. 2013; 132:1216–1219.e5.
6. Oh JW, Pyun BY, Choung JT, Ahn KM, Kim CH, Song SW, et al. Epidemiological change of atopic dermatitis and food allergy in school-aged children in Korea between 1995 and 2000. J Korean Med Sci. 2004; 19:716–723.
7. Ahn K, Kim J, Hahm MI, Lee SY, Kim WK, Chae Y, et al. Prevalence of immediate-type food allergy in Korean schoolchildren: a population-based study. Allergy Asthma Proc. 2012; 33:481–487.
8. Spergel JM. From atopic dermatitis to asthma: the atopic march. Ann Allergy Asthma Immunol. 2010; 105:99–106.
9. Park SJ, Lee JS, Ahn K, Chung SJ. the comparison of growth and nutrient intakes in children with and without atopic dermatitis. Korean J Community Nutr. 2012; 17:271–279.
10. Lee JY, Seo JH, Kwon JW, Yu J, Kim BJ, Lee SY, et al. Exposure to gene-environment interactions before 1 year of age may favor the development of atopic dermatitis. Int Arch Allergy Immunol. 2012; 157:363–371.
11. Kim EJ, Kwon JW, Lim YM, Yoon D, Seo JH, Chang WS, et al. Assessment of total/specific IgE levels against 7 inhalant allergens in children aged 3 to 6 years in Seoul, Korea. Allergy Asthma Immunol Res. 2013; 5:162–169.
12. Seo JH, Kim HY, Jung YH, Lee E, Yang SI, Yu HS, et al. Interactions between innate immunity genes and early-life risk factors in allergic rhinitis. Allergy Asthma Immunol Res. 2015; 7:241–248.
13. Liew WK, Williamson E, Tang ML. Anaphylaxis fatalities and admissions in Australia. J Allergy Clin Immunol. 2009; 123:434–442.
14. Platts-Mills TA. The allergy epidemics: 1870-2010. J Allergy Clin Immunol. 2015; 136:3–13.
15. Park JY, Park GY, Han YS, Shin MY. Survey of food allergy in elementary school children in Bucheon-city and relationship between food allergy and other allergic diseases. Allergy Asthma Respir Dis. 2013; 1:266–273.
16. Boyce JA, Assa'ad A, Burks AW, Jones SM, Sampson HA, Wood RA, et al. Guidelines for the diagnosis and management of food allergy in the United States: summary of the NIAID-sponsored expert panel report. Nutr Res. 2011; 31:61–75.
17. Lee KS. The diagnosis of food allergy in a pediatric gastroenterology: focusing on non-IgE-mediated allergic diseases. Korean J Pediatr Gastroenterol Nutr. 2010; 13:Suppl 1. S32–S43.
18. Gupta RS, Springston EE, Warrier MR, Smith B, Kumar R, Pongracic J, et al. The prevalence, severity, and distribution of childhood food allergy in the United States. Pediatrics. 2011; 128:e9–e17.
19. Liu AH, Jaramillo R, Sicherer SH, Wood RA, Bock SA, Burks AW, et al. National prevalence and risk factors for food allergy and relationship to asthma: results from the National Health and Nutrition Examination Survey 2005-2006. J Allergy Clin Immunol. 2010; 126:798–806.e13.
20. Koplin JJ, Allen KJ, Gurrin LC, Peters RL, Lowe AJ, Tang ML, et al. The impact of family history of allergy on risk of food allergy: a population-based study of infants. Int J Environ Res Public Health. 2013; 10:5364–5377.
21. Allen KJ, Koplin JJ, Ponsonby AL, Gurrin LC, Wake M, Vuillermin P, et al. Vitamin D insufficiency is associated with challenge-proven food allergy in infants. J Allergy Clin Immunol. 2013; 131:1109–1116. 1116.e1-6
22. Kusunoki T, Mukaida K, Morimoto T, Sakuma M, Yasumi T, Nishikomori R, et al. Birth order effect on childhood food allergy. Pediatr Allergy Immunol. 2012; 23:250–254.
23. Koplin JJ, Dharmage SC, Ponsonby AL, Tang ML, Lowe AJ, Gurrin LC, et al. Environmental and demographic risk factors for egg allergy in a population-based study of infants. Allergy. 2012; 67:1415–1422.
24. Kim WK, Kwon JW, Seo JH, Kim HY, Yu J, Kim BJ, et al. Interaction between IL13 genotype and environmental factors in the risk for allergic rhinitis in Korean children. J Allergy Clin Immunol. 2012; 130:421–426.e5.
25. Lee SY, Yu J, Ahn KM, Kim KW, Shin YH, Lee KS, et al. Additive effect between IL-13 polymorphism and cesarean section delivery/prenatal antibiotics use on atopic dermatitis: a birth cohort study (COCOA). PLoS One. 2014; 9:e96603.
26. Sudo N, Sawamura S, Tanaka K, Aiba Y, Kubo C, Koga Y. The requirement of intestinal bacterial flora for the development of an IgE production system fully susceptible to oral tolerance induction. J Immunol. 1997; 159:1739–1745.
27. Stefka AT, Feehley T, Tripathi P, Qiu J, McCoy K, Mazmanian SK, et al. Commensal bacteria protect against food allergen sensitization. Proc Natl Acad Sci U S A. 2014; 111:13145–13150.
28. Rodriguez B, Prioult G, Hacini-Rachinel F, Moine D, Bruttin A, Ngom-Bru C, et al. Infant gut microbiota is protective against cow's milk allergy in mice despite immature ileal T-cell response. FEMS Microbiol Ecol. 2012; 79:192–202.
29. Yang SI, Lee E, Jung YH, Kim HY, Seo JH, Kwon JW, et al. Effect of antibiotic use and mold exposure in infancy on allergic rhinitis in susceptible adolescents. Ann Allergy Asthma Immunol. 2014; 113:160–165.e1.
30. Osborne NJ, Thornton CR, Sharpe RA. Indoor fungal exposure and allergic respiratory disease. Curr Allergy Asthma Rep. 2015; 15:71.
31. Stelmach I, Bobrowska-Korzeniowska M, Smejda K, Majak P, Jerzynska J, Stelmach W, et al. Risk factors for the development of atopic dermatitis and early wheeze. Allergy Asthma Proc. 2014; 35:382–389.
32. Heinrich J, Popescu MA, Wjst M, Goldstein IF, Wichmann HE. Atopy in children and parental social class. Am J Public Health. 1998; 88:1319–1324.
33. Yang HJ, Lee SY, Suh DI, Shin YH, Kim BJ, Seo JH, et al. The Cohort for Childhood Origin of Asthma and allergic diseases (COCOA) study: design, rationale and methods. BMC Pulm Med. 2014; 14:109.
 XML Download