

 PDF
PDF ePub
ePub Citation
 Print
Print


Abstract
Purpose
It appears that much of the discordance between skin prick test (SPT) and ImmunoCAP in clinical practice. We investigated the comparison and correlation between SPT and ImmunoCAP for inhalant allergens.
Methods
A total of 1,400 patients who were tested SPT and ImmunoCAP were recruited from June 2011 to May 2014 in Dong-A University Hospital, and the results of two assays were compared for 17 inhalant allergens. For SPT, mean wheal size≥3 mm or allergen/histamine≥1 at 15 minutes, and the result of ImmunoCAP of ≥0.35 kU/L was considered positive, respectively.
Results
Of the study subjects, bronchial asthma was 29.3%, rhinitis 36.8%, atopic dermatitis 0.6%, and chronic urticaria 4.3%. The agreement rate of between two assays was 77.4%. When ImmunoCAP was compared with SPT as the reference, the sensitivity, specificity was 75.5% and 80.0%, respectively. Significant correlation was observed (r=0.59), and birch, mugwort, Japanese hop, house dust mites, and cockroach showed very strong correlation (r>0.7).
Figures and Tables
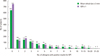 | Fig. 1Distribution of subjects according to the number of allergens with positive results for skin prick test (SPT). A/H, allergen/histamine.
|
Table 1
Clinical characteristics of study subjects (n=1,400)

![]()
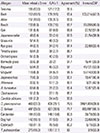
Table 2
Positive rate of skin prick test and ImmunoCAP (n=1,400)
![]()
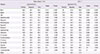
Table 3
The agreement between skin prick test and ImmunoCAP
![]()
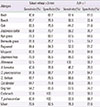
Table 4
The sensitivity and specificity of ImmunoCAP compared with skin prick test as the reference
![]()
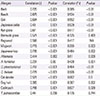
Table 5
Correlation between mean wheal size of skin prick test and serum specific IgE levels measured by ImmunoCAP system
![]()
References
1. Meltzer EO, Blaiss MS, Derebery MJ, Mahr TA, Gordon BR, Sheth KK, et al. Burden of allergic rhinitis: results from the Pediatric Allergies in America survey. J Allergy Clin Immunol. 2009; 124:3 Suppl. S43–S70.

2. Hamilton RG. Clinical laboratory assessment of immediate-type hypersensitivity. J Allergy Clin Immunol. 2010; 125:2 Suppl 2. S284–S296.
3. Plebani M, Borghesan F, Faggian D. Clinical efficiency of in vitro and in vivo tests for allergic diseases. Ann Allergy Asthma Immunol. 1995; 74:23–28.
4. Nelson HS. Diagnostic procedures in allergy. I. Allergy skin testing. Ann Allergy. 1983; 51:411–418.
5. Ownby DR. Allergy testing: in vivo versus in vitro. Pediatr Clin North Am. 1988; 35:995–1009.
6. Esch RE. Manufacturing and standardizing fungal allergen products. J Allergy Clin Immunol. 2004; 113:210–215.
7. Proceedings of the task force on guidelines for standardizing old and new technologies used for the diagnosis and treatment of allergic diseases. Washington, DC. June 18-19, 1987. J Allergy Clin Immunol. 1988; 82(3 Pt 2):487–526.
8. Wide L, Bennich H, Johansson SG. Diagnosis of allergy by an in-vitro test for allergen antibodies. Lancet. 1967; 2:1105–1107.
9. Witteman AM, Stapel SO, Perdok GJ, Sjamsoedin DH, Jansen HM, Aalberse RC, et al. The relationship between RAST and skin test results in patients with asthma or rhinitis: a quantitative study with purified major allergens. J Allergy Clin Immunol. 1996; 97(1 Pt 1):16–25.
10. Yang SE, Oh HB, Hong SJ, Moon DH, Chi HS. Analysis of MAST chemiluminescent assay (MAST CLA) results performed in Asan Medical Center: suggestion for the improvement of MAST CLA performance. Korean J Clin Pathol. 1998; 18:660–666.
11. Gleeson M, Cripps AW, Hensley MJ, Wlodarczyk JH, Henry RL, Clancy RL. A clinical evaluation in children of the Pharmacia ImmunoCAP system for inhalant allergens. Clin Exp Allergy. 1996; 26:697–702.
12. Kelso JM, Sodhi N, Gosselin VA, Yunginger JW. Diagnostic performance characteristics of the standard Phadebas RAST, modified RAST, and pharmacia CAP system versus skin testing. Ann Allergy. 1991; 67:511–514.
13. Calabria CW, Dietrich J, Hagan L. Comparison of serum-specific IgE (ImmunoCAP) and skin-prick test results for 53 inhalant allergens in patients with chronic rhinitis. Allergy Asthma Proc. 2009; 30:386–396.
14. Jeong S, Jang GC, Cho NJ, Han MS, Kim HS, Sun JY, et al. Analysis of polycheck allergy results of the recent two years: comparison with skin prick test and ImmunoCAP. Lab Med Online. 2012; 2:139–147.
15. Ricci G, Capelli M, Miniero R, Menna G, Zannarini L, Dillon P, et al. A comparison of different allergometric tests, skin prick test, Pharmacia UniCAP and ADVIA Centaur, for diagnosis of allergic diseases in children. Allergy. 2003; 58:38–45.
16. Jung YG, Cho HJ, Park GY, Min JY, Kim HY, Dhong HJ, et al. Comparison of the skin-prick test and Phadia ImmunoCAP as tools to diagnose house-dust mite allergy. Am J Rhinol Allergy. 2010; 24:226–229.
17. Jung JW, Jeon EJ, Lee HM, Cho SG, Kang HK, Kwak HW, et al. Skin prick tests and allergen-specific IgE tests for fungus in patients with chronic lower respiratory symptoms. Korean J Asthma Allergy Clin Immunol. 2009; 29:33–38.
18. Park HJ, Lee JH, Park KH, Ann HW, Jin MN, Choi SY, et al. A nationwide survey of inhalant allergens sensitization and levels of indoor major allergens in Korea. Allergy Asthma Immunol Res. 2014; 6:222–227.
19. Lee YW, Sohn JH, Lee JH, Hong CS, Park JW. Allergen-specific IgE measurement with the IMMULITE 2000 system: intermethod comparison of detection performance for allergen-specific IgE antibodies from Korean allergic patients. Clin Chim Acta. 2009; 401:25–32.
20. Kim KH, Kim KT, Lee SK, Park HS, Lee YM, Nahm DH, et al. Sensitization rates for inhalant allergens in patients with respiratory allergy in Busan. Korean J Asthma Allergy Clin Immunol. 2005; 25:59–63.
21. Kim TB, Kim KM, Kim SH, Kang HR, Chang YS, Kim CW, et al. Sensitization rates for inhalant allergens in Korea; a multi-center study. J Asthma Allergy Clin Immunol. 2003; 23:483–493.
22. Kanceljak-Macan B, Macan J, Plavec D, Klepac T, Milkovic-Kraus S. The 3 mm skin prick test (SPT) threshold criterion is not reliable for Tyrophagus putrescentiae: the re-evaluation of SPT criterion to dust mites. Allergy. 2002; 57:1187–1190.
23. Alonso R, Botey J, Pena JM, Eseverri JL, Marin A, Ras RM. Specific IgE determination using the CAP system: comparative evaluation with RAST. J Investig Allergol Clin Immunol. 1995; 5:156–160.
24. Axetn R, Drevin H, Kober A, Yman L. A new laboratory diagnostic system applied to allergy testing. N Engl Reg Allergy Proc. 1988; 9:503–508.
25. Leimgruber A, Mosimann B, Claeys M, Seppey M, Jaccard Y, Aubert V, et al. Clinical evaluation of a new in-vitro assay for specific IgE, the immuno CAP system. Clin Exp Allergy. 1991; 21:127–131.
26. Bousquet J, Chanez P, Chanal I, Michel FB. Comparison between RAST and Pharmacia CAP system: a new automated specific IgE assay. J Allergy Clin Immunol. 1990; 85:1039–1043.
27. Ollert M, Weissenbacher S, Rakoski J, Ring J. Allergen-specific IgE measured by a continuous random-access immunoanalyzer: interassay comparison and agreement with skin testing. Clin Chem. 2005; 51:1241–1249.
28. Jiang XD, Li GY, Dong Z, Zhu DD. Correlation analysis of two serum-specific immunoglobulin E test systems and skin-prick test in allergic rhinitis patients from Northeast China. Am J Rhinol Allergy. 2011; 25:116–119.
29. Skassa-Brociek W, Manderscheid JC, Michel FB, Bousquet J. Skin test reactivity to histamine from infancy to old age. J Allergy Clin Immunol. 1987; 80:711–716.
30. Lee MK, Lee WY, Yong SJ, Shin KC, Lee SN, Lee SJ, et al. Sensitization rates to inhalant allergens in patients visiting a University Hospital in Gangwon region. Korean J Asthma Allergy Clin Immunol. 2011; 31:27–32.
31. Arbes SJ Jr, Gergen PJ, Elliott L, Zeldin DC. Prevalences of positive skin test responses to 10 common allergens in the US population: results from the third National Health and Nutrition Examination Survey. J Allergy Clin Immunol. 2005; 116:377–383.
32. Williams PB, Dolen WK, Koepke JW, Selner JC. Comparison of skin testing and three in vitro assays for specific IgE in the clinical evaluation of immediate hypersensitivity. Ann Allergy. 1992; 68:35–45.
 XML Download