

This article has been corrected. See "ERRATUM: Affiliation Correction. Evaluation of the association of vegetation of allergenic plants and pollinosis with meteorological changes" in Volume 3 on page 236.
 PDF
PDF ePub
ePub Citation
 Print
Print


Abstract
Purpose
There are a number of reports suggesting that widespread propagation of weeds and high concentration of weed pollen have been contributed to climate change. We investigated the interrelationship between allergenic pollen concentration, allergic symptom and meteorological factor.
Methods
We collected data of pollen concentration and meteorological factors in 7 stations nationwide during between 1998 and 2012. We recruited total 297 allergic patients sensitized to weed pollens from each station, conducted a survey about allergic symptom, and calculated symptom index. We surveyed the vegetation area of ragweed and Japanese hop. Based on these data, we performed the long-term trend analysis (X11-ARIMA, autoregressive integrated moving average) on regional pollen concentration, and correlation analysis to investigate the interrelation between weed pollen concentration, allery symptom index and meteorological factor. We have also done regression analysis on vegetation area and maximal pollen concentration.
Results
Long-term trend analysis showed the increasing trend of pllen concentration in Seoul. Weed pollen concentration, allergy symptom index and each meteorological factor were not correlated significantly. Regression analysis revealed that increase of weed vegetation area results in increase of weed pollen concentration. Through this regression equation, we estimated the vegetation area that can product pollen concentration triggering allergenic risk.
Conclusion
Meteorological factors, pollen concentration and allergic symptoms should be consistently assessed and the relationship between each factor should be analyzed, considering climate change. It is necessary to verify the equation for pollen estimation by vegetation area and set up a policy for vegetation control focused on the reduction of allergenic pollen.
Figures and Tables
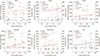
 | Fig. 2Long-term trends of pollen concentration from each allergenic plants at Seoul by using statistical analysis (X11-ARIMA, autoregressive integrated moving average).
|
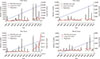
 | Fig. 3Comparison between mean temperature, weed pollen concentration and allergic rhinitis symptom index at six areas in Korea. meanT, mean temperature; symptom index.
|
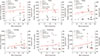
 | Fig. 4Comparison between accumulated temperature (degree days), weed pollen concentration and allergic rhinitis symptom index at six areas in Korea. accumT, accumulated temperature; SI, symptom index.
|
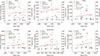
 | Fig. 5Comparison between 7-day sunshine hours, weed pollen concentration and allergic rhinitis symptom index at six areas in Korea. AS, accumulated sunshine; SI, symptom index.
|
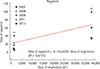 | Fig. 6The linear regression between the vegetation area of ragweed and the maximum daily concentration of their pollens for guideline of allergenic weeds.
|
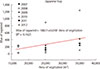 | Fig. 7The linear regression between the vegetation area of Japanese hop and the maximum daily concentration of their pollens for guideline of allergenic weeds.
|
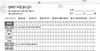
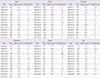
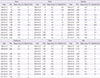
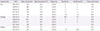
Table 1
Yearly comparison of peak pollen concentration of allergenic trees except pine from six areas in Korea associated with meteorological factors
![]()
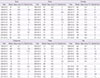
Table 2
Yearly comparison of peak pollen concentration of pine tree from six areas in Korea associated with meteorological factors
![]()
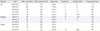
Table 3
Yearly comparison of peak pollen concentration of allergenic weeds from six areas in Korea associated with meteorological factors
![]()
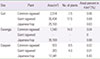
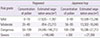
Table 5
The meteorological factor and max concentration of ragweed on max flowering date in Guri, Gwangju, and Daejeon
![]()
References
1. Lewis WH, Vinay P, Zenger VE. Airborne and allergenic pollen of North America. Baltimore: Johns Hopkins University Press;1983. p. 105–127.
2. Oh JW, Kang IJ, Kim SW, Kook MH, Kim BS, Shin KS, et al. The correlation between increased sensitization rate to weeds in children and the annual increase in weed pollen in Korea. Pediatr Allergy Respir Dis. 2006; 16:114–121.
3. Oh YC, Kim HA, Kang IJ, Cheong JT, Kim SW, Kook MH, et al. Evaluation of the relationship between pollen count and the outbreak of allergic diseases. Pediatr Allergy Respir Dis. 2009; 19:354–364.
4. Kim JH, Oh JW, Lee HB, Kim SW, Kang IJ, Kook MH, et al. Changes in sensitization rate to weed allergens in children with increased weeds pollen counts in Seoul metropolitan area. J Korean Med Sci. 2012; 27:350–355.

5. Frenguelli G. Interactions between climatic changes and allergenic plants. Monaldi Arch Chest Dis. 2002; 57:141–143.
6. Oh JW, Lee HB, Kang IJ, Kim SW, Park KS, Kook MH, et al. The revised edition of korean calendar for allergenic pollens. Allergy Asthma Immunol Res. 2012; 4:5–11.
7. Oh JW, Lee HR, Kim JS, Lee KI, Kang YJ, Kim SW, et al. Aerobiological study of pollen and mold in the 10 states of Korea. Pediatr Allergy Respir Dis. 2000; 10:22–33.
8. Singer BD, Ziska LH, Frenz DA, Gebhard DE, Straka JG. Increasing Amb a1 content in common ragweed (Ambrosia artemisiifolia) pollen as a function of rising atmospheric CO2 concentration. Funct Plant Biol. 2005; 32:667–670.
9. Løwenstein H. Quantitative immunoelectrophoretic methods as a tool for the analysis and isolation of allergens. Prog Allergy. 1978; 25:1–62.
10. Emith EG. Sampling and identifying allergenic pollens and molds: an illustrated identification manual for air samplers. San Antonio: Blewstone Press;1990.
11. Burge HA, Solomon WR. Sampling and analysis of biological aerosols. Atmos Environ. 1987; 21:451–456.
12. Valero A, Ferrer M, Baro E, Sastre J, Navarro AM, Marti-Guadano E, et al. Discrimination between moderate and severe disease may be used in patients with either treated or untreated allergic rhinitis. Allergy. 2010; 65:1609–1613.
13. Oh JW. Development of pollen concentration prediction models. J Korean Med Assoc. 2009; 52:579–591.
14. Lee HR, Kim KR, Choi YJ, Oh JW. Meteorological impact on daily concentration of pollens in Korea. Korean J Agric For Meteorol. 2012; 14:99–107.
15. Brown HM, Irving KR. The size and weight of common allergenic pollens. Acta Allergol. 1973; 28:132–137.
16. Gonzalez-Barcala FJ, Aboal-Vinas J, Aira MJ, Regueira-Mendez C, Valdes-Cuadrado L, Carreira J, et al. Influence of pollen level on hospitalizations for asthma. Arch Environ Occup Health. 2013; 68:66–71.
17. Ziska LH, Gebhard DE, Frenz DA, Faulkner S, Singer BD, Straka JG. Cities as harbingers of climate change: common ragweed, urbanization, and public health. J Allergy Clin Immunol. 2003; 111:290–295.
18. Wayne P, Foster S, Connolly J, Bazzaz F, Epstein P. Production of allergenic pollen by ragweed (Ambrosia artemisiifolia L.) is increased in CO2-enriched atmospheres. Ann Allergy Asthma Immunol. 2002; 88:279–282.
19. Wittenberg R, Cock MJW. Invasive alien species. How to address one of the greatest threats to biodiversity: a toolkit of best prevention and management practices. Oxon: CAB international;2001.
20. Ehara K. Comparative morphological studies on the hop (Humulus lupulus L.) and the Japanese hop (H. Japoaucus Sieb. ET ZUCC.). J Fac Agric Kyushu Univ. 1956; 10:307–324.
 XML Download