

 PDF
PDF ePub
ePub Citation
 Print
Print


Introduction
In Korea, the number of bicycles used for transport had been increasing every year.16) Following this trend, cycling infrastructure, such as bicycle-only roads, has been built in many places over the past few years. Despite these efforts, approximately 11,000 bicycle accidents occur yearly in Korea.19)
Head injury is the main cause of death and severe disability in bicycle-related injuries, and is more common in children, adolescents, and elderly people than young adults.312) It is responsible for an increased need for hospitalization and eventually imposes significant healthcare costs on individuals and society.14)
Although there are many reports on the risk factors and epidemiology of bicycle-related injury in the literature,461122) research on bicycle-related head injury in the neurosurgery department is rare. Therefore, we analyzed patients who were admitted to the neurosurgery department of our hospital for bicycle-related head injury over a 10-year period. The purpose of this study was to evaluate the severity and outcome of bicycle-related head injuries according to various demographic characteristics and injury mechanisms and identify the main risk factors and common types of accompanying injuries.
Go to : 
Materials and Methods
We collected data on patients admitted to the neurosurgery department of our hospital for bicycle-related head injuries between 2007 and 2016. This data included demographic characteristics (age at time of injury and sex), circumstances of the crash, patient status (mental status and neurologic examination) at the time of admission and discharge, and diagnosis and radiographic findings of head or associated injuries.
A bicycle-related injury was defined as an injury that occurred while riding a bicycle. Pedestrians injured by a bicycle were excluded. A bicycle was defined as a two-wheeled vehicle without engine, which also included electrical-assist bicycles and mountain bikes. Head injury was defined as having a fracture of the vault or base of skull, intracranial hemorrhage, or concussion.
Grade of head injury severity was categorized as follows: 1) Minimal: Glasgow Coma Scale (GCS) 15 and no loss of consciousness (LOC); 2) Mild: GCS 14 or GCS 15 plus brief LOC (<5 min); 3) Moderate: GCS 9–13 or LOC ≥5 min or focal neurologic deficit; and 4) Severe: GCS 3–8.17) Outcome at discharge was assessed using the Glasgow Outcome Scale (GOS).8) Poor outcome was defined as GOS ≤3.
Head injury types were diagnosed by radiographic findings. All patients underwent computed tomography (CT). Some of them underwent magnetic resonance imaging (MRI), too. We used both imaging modalities to calculate the type of head injury.
Accompanying injuries were classified according to anatomical body part. They included fractures, ligament injuries, major vessel or nerve injuries, and internal organ injuries confirmed by imaging findings, most of which were at least 2 on the abbreviated injury scale.7) They did not include superficial injury, such as laceration, abrasion or bruise, or simple fracture, such as nasal bone fracture, simple rib fracture, or single digit fracture.
Data were analyzed using the SPSS software (IBM SPSS Statistics 24.0 for Windows; IBM Inc., Armonk, NY, USA). The chi-square test, Fisher's exact test, linear-by-linear test, and logistic regression analysis were used for univariable analysis. The odds ratio (OR) and 95% confidence interval (CI) were calculated. Multivariable logistic regression analysis was used to calculate adjusted OR for independent predictors found to be significant on univariable analysis. A p-value <0.05 was considered statistically significant.
This study is part of a retrospective case-control study of risk factors and bicycle-related head injury. We compared the differences in age, sex, and cause of injury according to the severity and outcome of head injury. We also described the frequency of head injury types and associated injuries.
Go to :
Results
Patient characteristics
All 205 patients were admitted to the neurosurgery department of our hospital for bicycle-related head injuries between 2007 and 2016. Of these, 26.8% and 28.3% of the patients were under 18 years of age and over 65 years of age, respectively. There were 4 times as many men as women. There were fewer patients during the winter than during other seasons (Table 1).
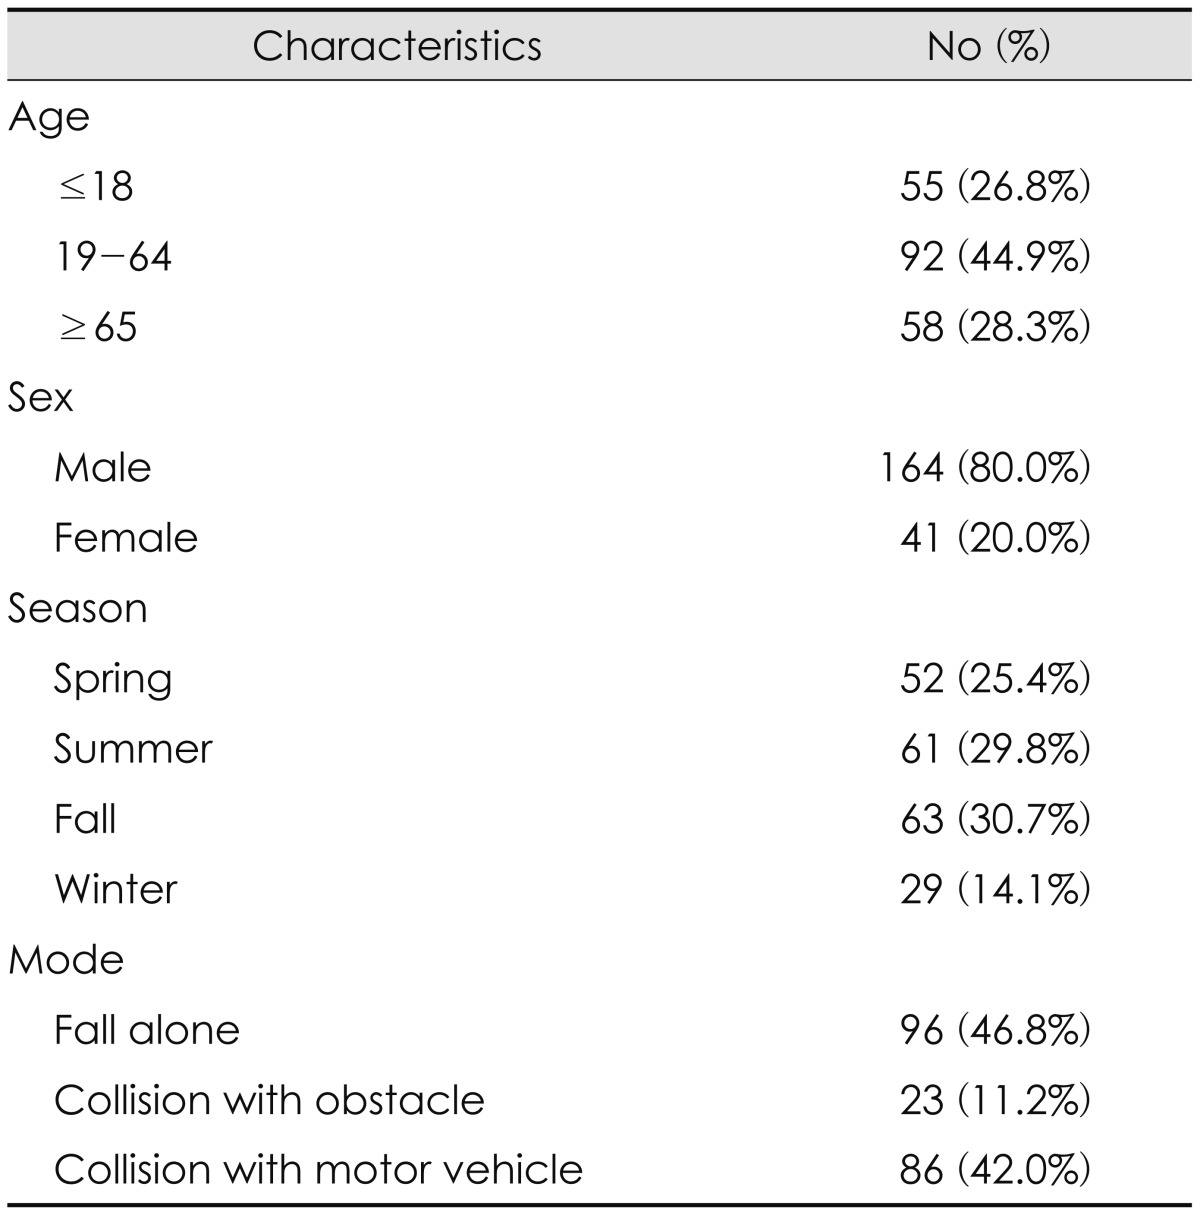
The most common mechanism of bicycle-related head injury was a fall alone (46.8%). The next was a collision with a motor vehicle (42.0%), such as a motor bike, a passenger car, or a truck. Collision with an obstacle, such as a pedestrian, an electric pole, or a wall, and collision with another bicycle was less frequent (11.2%) (Table 1).
Correlation of injury mechanism with severity and outcome of head injury
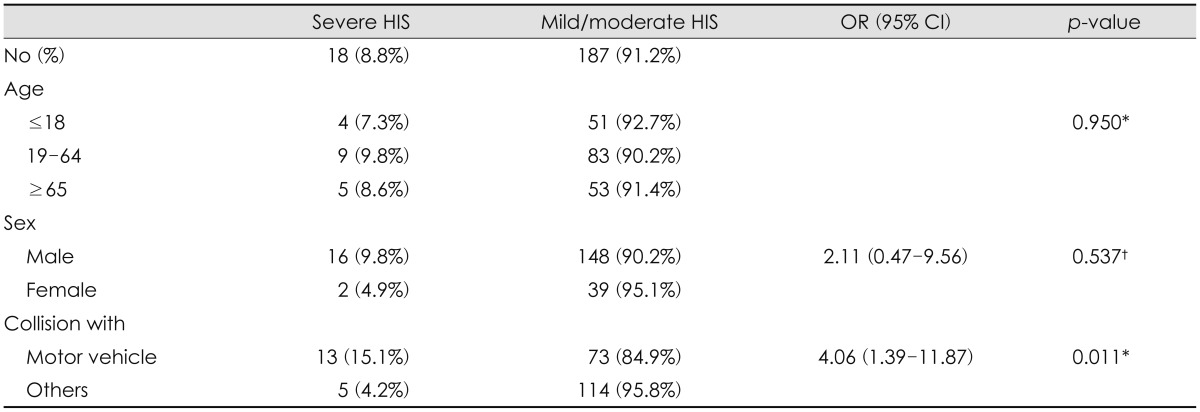
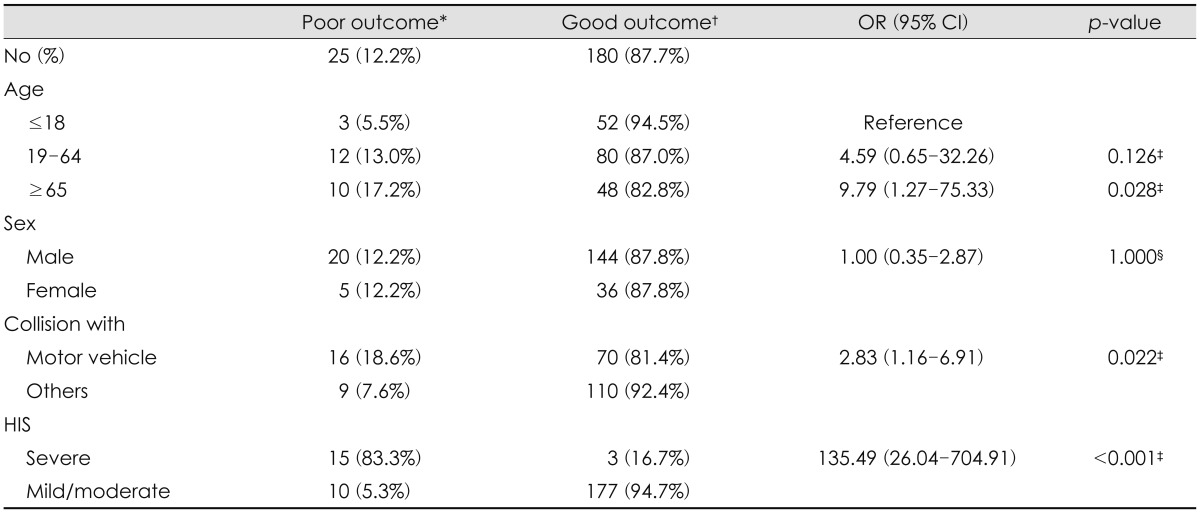
Although most patients had minimal or mild grade of head injury severity and a good outcome (GOS ≥4), 18 (8.8%) showed high grade of head injury severity and 25 (12.2%) showed a poor outcome (GOS ≤3). In all, 35 patients (17.1%) underwent surgery for decompression or hematoma removal and 13 (6.3%) died in the hospital.
Collision with a motor vehicle increased the risk of severe head injury (OR, 4.06; 95% CI, 1.39–11.87; p=0.011) and resulted in poor outcomes (OR, 2.83; 95% CI, 1.16–6.91; p=0.022). Age over 65 years did not increase the severity of head injury but resulted in poor outcomes (OR, 9.79; 95% CI, 1.27–75.33; p=0.028) compared with younger age. High grade of head injury severity also resulted in poor outcomes (OR, 135.49; 95% CI, 26.04–704.91; p< 0.001). There was a trend for male gender and increased severity of head injury, but this was not statistically significant (Table 2 and 3).
Head injury types
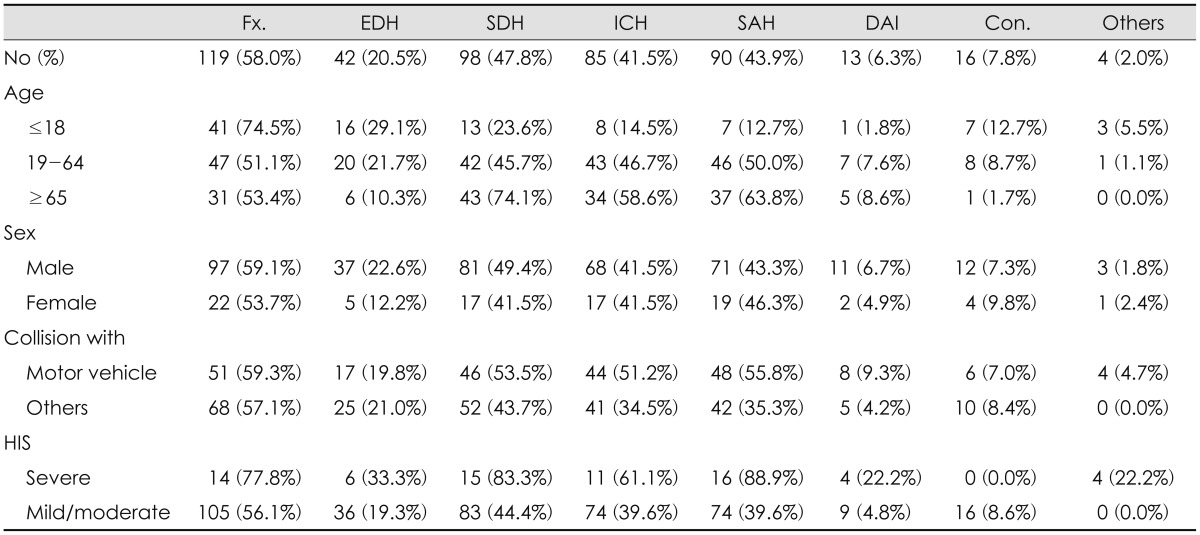
Patients most commonly had a skull fracture (58.0%), followed by subdural hemorrhage (SDH) (47.8%), subarachnoid hemorrhage (SAH) (43.9%), and intracerebral hemorrhage (ICH) or hemorrhagic contusion (41.5%). Epidural hemorrhage (EDH) (20.5%) and diffuse axonal injury (6.3%) less commonly occurred. A total of 35 patients (17.1%) underwent surgery for decompression or hematoma removal. Younger patients had more a skull fracture (p=0.026) or EDH (p=0.014), and older patients had more a SDH (p<0.001), SAH (p<0.001), or ICH or hemorrhagic contusion (p<0.001). Patients who collided with a motor vehicle were more likely to have a SAH (p=0.004) or intracerebral hemorrhage or hemorrhagic contusion (p=0.021), and patients who had severe head injury were more likely to have a SDH (p=0.002), SAH (p<0.001), or diffuse axonal injury (p=0.018). There was no statistical difference of sex in the type of head injury (Table 4).
Accompanying injuries
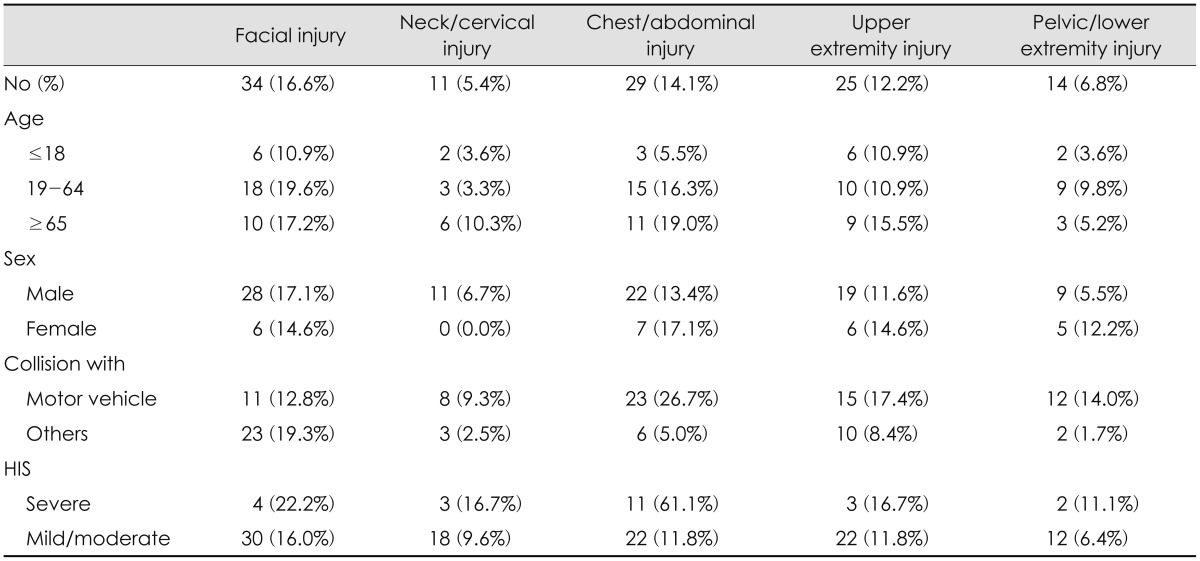
More than one-third (37.6%) of patients had at least one accompanying injury. Facial injuries (16.6%), chest/abdominal injuries (14.1%), and upper extremity injuries (12.2%) were relatively common, while neck/cervical injuries (5.4%) and pelvic/lower extremity injuries (6.8%) were less common. Collision with a motor vehicle caused more accompanying chest/abdominal (OR, 7.67; 95% CI, 2.88–20.42; p<0.001) and pelvic/lower extremity injuries (OR, 9.49; 95% CI, 2.06–43.59; p=0.001) than other mechanisms. Older age and high grade of head injury severity frequently combined accompanying chest/abdominal injuries (OR, 4.96; 95% CI, 1.14–21.46; p<0.032 and OR, 16.31; 95% CI, 5.30–50.19; p<0.001, respectively) compared with younger age and low grade of head injury severity. There was no statistical difference of sex in the type of head injury (Table 5).
Go to :
Discussion
This study provides important information on the severity, outcome, type, and accompanying injuries of bicycle-related head injuries according to various demographics and injury mechanisms. The severity of these injuries treated in our hospital's neurosurgery department varied. Although most were mild, some were severe. Collision with motor vehicle is one of the most important risk factor for high grade of head injury severity. This finding is consistent with previous reports on bicycle-related head injuries. Kraus et al.9) reported that bicycle-related brain injuries from collision with motor vehicle were more severe and had less satisfactory outcomes than those resulting from other causes. The difference between that study and our study is that in our study older patients had poorer outcomes than younger patients. To prevent these collisions with motor vehicle, cycling infrastructure such as bicycle-only roads and appropriate regulations on bicycles and motor vehicles at intersections and alleys is necessary.
Bicycle-related head injuries are often accompanied by injuries of other parts of the body. The head, face, upper extremity, and upper trunk were the most commonly injured body parts in bicycle-related injuries.213) Approximately one-third of patients with bicycle injuries sustained two or more injuries like our study.1518) In our study, collision with a motor vehicle and high grade of head injury severity frequently combined accompanying chest/abdominal injuries than other mechanisms and low grade of head injury severity. Therefore, an evaluation of the entire body, especially the chest and abdomen, and a professional trauma team are essential when a bicycle-related head injury occurred.
There are many studies showing a helmet is effective in lowering the incidence and severity of bicycle-related head injuries.202123) A recent meta-analysis suggests that bicycle helmet use reduced severe head injury and facial injury, but neck injury was not related to helmet use.1510) Unfortunately, helmet use was not accurately recorded in our data, so we could not assess the relationship between bicycle helmet use and severe head injury. However, it is necessary to research and popularize the helmet as well as other protective equipment, such as chest protectors, elbow pads and wrist guards.
There are limitations to our study. The data were obtained from a single tertiary medical center; thus, the data may not be representative of the population of cyclists in Korea. Compared with the population using bicycles for commuting in Korea,16) our patients were more likely to be older and male. In addition, patients with more severe or multiple injuries would have been included. To accurately identify other risk factors and associated injuries, further multicenter and randomized studies containing information on helmet and alcohol use are needed.
In our study, almost all head injury types were based on CT alone except some cases. Because most imaging findings of diffuse axonal injury are based on MRI, the incidence of diffuse axonal injury may be underestimated.
Go to :
 XML Download