

 PDF
PDF ePub
ePub Citation
 Print
Print


Introduction
Chronic subdural hematoma (CSDH) is one of the most common types of intracranial (IC) hemorrhage that occurs at a rate of 1 to 2 per 100,000 per year.1516) With advances in computed tomography (CT), brain scans, magnetic resonance imaging (MRI), and molecular biologic technologies, the mechanisms of development, evolution, recurrence and risk factors of CSDH have been identified but needed to be confirmed. Brain atrophy is one of the high risks of CSDH especially in old age. Volume quantification of brain parenchyme may provide better description of brain atrophy, as well as prediction of CSDH after head trauma, but it can be difficult and time consuming for all patients in practice. There are many kinds of traditional indirect indices of brain atrophy but correlation between indirect indices and CSDH is little known.51213) In this study, we evaluated brain atrophy of patients with head trauma by indirect indices (qualitative value) and its' influence on CSDH. We tried to find reference value of indirect indices for predicting CSDH and to correlate indirect indices and volumetric analysis of brain CT (quantitative value).
Go to : 
Materials and Methods
Patients
A retrospective study was carried out on head trauma patients admitted in our hospital from January 2009 to December 2014. Initially, 1,476 head trauma patients were found and 530 patients were over 65 years old. 304 patients of 530 patients were finally remained after following exclusion criteria;
1) Patient with initially diagnosed IC hematoma who required surgery at admission.
2) Patients who underwent surgery within 7 days due to hematoma aggravation after head trauma.
3) Patients with initial Glasgow Coma Scale under 12.
4) Patients who had IC space-occupying lesion or brain edema.
5) Patients who had delayed CSDH within 3 weeks.
Among 304 patients who were not operated at acute or subacute phase, 41 patients had CSDH over 3 weeks after initial head trauma and classified as Group A. Gender and age matched (±5 years) 41 patients of 263 patients were randomly selected as a control group and classified as Group B. All patients' medical records were reviewed including history of diabetes mellitus (DM), hypertension (HTN), cerebral infarction, cardiac disease, hematologic disease and epilepsy.
Volumetric analysis of CT (quantitative value)
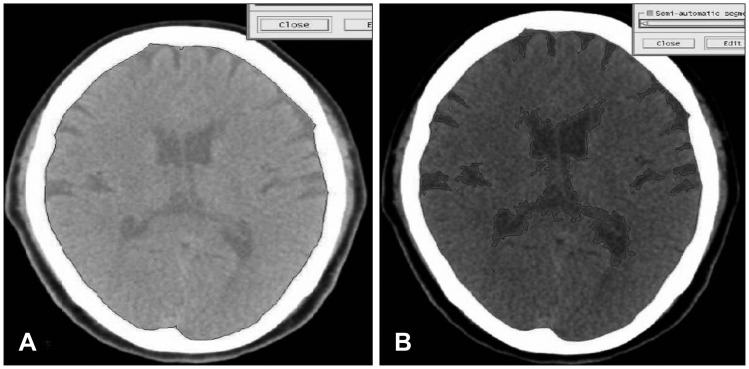
Volume measurement of Gamma-Plan program (Elekta instrument AB, Stockholm, Sweden) by sequential volume mapping was used to access quantitative volume of brain except cerebellum. Each slice was blindly analyzed by 2 neurosurgeons and 1 medical physicist and final evaluation was made by consensus between 3 raters. Brain atrophy index was defined as the ratio of cerebrospinal fluid (CSF) volume to IC volume as expressed in percentage.419) [brain atrophy index (%)=(1-CSF volume/IC volume)×100] (Figure 1).
Indices of brain atrophy (qualitative value)
Similar to volumetric analysis, 3 raters measured the following 5 traditional indirect indices of brain atrophy.
1) Evans index (EI)-Typically used as a measure of ventricle volume. EI is measured as the ratio of the maximal width of the frontal horns to internal width of cranium.3) Both diameters were measured in the same CT slice.
2) Frontal horn index (FHI)-FHI was measured as the ratio between the maximal width of both frontal horns and the width of the whole brain at the same level.15)
3) Bicaudate ratio (BCR)-Typically used as a measure of internal cerebral atrophy. The axial slice on which the caudate nuclei produced the greatest amount of indentation on the lateral ventricles was identified, and the distance between the 2 caudate apices was measured. This value was divided by the maximum width of the skull at the same level as the caudate measurement.214)
4) Sylvian fissure ratio (SFR)-Typically used as a measure of external cerebral atrophy. The average of the maximum width of the 2 sylvian fissures on the section showing them at their widest was divided by the trans-pineal coronal inner table diameter.14)
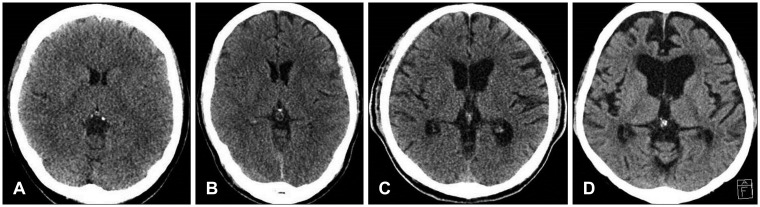
5) Cortical atrophy scale-It was devised by Scheltens and colleagues.11) Scores 0-3 represent absent, mild, moderate and severe cortical atrophy, respectively. Mild changes are said to be present when there is sulci opening peripherally. Moderate changes are seen when there is widening along the length of the sulcus. Severe atrophy is present when there is gyrus thinning. In this article, we assumed that patients had cortical atrophy when cortical atrophy scale was over moderate grade (Figure 2).
Statistical analysis
Statistical analysis was carried out with the Windows version of SPSS Version 20.0 (SPSS Inc., Chicago, IL, USA). Student t-test and chi-square were utilized for difference between groups; in addition, linear regression was used to quantify the relationship between brain volume and indices of brain atrophy. And linear regression with 95% confidence interval was used to identify the correlation between CSDH and indices of brain atrophy. A p-value of less than was considered as statistically significance.
Go to :
Results
Patient characteristics
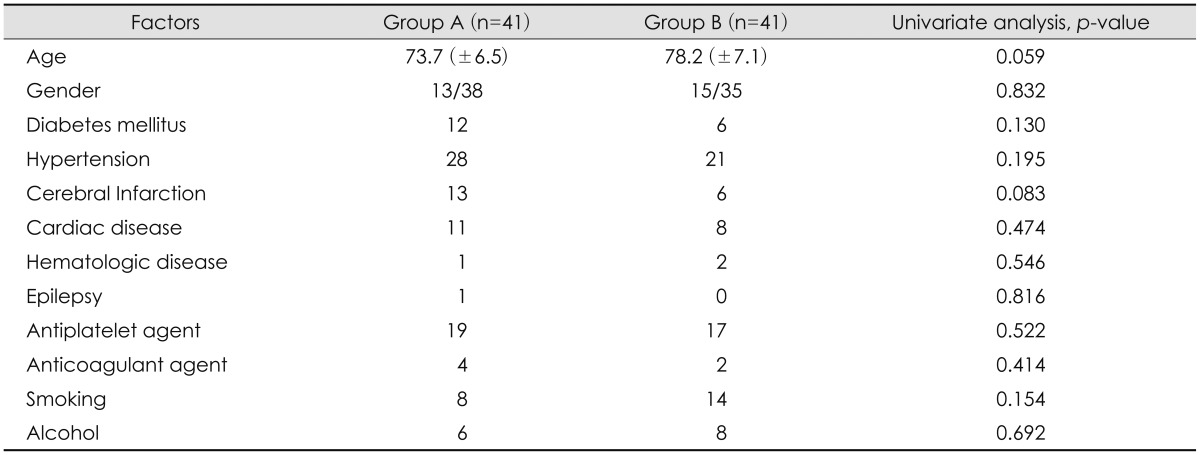
The mean age was 73.7 years Group A, and 78.2 years in Group B (p=0.059). Among 82 patients, 36 patients took antiplatelet agents; 19 patients of Group A and 17 patients of Group B and there was no statistically significant (p=0.522). History of cerebral infarction showed higher percentage in Group A than Group B, with borderline significance (p=0.083). Gender, DM, HTN, smoking, anticoagulation agent and history of heart disease, epilepsy, hematologic disease had no statistical significance between 2 groups. We summarized all results in Table 1.
Correlation between indirect indices and quantitative volume
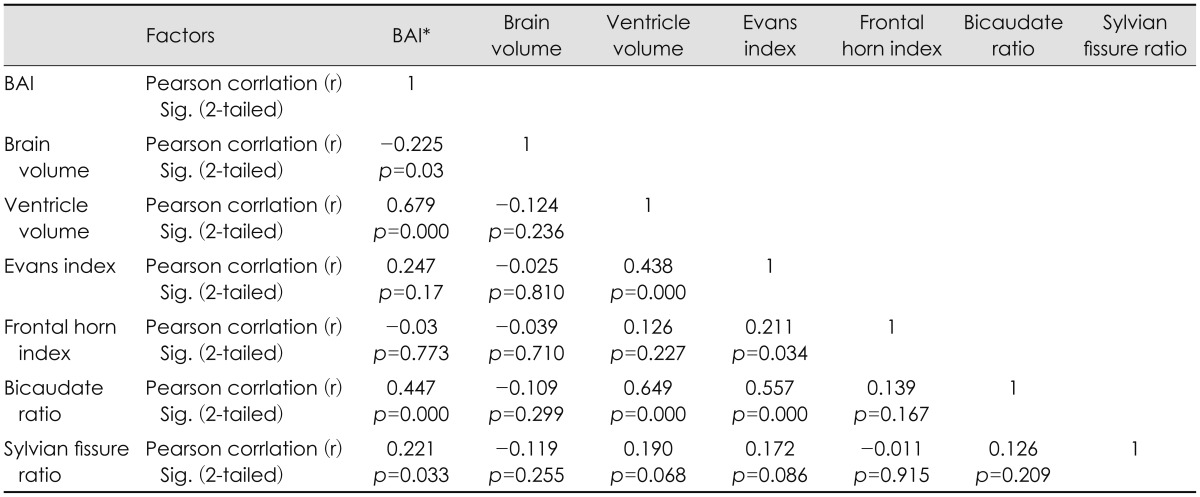
BCR and EI had significant and moderately strong correlation with ventricle volume (r=0.679, r=0.44, p=0.000, respectively). BCR (r=0.447, p=0.000) was the most significant influencing factor for brain atrophy, followed by EI (r=0.247, p=0.17), and SFR (r=0.221, p=0.033). BCR also had correlation with volume of cortical subarachnoid space, but correlation coefficient was low (r=0.247, p=0.02). On the other hand, there was no relationship between indirect indices and brain hemisphere volume. All results were shown in Table 2.
Volumetric analysis (quantitative value)
In quantitative study, brain volume was 1,158.1 mL in Group A and 1,130.6 mL in Group B (p=0.45). Ventricle volume was 50.8 mL in Group A and 42.5 mL in Group B and volume of cortical subarachnoid space was 89.2 mL in Group A and 85.2 mL in Group B with no statistically significance, respectively (p=0.19, p=0.79). There was a higher degree of brain atrophy index in Group A (9.08%) than Group B (6.38%), with statistical significance (p=0.003). All results are shown in Table 3.
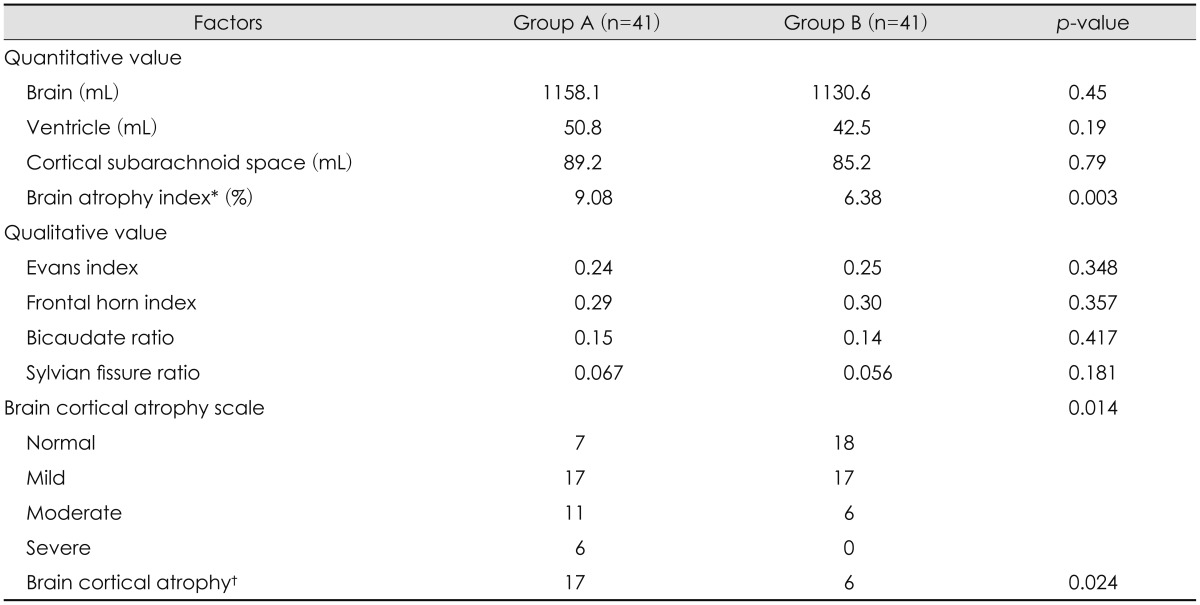
Indirect indices analysis (qualitative value)
EI was 0.24 of Group A and 0.25 of Group B and there was no statistical significance (p=0.348). FHI was 0.29 of Group A and 0.3 of Group B without statistical significance. In BCR and SFR, there was higher tendency in Group A than Group B but, there was no statistical significance. On the other hand, cortical atrophy scale and brain cortical atrophy had statistical significance (p=0.014, p=0.024, respectively). All results are shown in Table 3.
Cortical atrophy scale had statistically significant between Group A and B (p=0.014). In brain cortical atrophy (2 or 3 of cortical atrophy scale), there was 17 patients in Group A and 6 patients in Group B with statistical significance (p=0.024).
Predisposing factors of CSDH
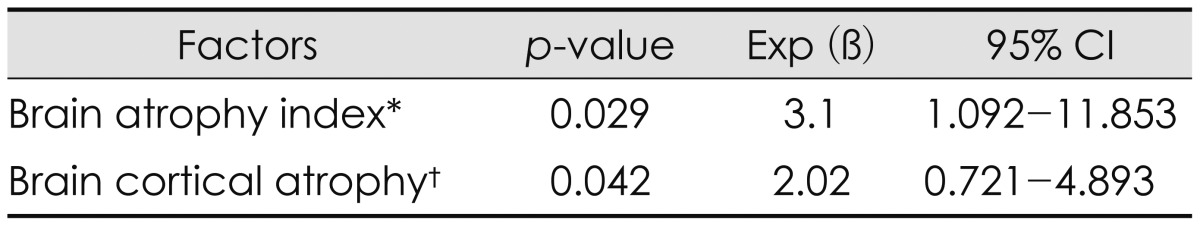
The multivariate analysis of the potential predisposing factors for the CSDH was done and there was statistically significant in brain atrophy index (p=0.029) and cortical atrophy scale (p=0.042). Results were shown in Table 4.
Go to :
Discussion
Patient characteristics
In initial study design, we tried to reduce the effect of other factors on chronic subdural hemorrhage except for indirect indices. So, age and gender matched 41 patients were randomly selected as the control group. In chi-square analysis, there was no statistically significant factors between 2 groups, and this can be considered that performance of random sampling was appropriate.
Brain atrophy
Recently, increasing of older peoples and patients had antiplatelet or anticoagulant treatment, CSDH patients have been increased. There are many reports that attempted to confirm predisposing factors, because CSDH patients are diagnosed after a few weeks from trauma. Among many predisposing factors, brain atrophy has been reported as reliable factor.51219)
Direct or indirect head trauma can cause injury of the bridging vein or Mittenzweig's vessels, resulting in hematoma in the subdural space. Subsequently, acute hematoma can undergo absorption through hemolysis or gradual enlargement to cause symptoms. In this process, brain atrophy allows ease of separation of the dura-arachnoid inter-space on head trauma, with resultant fibrin deposits and accumulation of serum and exudates that induce proliferation of granulation tissue on the inner dural surface. This proliferation of dura results in production of neo-membrane and subsequent growth of new vessels directly within the subdural space. The repeated micro-bleeding from these vessels cause CSDH.8101718)
Yang et al.19) analyzed degree of brain atrophy in 19 patients of CSDH and 76 age-matched patients as control group and reported that there was higher degree of brain atrophy in CSDH group. In their study, mean brain atrophy index was 14.3% and even stronger predictor of CSDH especially for younger patients under 65 years old. In our study analyzed older patients over 65 years old, mean brain atrophy index was 9.08% of CSDH patients with statistical significant and also predisposing factors for the CSDH.
Qualitative and quantitative volumetric analysis
There are several previous studies to estimate part or total volume of a structure or region of interest. Qualitative indices are useful in diagnosis and estimation of disease, but it is important to select an appropriate index depending on disease and purpose.
In order to estimate correlation between brain atrophy and indirect indices of brain atrophy, multiple linear regression analysis was conducted. BCR and SFR had positive correlation with brain atrophy index with statistically significant but other indices had no correlation. However, both indices had low correlation coefficient with brain atrophy index, so it seemed to be hard to give a good estimate of brain atrophy.
EI is usually used to estimate ventricle volume especially for hydrocephalus.3) In 2005, the idiopathic normal pressure hydrocephalus (INPH) guidelines9) recommended that a value of EI above 0.3 on CT or MRI was defined as ventricular dilation. In our study, EI was even slightly higher in 0.25 of control group than 0.24 of CSDH group. EI had positive correlation with quantitative ventricle volume but not in brain atrophy index.
Cortical atrophy scale is usually used in neurology to study degenerative neuronal disease.6) In initial analysis, there was no patient in control group who had severe grade of cortical atrophy scale. So it was hard to see there was meaningful result of cortical atrophy scale between 2 groups. In this regard, we divided patients based on value of cortical atrophy scale over 2 or not and there was statistical significance between 2 groups. Möller et al.7) reported that cortical atrophy scale was quantitatively validated and reliably reflected brain atrophy compared with volumetric analysis on MRI. In multiple regression analysis of 5 indirect indices and brain atrophy index, cortical atrophy and brain atrophy index had statistical significant. Cortical atrophy scale has shown to be a quick and reproducible method to assess the degree of atrophy in practice.
There were some limitations in our study due to its retrospective nature. In radiologic features, MRI can be more appropriate for quantitative as well as qualitative evaluation, but brain CT is usually taken at the time of traumatic brain injury. Intra-rater reliability for cortical atrophy scale is high; however, there is a need to confirm inter-rater reliability.
Go to :
Conclusion
Brain atrophy is a potential prognostic factor of CSDH after trauma. In practice, indirect indices are used to estimate brain atrophy and cortical atrophy scale had better prediction of CSDH in qualitative and quantitative volumetric analysis. Careful image interpretation is needed for early diagnosis of CSDH.
Go to :
 XML Download