

 PDF
PDF ePub
ePub Citation
 Print
Print


Abstract
Objectives
To evaluate changes in subfoveal choroidal thickness (SFCT) and macular thickness as measured by enhanced depth imaging spectral-domain optical coherence tomography (EDI-OCT) after argon laser panretinal photocoagulation (PRP) in patients with severe diabetic retinopathy.
Methods
This prospective, comparative case series included 21 patients (28 eyes) with severe diabetic retinopathy. All patients underwent three sessions of PRP. The SFCT and macular thickness were measured using EDI-OCT at baseline and one week after completion of 3 sessions of PRP.
Results
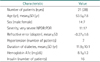
SFCT before PRP was 318.1±96.5 µm and increased to 349.9±108.3 µm; P=0.001 after PRP. Macular thickness significantly increased at one week after PRP from 273.1±23.9 µm at baseline 295.8±25.3 µm at one week; (P<0.001). No significant relationship between the changes in macular thickness and SFCT was observed (r=−0.13, P=0.52).
Figures and Tables
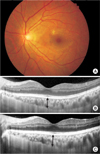 | Fig. 1Retinal images of a 47-year-old man with bilateral proliferative diabetic retinopathy. (A) Fundus photograph before panretinal photocoagulation shows no abnormalities on fovea centralis. (B,C) Enhanced depth imaging spectral-domain optical coherence tomography (EDI-OCT) images of the left eye at baseline (B) and one week after completion of panretinal photocoagulation (C). Note that both subfoveal choroidal thickness and central subfield thickness increased from 322 µm to 360 µm and from 294 µm to 312 µm, respectively. Arrows indicate the site of measurement of choroidal thickness.
|
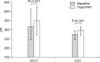 | Fig. 2Subfoveal choroidal thickness (SFCT) and central subfield thickness (CST) measurements at baseline and one week after panretinal photocoagulation (PRP). Optical coherence tomography revealed a statistically significant increase in SFCT and CST one week after PRP.
|
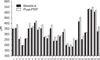 | Fig. 3Change of subfoveal choroidal thickness observed in individual subjects. PRP, panretinal photocoagulation.
|
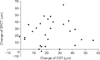 | Fig. 4Scatter plot showing changes in subfoveal choroidal thickness (SFCT) and central subfield thickness (CST). A significant linear correlation between changes in SFCT and CST is not noted (r=-0.13, P=0.52).
|

References
1. Photocoagulation treatment of proliferative diabetic retinopathy. Clinical application of Diabetic Retinopathy Study (DRS) findings, DRS Report Number 8. The Diabetic Retinopathy Study Research Group. Ophthalmology. 1981; 88:583–600.
2. Ferris FL 3rd. Photocoagulation for diabetic retinopathy. Early Treatment Diabetic Retinopathy Study Research Group. JAMA. 1991; 266:1263–1265.
3. Early photocoagulation for diabetic retinopathy. ETDRS report number 9. Early Treatment Diabetic Retinopathy Study Research Group. Ophthalmology. 1991; 98:5 Suppl. 766–785.
4. Pahor D. Visual field loss after argon laser panretinal photocoagulation in diabetic retinopathy: full-versus mild-scatter coagulation. Int Ophthalmol. 1998; 22:313–319.
5. Blondeau P, Pavan PR, Phelps CD. Acute pressure elevation following panretinal photocoagulation. Arch Ophthalmol. 1981; 99:1239–1241.
6. Yuki T, Kimura Y, Nanbu S, Kishi S, Shimizu K. Ciliary body and choroidal detachment after laser photocoagulation for diabetic retinopathy: a high-frequency ultrasound study. Ophthalmology. 1997; 104:1259–1264.
7. Lerner BC, Lakhanpal V, Schocket SS. Transient myopia and accommodative paresis following retinal cryotherapy and panretinal photocoagulation. Am J Ophthalmol. 1984; 97:704–708.
8. Shimura M, Yasuda K, Nakazawa T, Abe T, Shiono T, Iida T, et al. Panretinal photocoagulation induces pro-inflammatory cytokines and macular thickening in high-risk proliferative diabetic retinopathy. Graefes Arch Clin Exp Ophthalmol. 2009; 247:1617–1624.
9. McDonald HR, Schatz H. Macular edema following panretinal photocoagulation. Retina. 1985; 5:5–10.
10. Shimura M, Yasuda K, Nakazawa T, Kano T, Ohta S, Tamai M. Quantifying alterations of macular thickness before and after panretinal photocoagulation in patients with severe diabetic retinopathy and good vision. Ophthalmology. 2003; 110:2386–2394.
11. Oh IK, Kim SW, Oh J, Lee TS, Huh K. Inflammatory and angiogenic factors in the aqueous humor and the relationship to diabetic retinopathy. Curr Eye Res. 2010; 35:1116–1127.
12. Takahashi A, Nagaoka T, Sato E, Yoshida A. Effect of panretinal photocoagulation on choroidal circulation in the foveal region in patients with severe diabetic retinopathy. Br J Ophthalmol. 2008; 92:1369–1373.
13. Margolis R, Spaide RF. A pilot study of enhanced depth imaging optical coherence tomography of the choroid in normal eyes. Am J Ophthalmol. 2009; 147:811–815.
14. Torres VL, Brugnoni N, Kaiser PK, Singh AD. Optical coherence tomography enhanced depth imaging of choroidal tumors. Am J Ophthalmol. 2011; 151:586–593.e2.
15. Maruko I, Iida T, Sugano Y, Ojima A, Ogasawara M, Spaide RF. Subfoveal choroidal thickness after treatment of central serous chorioretinopathy. Ophthalmology. 2010; 117:1792–1799.
16. Fundus photographic risk factors for progression of diabetic retinopathy. ETDRS report number 12. Early Treatment Diabetic Retinopathy Study Research Group. Ophthalmology. 1991; 98:5 Suppl. 823–833.
17. Early Treatment Diabetic Retinopathy Study design and baseline patient characteristics. ETDRS report number 7. Ophthalmology. 1991; 98:5 Suppl. 741–756.
18. Techniques for scatter and local photocoagulation treatment of diabetic retinopathy: Early Treatment Diabetic Retinopathy Study Report no. 3. The Early Treatment Diabetic Retinopathy Study Research Group. Int Ophthalmol Clin. 1987; 27:254–264.
19. Grover S, Murthy RK, Brar VS, Chalam KV. Normative data for macular thickness by high-definition spectral-domain optical coherence tomography (spectralis). Am J Ophthalmol. 2009; 148:266–271.
20. Gentile RC, Stegman Z, Liebmann JM, Dayan AR, Tello C, Walsh JB, et al. Risk factors for ciliochoroidal effusion after panretinal photocoagulation. Ophthalmology. 1996; 103:827–832.
21. Lee CJ, Smith JH, Kang-Mieler JJ, Budzynski E, Linsenmeier RA. Decreased circulation in the feline choriocapillaris underlying retinal photocoagulation lesions. Invest Ophthalmol Vis Sci. 2011; 52:3398–3403.
22. Savage HI, Hendrix JW, Peterson DC, Young H, Wilkinson CP. Differences in pulsatile ocular blood flow among three classifications of diabetic retinopathy. Invest Ophthalmol Vis Sci. 2004; 45:4504–4509.
23. Langham ME, Farrell RA, O'Brien V, Silver DM, Schilder P. Blood flow in the human eye. Acta Ophthalmol Suppl. 1989; 191:9–13.
24. Lee SB, Yun YJ, Kim SH, Kim JY. Changes in macular thickness after panretinal photocoagulation in patients with severe diabetic retinopathy and no macular edema. Retina. 2010; 30:756–760.
25. Nagaoka T, Kitaya N, Sugawara R, Yokota H, Mori F, Hikichi T, et al. Alteration of choroidal circulation in the foveal region in patients with type 2 diabetes. Br J Ophthalmol. 2004; 88:1060–1063.
26. Berkowitz BA, Sato Y, Wilson CA, de Juan E. Blood-retinal barrier breakdown investigated by real-time magnetic resonance imaging after gadolinium-diethylenetriaminepentaacetic acid injection. Invest Ophthalmol Vis Sci. 1991; 32:2854–2860.
27. Sen HA, Berkowitz BA, Ando N, de Juan E Jr. In vivo imaging of breakdown of the inner and outer blood-retinal barriers. Invest Ophthalmol Vis Sci. 1992; 33:3507–3512.
 XML Download