

 PDF
PDF ePub
ePub Citation
 Print
Print


Abstract
Purpose
The purpose of this research is to enhance organizational competitiveness of health centers as well as private medical institutions serving as public health and medical institutions. It tries to help them to cope with the requirements from health consumers, to enhance public health nurses’ job performance,
Methods
After verifying the reliability of the tool, confirmatory factor analysis was used to detect a model, in which valid path coefficients exist among variables. The detected model was then selected as the subject and its validity was verified. Finally, a structural equation model was applied to verify whether the estimate was suitable for the purpose of this research.
Results
As for the nursing organizational culture, the public health nurses considered relation-oriented culture the most desirable. As for the self-leadership, they considered self-compensation the most desirable. It was found that mediating effects of self-leadership was partially significant.
Conclusion
To enhance job performance, it is necessary to make a transition from the organizational culture to the relation-oriented culture and it is also necessary to develop a program capable of reinforcing self-leadership. In addition, it is necessary to conduct a research to verify whether such a developed self-leadership program is influential on job performance enhancement.
Go to : 
References
1. Houghton JD, Yoho SK. “Toward a contingency model of leadership and psychological empowerment: When should self-leadership be encouraged?”. Journal of Leadership and Organizational Studies. 2005; 11(4):65–84. http://dx.doi.org/10.1177/107179190501100406.

2. Kwon DY. A Study on the improvement of nurses' morale. Journal of Korean Public Health Nursing. 2001; 15(2):225–238.
3. Seomun KA. The relationship of self-leadership, job satisfaction and perceived outcome in nurses. The Journal of Korean Nursing Administration Academic Society. 2005; 11(1):45–58.
4. Manz CC, Sims HP, Kim NH. The new super leadership: Leading others to lead themselves. Kim NH, translator. Seoul: Kyungmoosa;2002.
5. Manz CC, Sims HP. Business without bosses: How self-managing teams are building high-performing companies. New York: John Wiley & Sons;1995. p. 256.
6. Dolbier CL, Soderstrom M, Steinhardt MA. The relationships between self-leadership and enhanced psychological, health, and work outcome. The Journal of Psychology. 2001; 135(5):469–485. http://dx.doi.org/10.1080/00223980109603713.
7. Seomun KA, Chang SO, Cho KH, Kim IA, Lee SJ. The relation between self-leadership and outcome of nursing practice. The Journal of Korean Nursing Administration Academic Society. 2006; 12(1):151–158.
8. Min S, Kim HS. The influence of nurses' organizational culture on their job satisfaction and organization commitment at the public health center. Journal of Korean Academy of Nursing Administration. 2008; 14(4):448–457.
9. Prussia GE, Anderson JS, Manz CC. Self-leadership and performance outcomes: The mediating influence of self-efficacy. Journal of Organizational Behavior. 1998; 19(5):523–538. http://dx.doi.org/10.1002/(SICI)1099-1379(199809)19:5<523::AID-JOB860>3.0.CO;2-I.
10. Ko YK, Kang KH. A study on the relationship between self-efficacy, collective-efficacy and job stress in the nursing staff. The Journal of Korean Nursing Administration Academic Society. 2006; 12(2):276–286.
11. Park JS. The casual relationship between public hospital nurses' perception of organizational culture types and job satisfaction and turnover intention. Korean Association of Health and Medical Sociology. 2006; 19:97–118.
12. Lee JW, Kim DW. Mediating effects of psychological empowerment on the relationship between nurse's self leadership and organizational commitment. Korea Institute for Health and Social Welfare. 2013; 33(2):366–400.
13. Kim MS. Role of self-leadership in the relationship between organizational culture and informatics competency. Journal of Korean Academy of Nursing. 2009; 39(5):731–740. http://dx.doi.org/10.4040/jkan.2009.39.5.731.
14. Hyo JW, Sung HC. A review of research on self-leadership in nurses'. Journal of Korean Academy of Nursing Administration. 2013; 19(3):382–393. http://dx.doi.org/10.11111/jkana.2013.19.3.382.
15. Han SJ. A study on the relationship between nursing organizational culture and organizational performance. The Journal of Korean Nursing Administration Academic Society. 2002; 8(3):441–456. I410-ECN-0102-2012-510-003480595.
16. Kim MS, Han SJ, Kim JH. The development of the nursing organization culture measurement tool. Journal of Korean Academy of Nursing Administration. 2004; 10(2):175–184.
17. Manz C, Neck CP. Mastering self-leadership: Empowering yourself for personal excellence. 6th ed. Pearson: Prentice Hall;2012. p. 192.
18. Manz CC, Sims HP. “Leading workers to lead themselves: The external leadership of self-managing work teams”. Administrative Science Quarterly. 1987; 32(1):106–128. http://dx.doi.org/10.2307/2392745.
19. Lee JS. Relationships among communication competence, or- ganizational commitment, and job performance of public health nurse [master's thesis]. [Chungcheongbukdo]: Korea National University of Transportation;2015. p. 84.
20. Arvey RD, Hoyle JC. A Guttman approach to the development of behaviorally based rating scales for systems analysts and programer/analysts. Journal of Applied Psychology. 1974; 59(1):61–68. http://dx.doi.org/10.1037/h0035830.
21. Park SJ. A study on the leisure life and job products by 5 day work week system: Focused on civil servants in Gyeryong and Nonsan city [dissertation]. [Nonsan]: Konyang University;2007. p. 92.
22. Ministry of Health Welfare and Family Affairs. 2008 ministry of health welfare statistics. Government Report. Seoul: Mini- stry of Health Welfare and Family Affairs;2008.
23. Choi ES. Present situation of Korean nurses. Korean Women Health Nursing. 2004; 10(3):190–199.
24. He J. AMOS structural equation model; Basic. Seoul: Hannarea;2013. p. 269.
25. Kim MJ, Koh MS. Mediating effects of self-leadership on the relationship between nurses' core self-evaluation and innovative behaviour. Korean Association of Health and Medical Sociology. 2011; 30(1):177–204.
26. Carmeli A, Meitar R, Weisberg J. "Self leadership skills and innovative behavior at work". International Journal of Manpower. 2006; 27(1):75–90. http://dx.doi.org/10.1108/01437720610652853.
Go to :
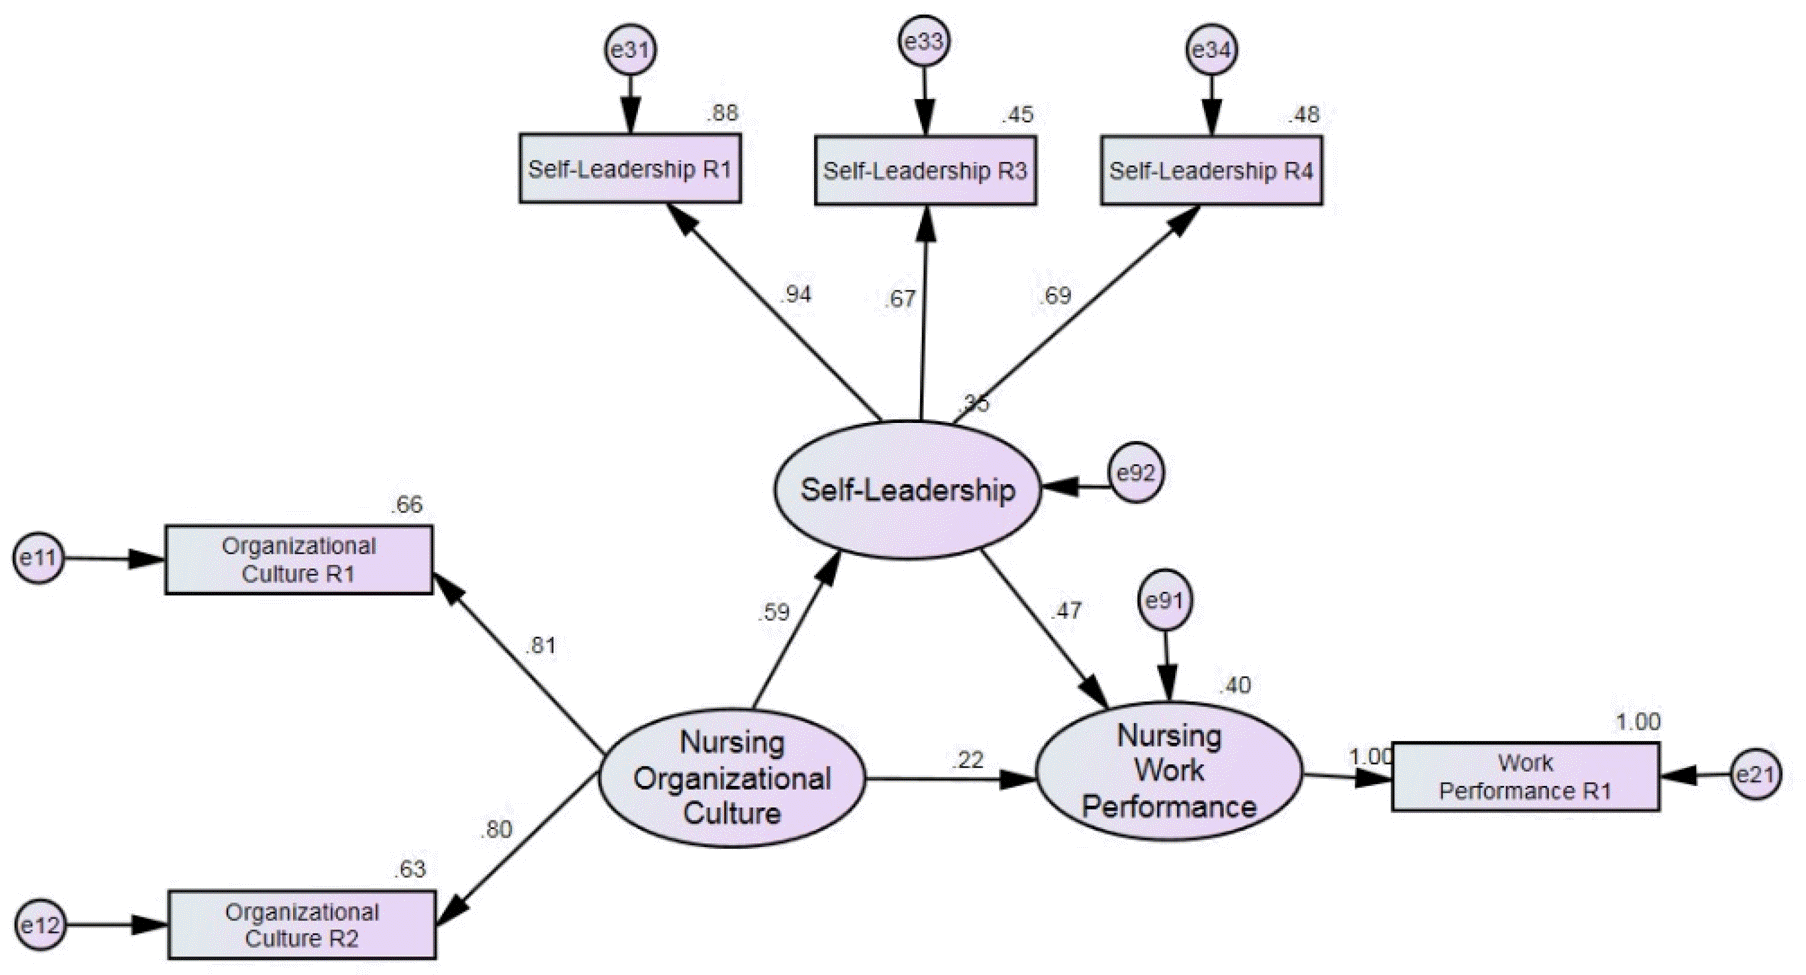
Table 1.
Self-leadership and Work Performance according to Participants' Characteristics (N=189)
Table 2.
Pearson Correlation Coefficients for Organizational Culture, Self-leadership and Work Performance (N=189)
Table 3.
Variables Defined by Exploratory Factor Analysis (The Rotation Matrix Components)
Table 4.
Goodness-of-Fit Statistics for Structural Equation Model
| Model fit statistic | x2 | RMR | GFI | AGFI | NFI | CFI | TLI | PGFI | PNFI |
|---|---|---|---|---|---|---|---|---|---|
| Statistic value | 9.87 | .18 | .98 | .95 | .98 | .99 | .99 | .32 | .45 |
Table 5.
Path Estimates for Structural Equation, Effects of Standardized, and Bootstrapping
 XML Download