

 PDF
PDF ePub
ePub Citation
 Print
Print


Abstract
Purpose
The aim of this study is to examine the reciprocal causal relationship between social activities and health with reference to the cognitive function level among community-dwelling older adults.
Methods
We conducted a longitudinal data analysis using the 4th (Time 1) and 5th (Time 2) waves from the Korean Longitudinal Study of Ageing adopting cross-lagged panel analysis (CLPA).
Results
A total of 3,473 community-dwelling older adults were included in the analysis: 2,053 in the normal cognitive function group, 912 in the mild cognitive impairment group, and 508 in the moderate to severe cognitive impairment group. The CLPA revealed that higher levels of social activities at Time 1 significantly influenced better subjective health perception at Time 2 in all three groups. In addition, better subjective health perception at Time 1 significantly influenced higher levels of social activities at time 2 only in the normal cognitive function group.
Conclusion
This study demonstrates that participating in social activities has positive effects on health regardless of the cognitive function level in community-dwelling older adults. This finding suggests that there is a need to develop strategies that can be used to encourage older adults with cognitive decline to maintain participation in social activities.
Go to : 
References
1. Longino CF, Kart CS. Explicating activity theory: A formal replication. Journal of Gerontology. 1982; 37(6):713–722. http://dx.doi.org/10.1093/geronj/37.6.713.

2. Rowe JW, Kahn RL. Successful aging. The gerontologist. 1997; 37(4):433–440. http://dx.doi.org/10.1093/geront/37.4.433.
3. Pynnönen K, Törmäkangas T, Heikkinen R-L, Rantanen T, Lyyra T-M. Does social activity decrease risk for institutionalization and mortality in older people? The Journals of Gerontology Series B: Psychological Sciences and Social Sciences. 2012; 67(6):765–774. http://dx.doi.org/10.1093/geronb/gbs076.
4. James BD, Boyle PA, Buchman AS, Bennett DA. Relation of late-life social activity with incident disability among community-dwelling older adults. The Journals of Gerontology Series A, Biological sciences and medical sciences. 2011; 66(4):467–473. http://dx.doi.org/10.1093/gerona/glq231.
5. Marioni RE, Proust-Lima C, Amieva H, Brayne C, Matthews FE, Dartigues J-F, et al. Social activity, cognitive decline and dementia risk: A 20-year prospective cohort study. BioMed Central Public Health. 2015; 15(1):1089. http://dx.doi.org/10.1186/s12889-015-2426-6.
6. Lee HY, Jang SN, Lee S, Cho SI, Park EO. The relationship between social participation and self-rated health by sex and age: A cross-sectional survey. International Journal of Nursing Studies. 2008; 45(7):1042–1054. http://dx.doi.org/10.1016/j.ijnurstu.2007.05.007.
7. Hwang JN, Kwon SM. The relation between the participation in social activity and cognitive function among middle-aged and elderly population. Journal of the Korean Gerontological Society. 2009; 29(3):971–986.
8. Kim YB, Lee SH. Social participation and subjective wellbeing of elderly in Seoul and Chuncheon Area. Journal of the Korean Gerontological Society. 2008; 28(1):1–18.
9. Cobb S. Social support as a moderator of life stress. Psychosomatic Medicine. 1976; 38(5):300–314. http://dx.doi.org/10.1097/00006842-197609000-00003.
10. Uchino BN. Social support and health: A review of physiological processes potentially underlying links to disease outcomes. Journal of Behavioral Medicine. 2006; 29(4):377–387. http://dx.doi.org/10.1007/s10865-006-9056-5.
11. Adamson J, Lawlor DA, Ebrahim S. Chronic diseases, locomotor activity limitation and social participation in older women: Cross sectional survey of British women’s heart and health study. Age and Ageing. 2004; 33(3):293–298. http://dx.doi.org/10.1093/ageing/afh090.
12. S⊘rensen LV, Axelsen U, Avlund K. Social participation and functional ability from age 75 to age 80. Scandinavian Journal of Occupational Therapy. 2002; 9(2):71–78. http://dx.doi.org/10.1080/110381202320000052.
13. Greiner KA, Li C, Kawachi I, Hunt DC, Ahluwalia JS. The relationships of social participation and community ratings to health and health behaviors in areas with high and low population density. Social Science & Medicine. 2004; 59(11):2303–2312. http://dx.doi.org/10.1016/j.socscimed.2004.03.023.
14. Plassman BL, Williams JW, Burke JR, Holsinger T, Benjamin S. Systematic review: factors associated with risk for and possi- ble prevention of cognitive decline in later life. Annals of Internal Medicine. 2010; 153(3):182–193. http://dx.doi.org/10.7326/0003-4819-153-3-201008030-00258.
15. Korea Ministry of Health and Welfare. Nationwide study on the prevalence of dementia in Korean elders [Internet]. Sejong: Korea Ministry of Health and Welfare;2013. [cited 2016 December 01]. Available from:. http://www.mohw.go.kr/front_new/al/sal0301vw.jsp?PAR_MENU_ID=04&MENU_ID=0403&page=228&CONT_SEQ=286138.
16. Kim MR, Lee SJ, Shin AY, Kim SR. A review of the trends of nursing research on dementia in Korea. Journal of the Korean Gerontological Society. 2013; 33(4):895–910.
17. Kotwal AA, Kim J, Waite L, Dale W. Social function and cognitive status: Results from a US nationally representative survey of older adults. Journal of General Internal Medicine. 2016; 31(8):854–862. http://dx.doi.org/10.1007/s11606-016-3696-0.
18. Ha JH, Chung EK, Jeong ES. Gender differences in the impact of a cognitive decline on older adults’ social participation in Korea. Korean Journal of Social Welfare Studies. 2015; 46(1):5–30.
19. Phinney A, Chaudhury H, O'Connor DL. Doing as much as I can do: The meaning of activity for people with dementia. Aging & Mental Health. 2007; 11(4):384–393. http://dx.doi.org/10.1080/13607860601086470.
20. Park JH, Kim HC. An overview of mini-mental state examination. The Korean Journal of Psychopharmacology. 1996; 7(1):13–32.
21. Farmer MM, Ferraro KF. Distress and perceived health: Mechanisms of health decline. Journal of Health and Social Behavior. 1997; 38(3):298–311.
22. Hur JS. Determinants of social participation activities among the elderly persons. Journal of Welfare for the Aged. 2014; 64:235–263.
23. Choo JA, Kim EK. Factors Associated with self-rated health among an elderly, low-income population. Journal of the Korean Data Analysis Society. 2014; 16(3):1615–1628.
24. Andresen EM, Malmgren JA, Carter WB, Patrick DL. Screening for depression in well older adults: Evaluation of a short form of the CES-D. American Journal of Preventive Medicine. 1994; 10(2):77–84.
25. Kohout FJ, Berkman LF, Evans DA, Cornoni-Huntley J. Two shorter forms of the CES-D depression symptoms index. Journal of Aging and Health. 1993; 5(2):179–193. http://dx.doi.org/10.1177/089826439300500202.
26. Shingles RD. Causal inference in cross-lagged panel analysis. Political Methodology. 1976; 3(1):95–133.
27. Yoon JY, Brown RL. Causal inference in cross-lagged panel analysis: A reciprocal causal relationship between cognitive function and depressive symptoms. Research in Gerontologi- cal Nursing. 2014; 7(4):152–158. http://dx.doi.org/10.3928/19404921-20140310-01.
28. Lim EK. Factors associated with utilization of medical and long term care services by patients with dementia [dissertation]. [Gimhae]: Inje University;2014. p. 95.
29. Mitchell L, Burton E. Designing dementia-friendly neighbourhoods: Helping people with dementia to get out and about. Journal of Integrated Care. 2010; 18(6):11–18. http://dx.doi.org/10.5042/jic.2010.0647.
30. Lim YO. Are there ways of constructing ‘aging in place’?: Comparison of aging in place model and paths between rural and urban dwelling elderly. Korean Journal of Gerontological Social Welfare. 2016; 71(3):411–436.
Go to :
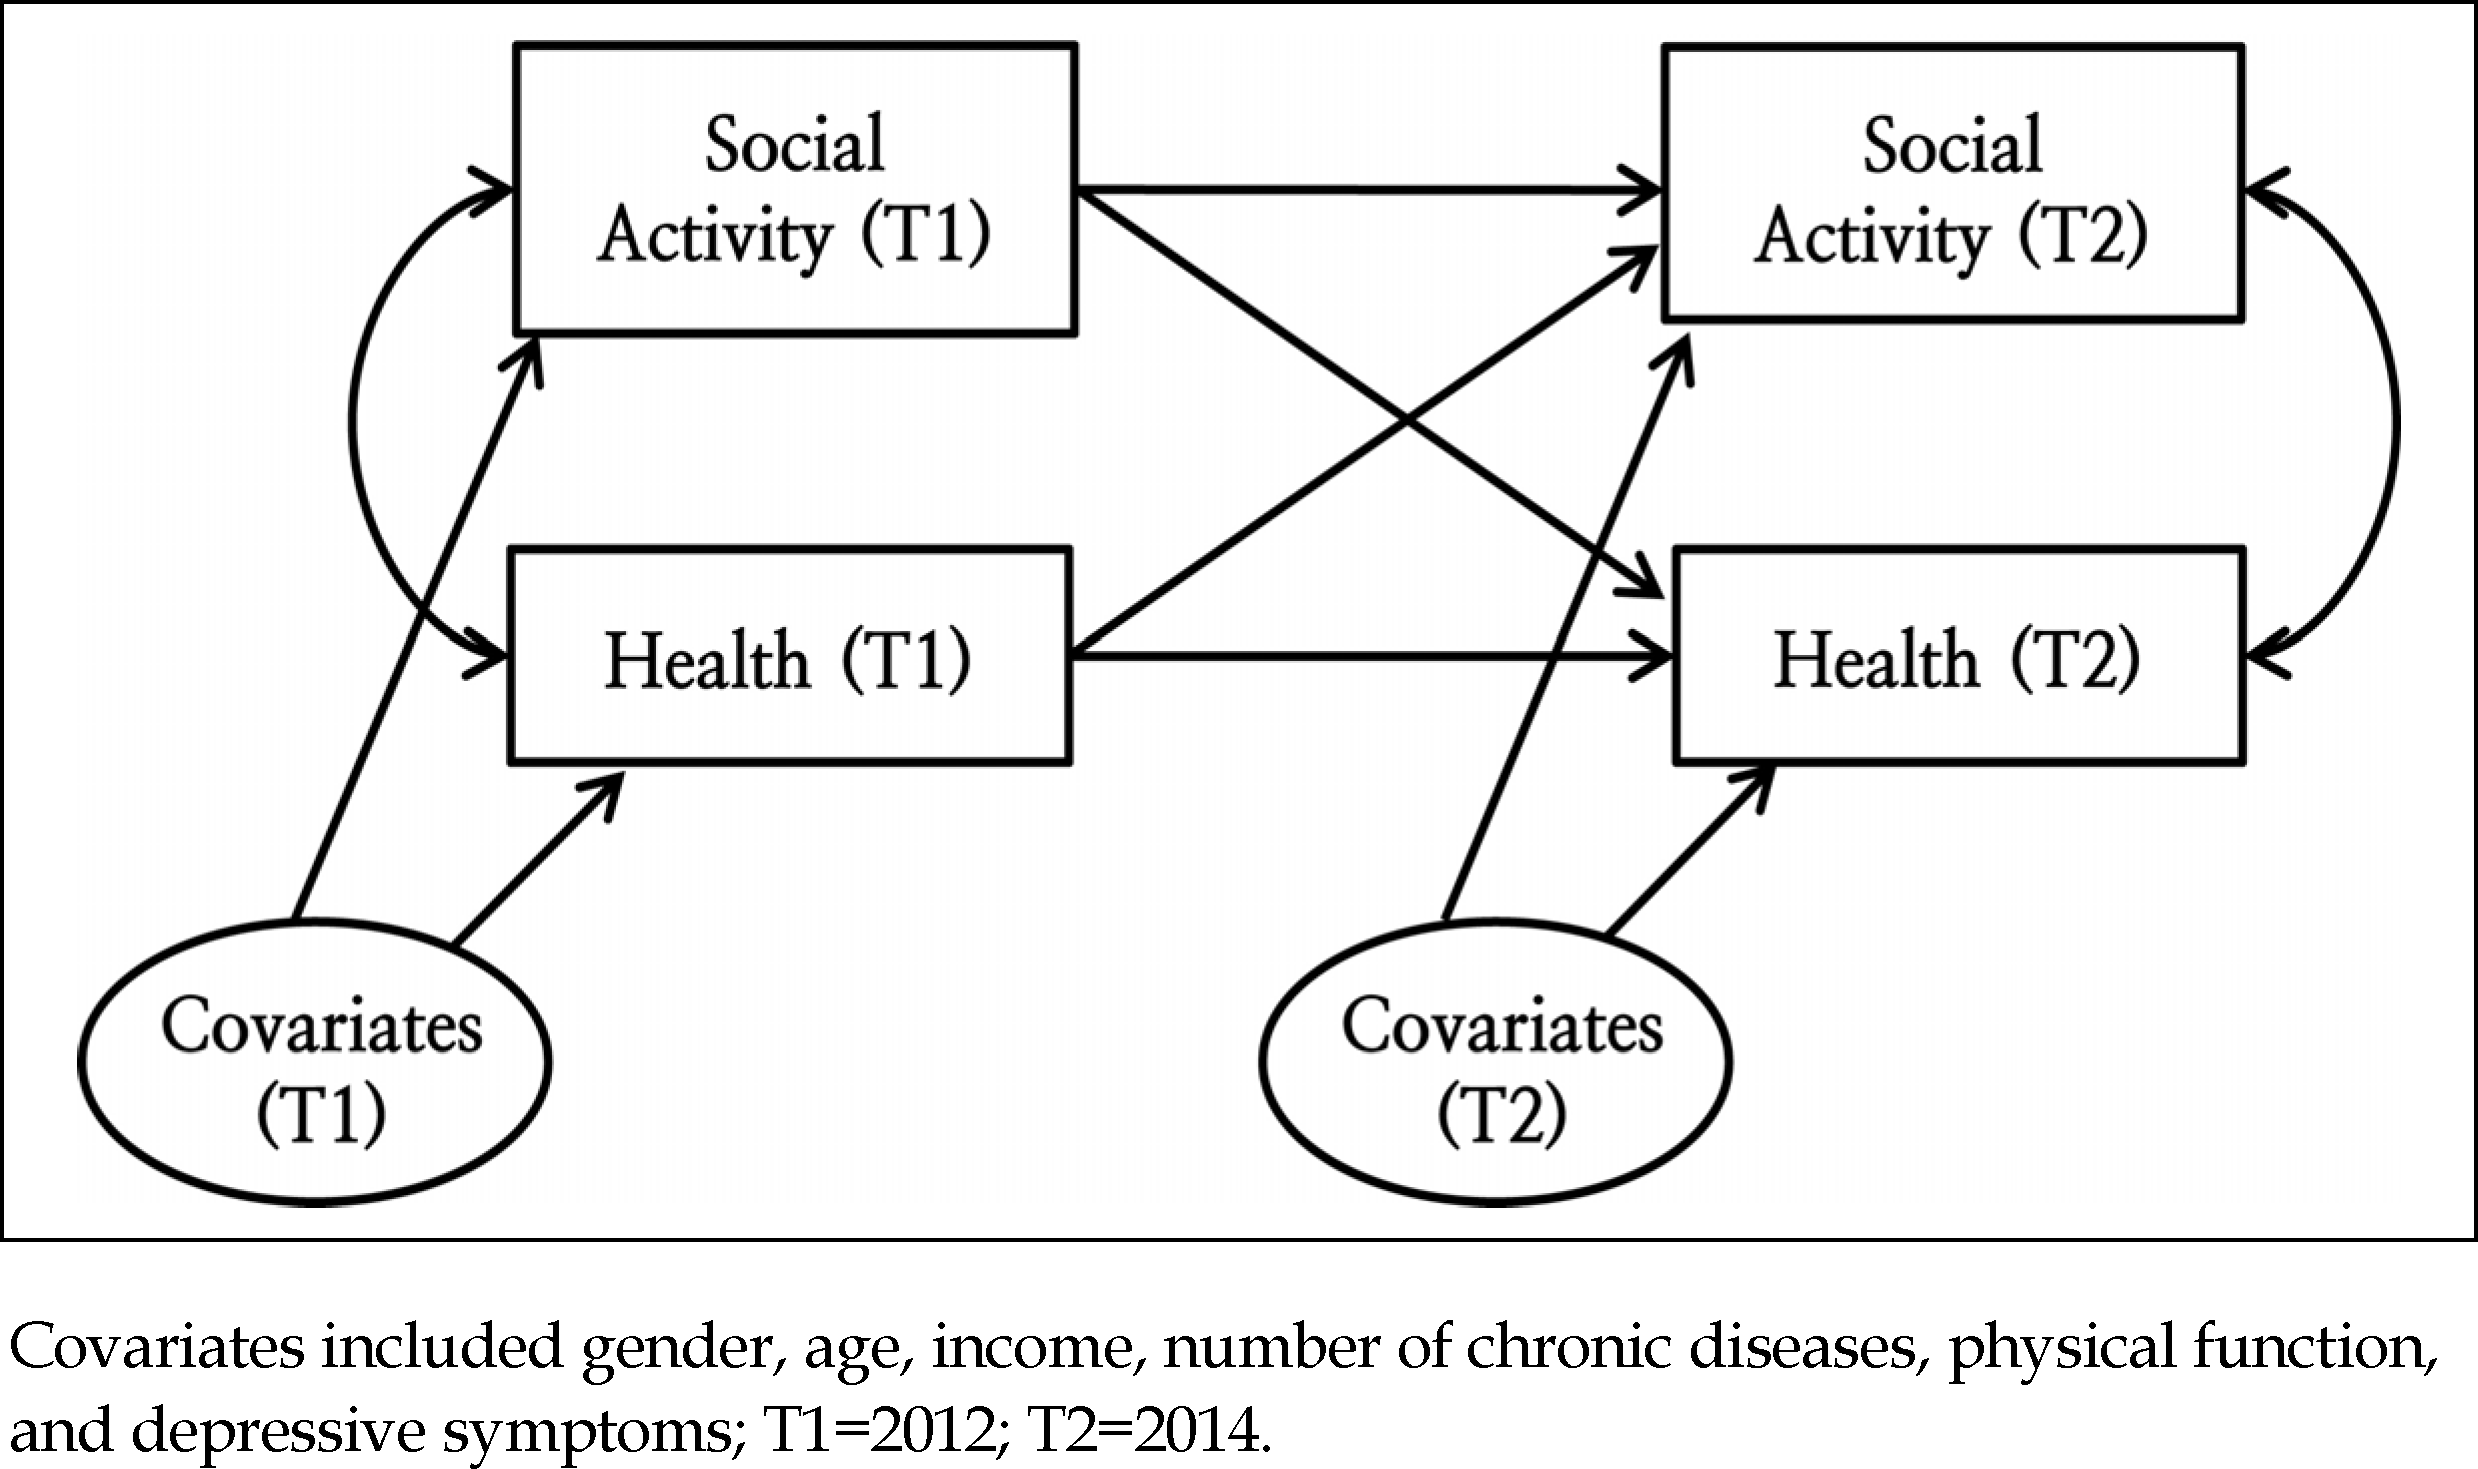
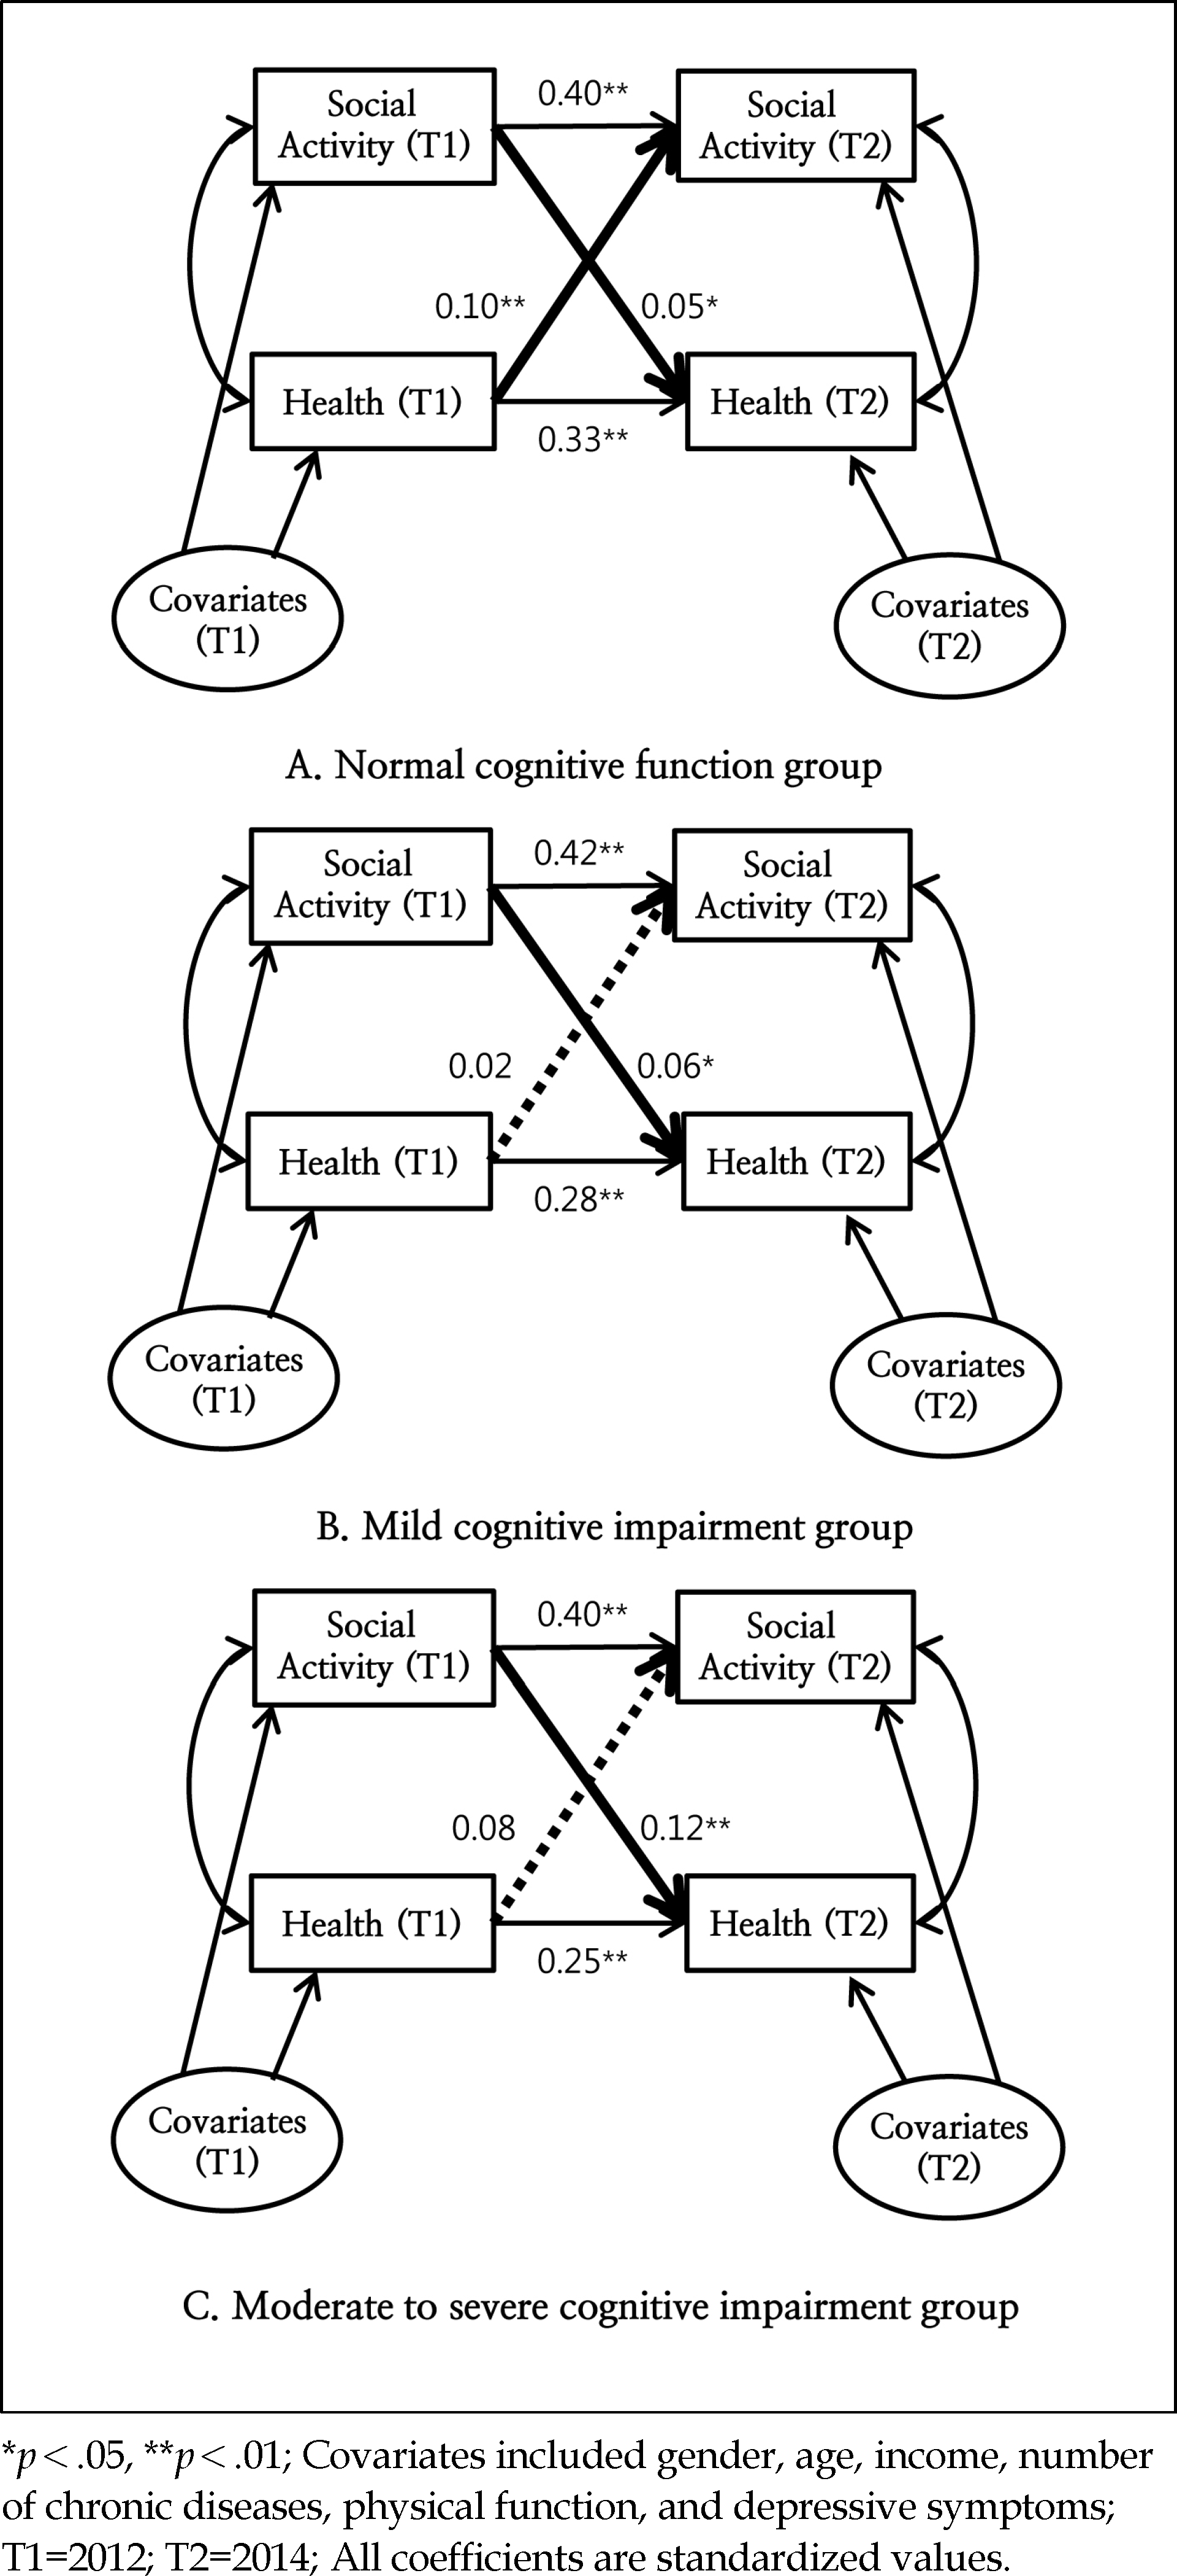
Table 1.
General Characteristics of the Participants at Each Time Point
| Variables | Time |
Total (N=3,473) |
Groups |
x2 or F | Post-hoc | p | ||
|---|---|---|---|---|---|---|---|---|
|
Normala (n=2,053) |
MCIb (n=912) |
M-S CIc (n=508) |
||||||
| n (%) or M±SD | n (%) or M±SD | n (%) or M±SD | n (%) or M±SD | |||||
| Female† | 2012 | 2,016 (58.0) | 995 (48.5) | 614 (67.3) | 407 (80.1) | 211.24 | <.001 | |
| Age (year) | 2012 | 73.85±6.26 | 72.13±5.41 | 75.01±6.04 | 78.72±6.81 | 288.28 | c>b>a | <.001 |
| Income (10,000 won) | 2012 2014 | 152.97±158.10 148.89±162.63 | 165.94±149.82 161.65±164.54 | 136.49±184.01 129.05±155.93 | 130.18±133.40 132.94±161.98 | 17.30 15.68 | a>b, c a>b, c | <.001 <.001 |
| Number of chronic diseases | 2012 | 1.63±1.29 | 1.46±1.21 | 1.80±1.31 | 2.04±1.42 | 54.07 | c>b>a | <.001 |
| 2014 | 1.85±1.35 | 1.68±1.28 | 2.00±1.38 | 2.28±1.44 | 50.43 | c>b>a | <.001 | |
| Physical function‡ | 2012 | 10.87±2.95 | 10.26±1.18 | 10.73±2.35 | 13.61±5.92 | 309.87 | c>b>a | <.001 |
| 2014 | 11.32±3.83 | 10.57±2.27 | 11.41±3.73 | 14.23±6.62 | 209.68 | c>b>a | <.001 | |
| Depressive symptoms§ | 2012 | 18.13±5.63 | 16.57±4.72 | 19.31±5.41 | 22.32±6.67 | 278.06 | c>b>a | <.001 |
| 2014 | 17.75±5.20 | 16.70±4.53 | 18.57±5.30 | 20.52±6.20 | 134.98 | c>b>a | <.001 | |
§ 10-Item Center for Epidemiological Studies-Depression (CESD-10; 10~40), higher scores indicate higher levels of depressed symptoms; Normal=normal cognitive function group (K-MMSE≥24); MCI=mild cognitive impairment group (K-MMSE: 18~23); M-S CI=moderate to severe cognitive impairment group (K-MMSE≤17).
Table 2.
Descriptive Results of Health and Social Activities
Table 3.
Results of the Cross-lagged Panel Analysis
| Variables |
Groups |
|||||||||||
|---|---|---|---|---|---|---|---|---|---|---|---|---|
|
Normal |
MCI |
M-S CI |
||||||||||
| SA | Health | SA | Health | SA | Health | SA | Health | SA | Health | SA | Health | |
|
(T1) |
(T1) |
(T2) |
(T2) |
(T1) |
(T1) |
(T2) |
(T2) |
(T1) |
(T1) |
(T2) |
(T2) |
|
| β (SE) | β (SE) | β (SE) | β (SE) | β (SE) | β (SE) | β (SE) | β (SE) | β (SE) | β (SE) | β (SE) | β (SE) | |
| Health (T1) | 0.10** | 0.33** | 0.02 | 0.28** | 0.08 | 0.25** | ||||||
| (0.02) | (0.02) | (0.03) | (0.03) | (0.04) | (0.04) | |||||||
| SA (T1) | 0.40** | 0.05* | 0.42** | 0.06* | 0.40** | 0.12** | ||||||
| (0.02) | (0.02) | (0.03) | (0.03) | (0.04) | (0.03) | |||||||
| Female | -0.09** | -0.10** | -0.02 | -0.01 | -0.03 | -0.12** | 0.01 | -0.03 | 0.01 | 0.01 | -0.03 | 0.01 |
| (0.02) | (0.02) | (0.02) | (0.02) | (0.03) | (0.03) | (0.03) | (0.03) | (0.04) | (0.04) | (0.04) | (0.04) | |
| Age (year) | -0.09** | -0.10** | -0.10** | -0.08** | -0.09** | -0.05 | -0.02 | -0.02 | -0.03 | 0.06 | 0.03 | 0.05 |
| (0.02) | (0.02) | (0.02) | (0.02) | (0.03) | (0.03) | (0.03) | (0.03) | (0.05) | (0.04) | (0.04) | (0.04) | |
| Income (10,000 won) | 0.17** | 0.13** | 0.05* | 0.04* | 0.12** | 0.08 | 0.06 | 0.05 | 0.07 | 0.13** | -0.01 | 0.13** |
| (0.04) | (0.02) | (0.02) | (0.02) | (0.04) | (0.04) | (0.03) | (0.03) | (0.04) | (0.04) | (0.04) | (0.04) | |
| Number of chronic diseases | 0.00 | -0.28** | -0.01 | -0.15** | 0.03 | -0.28** | -0.09** | -0.17** | -0.03 | -0.22** | 0.05 | -0.12** |
| (0.02) | (0.02) | (0.02) | (0.02) | (0.04) | (0.03) | (0.03) | (0.03) | (0.05) | (0.04) | (0.05) | (0.03) | |
| Physical function | -0.02 | -0.11** | -0.08** | -0.17** | -0.08** | -0.15** | -0.10** | -0.26** | -0.16** | -0.33** | -0.11** | -0.33** |
| (0.02) | (0.02) | (0.02) | (0.03) | (0.03) | (0.03) | (0.02) | (0.03) | (0.05) | (0.04) | (0.04) | (0.04) | |
| Depressive symptoms | -0.07** | -0.13** | 0.00 | -0.16** | -0.11** | -0.22** | -0.11** | -0.15** | -0.10* | -0.25** | -0.15** | -0.17** |
| (0.02) | (0.02) | (0.02) | (0.03) | (0.03) | (0.03) | (0.03) | (0.04) | (0.05) | (0.03) | (0.04) | (0.04) | |
 XML Download