

 PDF
PDF ePub
ePub Citation
 Print
Print


Abstract
Purpose
This study was to identify health-related quality of life of Korean young adults and elderly with multimorbidity and to examine factors influencing their health-related quality of life.
Methods
Health-related quality of life was measured by the Korean version of the EQ-5D. Using a descriptive study, the study incorporated a secondary analysis of the Korean version of the EQ-5D data from the 8th wave of the Korea Health Panel Survey in 2013. Selected demographic data and the Korean version of the EQ-5D were analyzed using χ2-test, t-test, ANOVA and multiple regression analysis.
Results
Education, drinking, type of health insurance, and number of chronic disease significantly affected the health-related quality of life in the young adults with multimorbidity. Educational level, occupational type, drinking, physical activity, number of chronic disease, unmet healthcare need and the type of multimorbidity significantly affected the health-related quality of life in the elderly with multimorbidity.
Figures and Tables
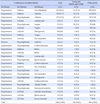
Table 1
Combinations of Multimorbidity (N=1,006)
![]()
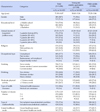
Table 2
General and Medical related Characteristics of Participants (N=1,006)†
![]()
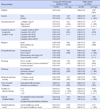
Table 3
Health-related Quality of Life by General and Medical related Characteristics of Participants (N=1,006)†
![]()
Table 4
Factors influencing HRQOL of Participants (N=1,006)†
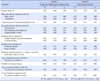
NHI=national health insurance; NMC=not included musculoskeletal condition; †Missing data excluded.
Dependent variable : health-related quality of life (EQ-5D index)
Note. Predictors : (constant), gender, educational level, annual income of household (million won), occupational type, smoking, drinking, moderate physical activity, type of health insurance, number of chronic disease, type of multimorbidity, unmet healthcare needs.
![]()
References
1. Organization for Economic Cooperation and Development. Health reform: Meeting the challenge of ageing and multiple morbidities. Paris: Organization for Economic Cooperation and Development;2011. p. 226.
2. Kim CH, Hwang I, Yoo WS. The common patterns of multimorbidity and its impact on healthcare cost in Korea. Health Policy Manag. 2014; 24(3):219–227. DOI: 10.4332/KJHPA.2014.24.3.219.

3. Barnett K, Mercer SW, Norbury M, Watt G, Wyke S, Guthrie B. Epidemiology of multimorbidity and implications for health care, research, and medical education: a cross-sectional study. Lancet. 2012; 380(9836):37–43. DOI: 10.1016/S0140-6736(12)60240-2.
4. Lehnert T, Heider D, Leicht H, Heinrich S, Corrieri S, Luppa M, et al. Review: Health care utilization and costs of elderly persons with multiple chronic conditions. Med Care Res Rev. 2011; 68(4):387–420. DOI: 10.1177/1077558711399580.
5. Starfield B, Lemke KW, Herbert R, Pavlovich WD, Anderson G. Comorbidity and the use of primary care and specialist care in the elderly. Ann Fam Med. 2005; 3(3):215–222. DOI: 10.1370/afm.307.
6. van Oostrom SH, Picavet HS, de Bruin SR, Stirbu I, Korevaar JC, Schellevis FG, et al. Multimorbidity of chronic diseases and health care utilization in general practice. BMC Fam Pract. 2014; 15:61. DOI: 10.1186/1471-2296-15-61.
7. Nam SK, Shim OS. A study on the influence factors on quality of life of elderly with chronic disease. J Welf Aged. 2011; 53:196–216.
8. Chung ES, Park MJ. Factor influencing unmet medical need of elders with chronic disease. In : The 3rd Korea Health Panel Conference; 2011 December 1; Seoul Foundation of Women and Family. Seoul: Korea Health Panel;2011. p. 522.
9. Park S. Associations with physical activity, chronic disease, depression, and health-related quality of life. Korean J Sport Sci. 2014; 25(2):249–258.
10. Jung YH. A report on the health related quality of life in Korea. Health Welf Policy Forum. 2011; 182:6–14.
11. van den Bussche H, Koller D, Kolonko T, Hansen H, Wegscheider K, Glaeske G, et al. Which chronic diseases and disease combinations are specific to multimorbidity in the elderly? Results of a claims data based cross-sectional study in Germany. BMC public health. 2011; 11:101. DOI: 10.1186/1471-2458-11-101.
12. Goodman RA, Posner SF, Huang ES, Parekh AK, Koh HK. Defining and measuring chronic conditions: Imperatives for research, policy, program, and practice. Prev Chronic Dis. 2013; 10:E66. DOI: 10.5888/pcd10.120239.
13. Ferrans CE, Zerwic JJ, Wilbur JE, Larson JL. Conceptual model of health-related quality of life. J Nurs Scholarsh. 2005; 37(4):336–342. DOI: 10.1111/j.1547-5069.2005.00058.x.
14. Korea Health Panel. Survey design: Sampling [Internet]. Seoul: Korea Health Panel;2015. cited 2016 May 17. Available from: http://www.khp.re.kr:444/ver_2/02_josa/josa01.jsp.
15. Lee SH, Yang SO. The effects of chronic musculoskeletal pain and depression on health-related quality of life by gender in community-dwelling older adults. J Korean Acad Community Health Nurs. 2010; 21(1):21–30. DOI: 10.12799/jkachn.2010.21.1.21.
16. Nam HS, Kim KY, Kwon SS, Ko KW, Kind P. EQ-5D Korean valuation study using time trade of method. Research Report. Cheongju: Korea Centers for Disease Control and Prevention;2007.
17. Fortin M, Lapointe L, Hudon C, Vanasse A, Ntetu A, Maltais D. Multimorbidity and quality of life in primary care: A systematic review. Health Qual Life Outcomes. 2004; 2:51. DOI: 10.1186/1477-7525-2-51.
18. Lim JH. Analysis of unmet medical need status based on the Korean health panel. Health Soc Sci. 2013; 34:237–256.
19. Kim KS, Lee HO. Household catastrophic health expenditure and unmet needs depending on the types of health care system. Soc Welf Policy. 2012; 39(4):255–279. DOI: 10.15855/swp.2012.39.4.255.
20. Joung EO, Kwon SB, Ahn OH. Coping with experiences in multiple chronic diseases in the rural elderly. J Korean Acad Community Health Nurs. 2007; 18(1):32–41.
 XML Download