

 PDF
PDF ePub
ePub Citation
 Print
Print


Abstract
Purpose
This is a comparative study using secondary data from the Korean national long term care (LTC) insurance.
Methods
Visiting nursing (VN) service users (n=666) and non-users (n=4,375) were extracted and compared in terms of medical expenditures, length of hospitalization, and annual number of ambulatory care visits to investigate effects of VN services in LTC.
Results
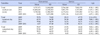
Total health care expenditures were compared between the two groups and it was found that VN service users spent about $ 1700 than non-users for their medical costs between 2009 and 2011. The average length of in-hospital stay for VN service users was 19.4 days shorter than that of non-users. However, using VN services did not significantly influence the annual number of ambulatory care visits.
Figures and Tables
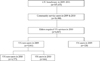
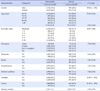
Table 1
Baseline Characteristics according to Service or Non-service (N=5,041)
![]()
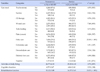
Table 2
Baseline Health Status according to Service or Non-service (N=5,041)
![]()
Table 3
Medical Cost according to Service or Non-service
![]()
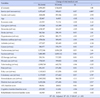
Table 4
Multiple Regression to Predict Change of Medical Cost by 2009~2011
![]()
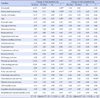
Table 5
Multiple Regression to Predict Change of Inpatient and Outpatient Day by 2009~2011
![]()
References
1. Kim JS, Shin HR. The Coordination between the long-term care service and health service. J Welf Aged. 2015; 67:83–105.
2. Kim MH, Kwon SM, Kim HS. The effect of long-term care utilization on health Care utilization of the elderly. Korean J Health Econ Policy. 2013; 19(3):1–22.
3. Long-term Care Insurance Corporation. Introduction of policy [Internet]. Seoul: National Health Insurance Corporation;2013. cited 2016 May 2. Available from: http://longtermcare.or.kr/portal/site/nydev/MENUITEM_LTCARE/.
4. Lee HY, Moon YP. The effect of long-term care utilization on health care utilization of the elderly. Korean J Health Econ Policy. 2015; 21(3):81–102.
5. Kim JS, Sun WD, Lee GJ, Choi ID, Lee HY, Kim KA. Study establish the role of hospitals and nursing care facilities- Focusing on the linkage scheme -. Research Report. Seoul: Korea Institute for Health and Social Affairs;2013. 12. Report No.: 2013-31-18.
6. Sun WD. Installation analysis and policy implications of the elderly long-term care facilities [Internet]. Sejong: Korea Institute for Health and Social Affairs;2015. cited 2016 May 10. Available from: http://www.kihasa.re.kr/web/publication/periodical/issue/list.do.
7. Elkan R, Kendrick D, Dewey M, Hewitt M, Robinson J, Blair M, et al. Effectiveness of home based support for older people: Systematic review and meta-analysis. BMJ. 2001; 323(7315):719–725.
8. Oyama Y, Tamiya N, Kashiwagi M, Sato M, Ohwaki K, Yano E. Factors that allow elderly individuals to stay at home with their families using the Japanese long-term care insurance system. Geriatr Gerontol Int. 2013; 13(3):764–773. DOI: 10.1111/ggi.12002.

9. Fortinsky RH, Madigan EA, Sheehan TJ, Tullai-McGuinness S, Fenster JR. Risk factors for hospitalization among Medicare home care patients. West J Nurs Res. 2006; 28(8):902–917. DOI: 10.1177/0193945906286810.
10. Hastings SN, Heflin MT. A systematic review of interventions to improve outcomes for elders discharged from the emergency department. Acad Emerg Med. 2005; 12(10):978–986.
11. Chung YS. A study on home visiting nursing care and medical care utilization in the elderly patients with long-term care [dissertation]. [Gimhae]: Inje University;2012. 103.
12. Kang SB, Kim HS. The relationship between home-visit nursing services and health care utilization among nursing service recommended beneficiaries of the public long-term care insurance. Health Policy Manag. 2014; 24(3):283–290. DOI: 10.4332/KJHPA.2014.24.3.283.
13. Kown JH, Han EJ, Lee JS. Long-term care services payroll management improvement. Research Report. Seoul: National Health Insurance Corporation;2009. 12. Report No.: 2009-33.
14. Jung WS, Yim ES. The effect on health care utilization of the non-use of beneficiaries of long-term care insurance servicearound of geriatric hospital's medical cost. J Korea Acad Ind Coop Soc. 2015; 16(11):DOI: 10.5762/KAIS.2015.16.11.7463.
15. Jung WS. Effect of long-term care utilization on health care utilization of the medicaid elderly. J Korea Acad Ind Coop Soc. 2014; 15(11):6746–6755. DOI: 10.5762/KAIS.2014.15.11.6746.
16. Kuk KN, Kim RE, Lim SJ, Park CY, Kim JY, Chung WJ. Factors associated with the non-use of beneficiaries of long-term care insurance service: The case of Jeollanam-do province. Health Policy Manag. 2014; 24(4):349–356. DOI: 10.4332/KJHPA.2014.24.4.349.
18. Lichtenberg FR. Is home health care a substitute for hospital care? Home Health Care Serv Q. 2012; 31(1):84–109. DOI: 10.1080/01621424.2011.644497.
19. Tomita N, Yoshimura K, Ikegami N. Impact of home and community based services on hospitalization and institutionalization among individuals eligible for long-term care insurance in Japan. BMC Health Serv Res. 2010; 10:1–13. DOI: 10.1186/1472-6963-10-345.
20. Teng YH, Teng JJ, Lee MY, Hsieh MH, Chen YJ, Lin JY, et al. Determinants of emergency medical utilization among the elderly population in Taiwan: A national longitudinal cohort study. Arch Gerontol Geriatr. 2013; 56(2):364–369. DOI: 10.1016/j.archger.2012.10.012.
22. Ikegami N. Impact of public long-term care insurance in Japan. Geriatr Gerontol Int. 2004; 4(s1):S146–S148. DOI: 10.1111/j.1447-0594.2004.00182.x.
23. Neufeld E, Hirdes JP, Perlman CM, Rabinowitz T. Risk and protective factors associated with intentional self-harm among older community-residing home care clients in Ontario, Canada. Int J Geriatr Psychiatry. 2015; 30(10):1032–1040. DOI: 10.1002/gps.4259.
24. Tanuseputro P, Chalifoux M, Bennett C, Gruneir A, Bronskill SE, Walker P, et al. Hospitalization and mortality rates in long-term care facilities: Does for-profit status matter. J Am Med Dir Assoc. 2015; 16(10):874–883. DOI: 10.1016/j.jamda.2015.06.004.
25. Byeon DH, Hyun HJ. Importance and performance of visiting nurse services provided under the long term care insurance system for the elderly. J Korean Acad Community Health Nurs. 2013; 24(3):332–345. DOI: 10.12799/jkachn.2013.24.3.332.
26. Chin YR, Hong WL. Changes on hospital-based home care services utilization after long-term care insurance launch. J Korean Gerontol Soc. 2011; 31(2):371–380.
27. Lee JS, Han EJ, Kang IO. The characteristics and service utilization of home nursing care beneficiaries under the korean long term care insurance. J Korean Acad Commun Health Nurs. 2011; 22(1):33–44.
29. Park JY, Lee YH, Kwon JH, Lee EM, Lee HY, Kim YH. Development of integrated care model for LTC and medical service. Development Report. Seoul: National Health Insurance Corporation;2010. 12. Report No.: 2010-18.
 XML Download