

 PDF
PDF ePub
ePub Citation
 Print
Print


Abstract
Purpose
The purpose of this study was to examine social capital and health-related quality of life (HRQoL) of residents who were living in the three regions(Masan, Jinhae, and Changwon) of integrated Changwon and to analyze the effect of social capital on HRQoL.
Methods
This study used the Masan, Jinhae and Changwon data of the 2013 Community Health Survey. The social capital questionnaire consisted of three subdomains (trust, participation, and network). HRQoL was measured with the Korean-version EQ-5D. The effect of social capital on HRQoL was analyzed using multiple regression with controlling for general characteristics and health behavior.
Results
The trust level of Masan citizen was highest among the three regions. Jinhae citizen showed the highest level of participation and network out of the three regions. Trust was not a significant influencing factor in any of the three models. Participation was a significant influencing factor in all of the three models. Network was a significant influencing factor only in the Masan model.
Figures and Tables
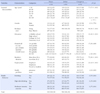
Table 1
General Characteristics, Health Behavior of Residents in Integrated Changwon
![]()
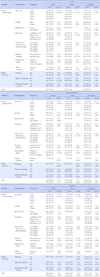
Table 2
Social Capital according to General Characteristics and Health Behavior of Residents in Integrated Changwon
![]()
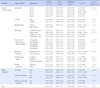
Table 3
HRQoL according to General Characteristics and Health Behavior of Residents in Integrated Changwon
![]()
Table 4
The Effect of Social Capital on HRQoL of Residents in Integrated Changwon
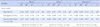
†Tested by multiple regression analysis with adjusted for sex, age, educational level, resident area, house hold income per a family member, resident duration, employment, health problem, smoking, high risk drinking, moderate intensity exercise; ‡When presenting to the second decimal place, the effective numbers of some statistics were not displayed. Therefore, B, SE, and β were presented as the third decimal place.
![]()
References
1. Commission on Social Determinants of Health. Report No.: ISBN 978-92-4-156370-3. Closing the gap in a generation: Health equity through action on the social determinants of health. Final Report of the Commission on Social Determinants of Health. Geneva, Switzerland: World Health Organization;2008.
2. Solar O, Irwin A. Report No.: ISBN 978-92-4-150085-2. A conceptual framework for action on the social determinants of health. Social Determinants of Health Discussion Paper 2 (Policy and Practice. Geneva, Switzerland: World Health Organization;2010.
3. Marmot M. Health in an unequal world. Lancet. 2006; 368(9552):2081–2094. DOI: 10.1016/S0140-6736(06)69746-8.

4. Putnam R. Bowling alone: The collapse and revival of American community. New York, NY: Simon & Schuster;2000. p. 541.
5. Fukuyama F. Social capital and the global economy: A redrawn map of the world. Foreign Affairs. 1995; 74(5):89–103.
6. Ko KH, An YH, Kim KW. Measuring and enhancing ways of social capital in local government. Research Report. Seoul: Korea Research Institute for Local Administration;2012.
7. So JK. Toward developing social capital indicators. J Korean Reg Dev Assoc. 2004; 16(1):89–117.
8. Zambon A, Morgan A, Vereecken C, Colombini S, Boyce W, Mazur J, et al. The contribution of club participation to adolescent health: Evidence from six countries. J Epidemiol Community Health. 2010; 64(1):89–95. DOI: 10.1136/jech.2009.088443.
9. Sun X, Rehnberg C, Meng Q. How are individual-level social capital and poverty associated with health equity? a study from two Chines cities. Int J Equity Health. 2009; 8:2. DOI: 10.1186/1475-9276-8-2.
10. Seo JW. The effect of human capital and social capital on the health status of the elderly. J Korean Home Econ Educ Assoc. 2006; 44(10):133–144.
11. Song Y, Nam E. The influence of social capital and health behaviors on self-rated health in South Korea. Korean J Health Educ Promot. 2009; 26(3):1–13.
12. Kim BK. Exploring the strategies for integration in city and rural area: Based on special act for the local administrative system reform. Korea Res Inst Local Adm Focus. 2011; 38:1–27.
13. Chnagwon City. The 5th (2011~2014) community healthcare plan of Changwon. Changwon: Changwon City;2010.
14. Snelgrove JW, Pikhart H, Stafford M. A multilevel analysis of social capital and self-rated health: Evidence from the British household panel survey. Soc Sci Med. 2009; 68(11):1993–2001. DOI: 10.1016/j.socscimed.2009.03.011.
15. Paeng KY. The influence of individual-level social capital on self-rated health. [dissertation]. [Jinju]: Gyeongsang National University;2011. 93.
16. Cohen S, Syme SL. Social support and health. New York: Academic Press;1985. p. 390.
17. Park J, Kang GW, Tak YJ, Jang SH, Lee GS, Kim HS. Relationships between social support & social network and health behavior. Korean J Health Policy Adm. 2011; 21(4):493–510. DOI: 10.4332/KJHPA.2011.21.4.493.
18. Ferrans CE, Zerwic JJ, Wilbur JE, Larson JL. Conceptual model of health-related quality of life. J Nurs Scholarsh. 2005; 37(4):336–342. DOI: 10.1111/j.1547-5069.2005.00058.x.
19. Nam HS. Korean valuation weights for euroqol-5 dimension [Internet]. Seoul: Korea Center for Disease Control;2010. cited 2015 July 20. Available from: http://www.cdc.go.kr/CDC/info/CdcKrInfo0301.jsp?menuIds=HOME001-MNU1132-MNU1138-MNU0037-MNU1380&cid=12449.
20. Lee JH, Paeng KY, Kim JR, Jeong BG, Park KS. Self-rated health and individual level social capital across the administrative sections. Korean J Health Educ Promot. 2012; 29(2):59–70.
21. Lee HY, Jang SN, Lee SJ, Cho SI, Park EO. The relationship between social participation and self-rated health by sex and age: A cross-sectional survey. Int J Nurs Stud. 2008; 45(7):1042–1054. DOI: 10.1016/j.ijnurstu.2007.05.007.
22. Changwon City. 35th statistical year book of Changwon [Internet]. Changwon: Changwon City;2014. cited 2015 July 20. Available from: http://stat.changwon.go.kr/download/2014/html/index1.html.
23. Kim D, Kawachi I. A multilevel analysis of key forms of community-and individual-level social capital as predictors of self-rated health in the United States. J Urban Health. 2006; 83(5):813–826. DOI: 10.1007/s11524-006-9082-1.
24. Wang H, Schlesinger M, Wang H, Hsiao WC. The flip-side of social capital: The distinctive influences of trust and mistrust on health in rural China. Soc Sci Med. 2009; 68(1):133–142. DOI: 10.1016/j.socscimed.2008.09.038.
25. Kim JR, Jeong B, Park KS, Kang YS. The associations of empowerment and social capital with self-rated health in communities with poor health. J Agric Med Community Health. 2012; 37(3):131–144.
26. Coleman JS. Social capital in the creation of human capital. Am J Sociol. 1988; 94:S95–S120.
27. Andrew MK. Social capital, health, and care home residence among older adults: A secondary analysis of the Health Survey for England 2000. Eur J Ageing. 2005; 2(2):137–148. DOI: 10.1007/s10433-005-0031-8.
28. You SH. Community participation for health promotion: Definitions and pplications. Korean J Health Educ Promot. 2012; 29(4):57–66.
29. Ko YH, Kim S, Kim GS, Chang SB. Mammography screening according to breast cancer disease and social network characteristics of married Korean women. Korean J Women Health Nurs. 2011; 17(2):157–168. DOI: 10.4069/kjwhn.2011.17.2.157.
 XML Download