

 PDF
PDF ePub
ePub Citation
 Print
Print


Abstract
Purpose
The purpose of this study was to compare the use of health services and health expenditures between non-exercise and exercise groups of diabetic patients and among three groups divided according to exercise intensity.
Methods
Data were obtained from the Korean Health Panel Survey of 2011. The participants of this study were 864 diabetic patients who did exercise (walk, moderate exercise, or vigorous exercise) or not. Data were subsequently analyzed using the SPSS 21 Program.
Results
The exercise group showed higher percentages of medication compliance, non-smokers, and regular diet than the non-exercise group. The hospitalization percentage, the number of outpatient hospital visits, and health expenditures were higher in the non-exercise group than in the exercise group. There was no difference among the three groups divided according to exercise intensity in the use of health services and health expenditures.
Figures and Tables
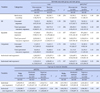
Table 1
General Characteristics of the Participants
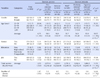
![]()
Table 2
Health Behaviors of the Participants
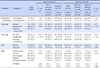
![]()
Table 3
Utilization of Health Services
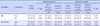
![]()
Table 4
The Number of Days of Health Services
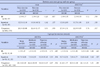
![]()
Table 5
Health Expenditures
![]()
References
1. Lim JH, Oh CS. Medical care utilization status and quality of life in diabetes mellitus patients. J Digit Policy Manag. 2013; 11(10):609–618.
2. Ministry of Health & Welfare, Korea Centers for Disease Control & Prevention. Korea national health&nutrition examination survey 2012 [Internet]. Seoul: Ministry of Health & Welfare, Korea Centers for Disease Control & Prevention;2013. cited 2014 December 1. Available from: https://knhanes.cdc.go.kr/knhanes/index.do.
3. Health Insurance Review & Assessment Service. National health insurance statistical yearbook 2009 [Internet]. Seoul: National Health Insurance Corporation;2011. cited 2014 December 1. Available from: http://www.hira.or.kr/main.do.
4. Hyoung HK, Jang HS. The comparison of health status and health behavior among hypertension group, DM group, and hypertension DM group for the aged provided with customized home care service by visiting nurses. J Korean Acad Community Health Nurs. 2011; 22(1):11–21.

5. Kim YJ, Seo NS, Kim SJ, Park IS, Kang SJ. Quality of life and its correlated factors among elderly people with diabetes in a community. Korean J Health Serv Manag. 2014; 8(1):75–86.
6. Lee SH, Park DH. Blood glucose response to various exercise intensities in children and adolescence with type 1 diabetes. Exerc Sci. 2014; 23(2):139–147.
7. Kang SJ, Ryu BH. Effects of combined exercise on HbA1c, cardiovascular disease risk factors, and physical fitness in elderly women with type2 DM. Kinesiol. 2014; 16(2):21–30.
8. Lee SE. Regular exercise as a moderator of the relationship between illness-stress and depression. Ment Health Soc Work. 2009; 33(1):167–192.
9. Ko SK. The quantity of aerobic exercise to improve the blood lipoprotein in middle aged woman with hypertension, obesity and diabetes mellitus. Exerc Sci. 2002; 11(1):247–257.
10. Kim SH. The blood glucose index and lipid peroxidation after 12 weeks of aerobic exercise in type2 diabetic older patients. J Coaching Dev. 2007; 9(2):327–334.
11. Jeon JH, Kim SB, Yoon JH. Effects of walking exercise program on insulin resistance and peripheral artery in type2 diabetic patients. J Korea Soc Wellness. 2013; 8(3):177–188.
12. Lee DH, Lee SH, An KY, Moon JY, Kim SH, Choi YJ, et al. Effects of 6 weeks of lifestyle modification including combined exercise program on the risk of metabolic parameters and macrovascular complications in type 2 diabetic patients. Korean J Obes. 2011; 20(3):147–159.
13. Choi PB. Effect of long-term regular exercise and drug therapy on diabetes indicators, lipid profiles, and bone mineral density in patients with type II diabetes mellitus. Korean J Phys Educ. 2011; 50(3):513–522.
14. Choi PB. Effects and correlation analysis of long-term exercise on diabetes indicators, lipids profile, and pancreatic cancer factor in the elderly with type 2 diabetic mellitus. Korean J Exerc Rehabil. 2012; 8(4):93–102.
15. Shin WT, Lee JW. The effect of exercise type on blood vessel inflammatory markers in elderly women patients with diabetes mellitus. J Korea Soc Wellness. 2012; 7(1):201–211.
16. Won YS, Ko DS. The effects of exrcise for elder's life style pattern. J Korean Phys Edu Assoc Girls Women. 2007; 21(3):99–111.
17. Kim YR. The relationship among the sports-for-all participation, health status, and medical expense of the elderly. Int J Appl Sports Sci. 2006; 17(4):125–137.
18. Kim SK. The relationship among the sports-for-all participation, health promoting lifestyle and medical expense of the elderly. J Sport Leis Stud. 2009; 37(1):755–765.
19. Kim SO. The effects of chronic patents' medication compliance to use of medical services and medical expenditure. In : 4th Korea Health Panel Conference; 2012 Dec 14; Korea Chamber of Commerce & Industry. Seoul. Korea Institute for Health and Social Affairs & National Health Insurance Corporation;2012. p. 423.
20. Bae JJ, Lee BY, Choi JW, Jeong IG. The relationship on an isokinetic for the ankle joint muscular and anaerobic power on the record of elite short speed skating athletes. J Sport Leis Stud. 2011; 43(1):855–864.
21. Oh YH. An econometric analysis of the difference between exercisers and non-exercisers in medical care use. Health Soc Welf Rev. 2013; 33(4):471–496.
22. Kim KS. The relationship among leisure sports' activities, helplessness, social support, and health promoting behaviour of the of the elderly. Hangukseupocheusahoehakhoeji. 2004; 17(1):17–31.
23. Kim KH, Jang HJ. The relationship between sports participation and health promoting lifestyle of elderly. J Korea Sport Res. 2004; 15(6):339–350.
24. Kwon OS. The relationship among the health calisthenics participation, health status, and health promoting lifestyle living in the rural elderly women. Hangukseupocheusahoehakhoeji. 2008; 21(2):423–441.
25. Kim HY. Comparative research on medical expenses according to health risk factors [master's thesis]. Seoul: Yonsei University;2005. 74.
26. Sakong J, Lim HA, Cho MD. Inequality in the medical care utilization and medical expenditure for the patients with chronical illness. Korean J Health Econ Policy. 2012; 18(3):79–101.
27. Kim CH, You WS. The effects of chronic disease numbers to health service utilization. In : 3rd Korea Health Panel Conference; 2011 Dec 1; Seoul Foundation of Women & Family Seoul Women Plaza. Seoul. Korea Institute for Health and Social Affairs & National Health Insurance Corporation;2011. p. 542.
28. Seo YS, Park JH, Lim IH. Factors affecting regular medical care utilization of cardio-cerebrovascular patients. J Digit Converg. 2014; 12(7):327–336.
29. Lee JY, Baek IY. Development of health promotion strategies based on the effect analysis of risk reduction and health cost. Seoul: Yonsei University & Ministry of Health & Welfare;2004. p. 534.
 XML Download