Abstract
Objectives
The present study aimed to estimate the survival rate of teeth after non-surgical root canal treatment and to investigate the effect of income on the tooth survival rate.
Methods
The study included 1,414.668 endodontically treated teeth from 1,193.666 persons enrolled in the National Health Insurance Service in 2002. A survival analysis of the teeth was performed using the Kaplan-Meier method. The survival rates were calculated using a follow-up period of 11 years after the root canal treatment.
Results
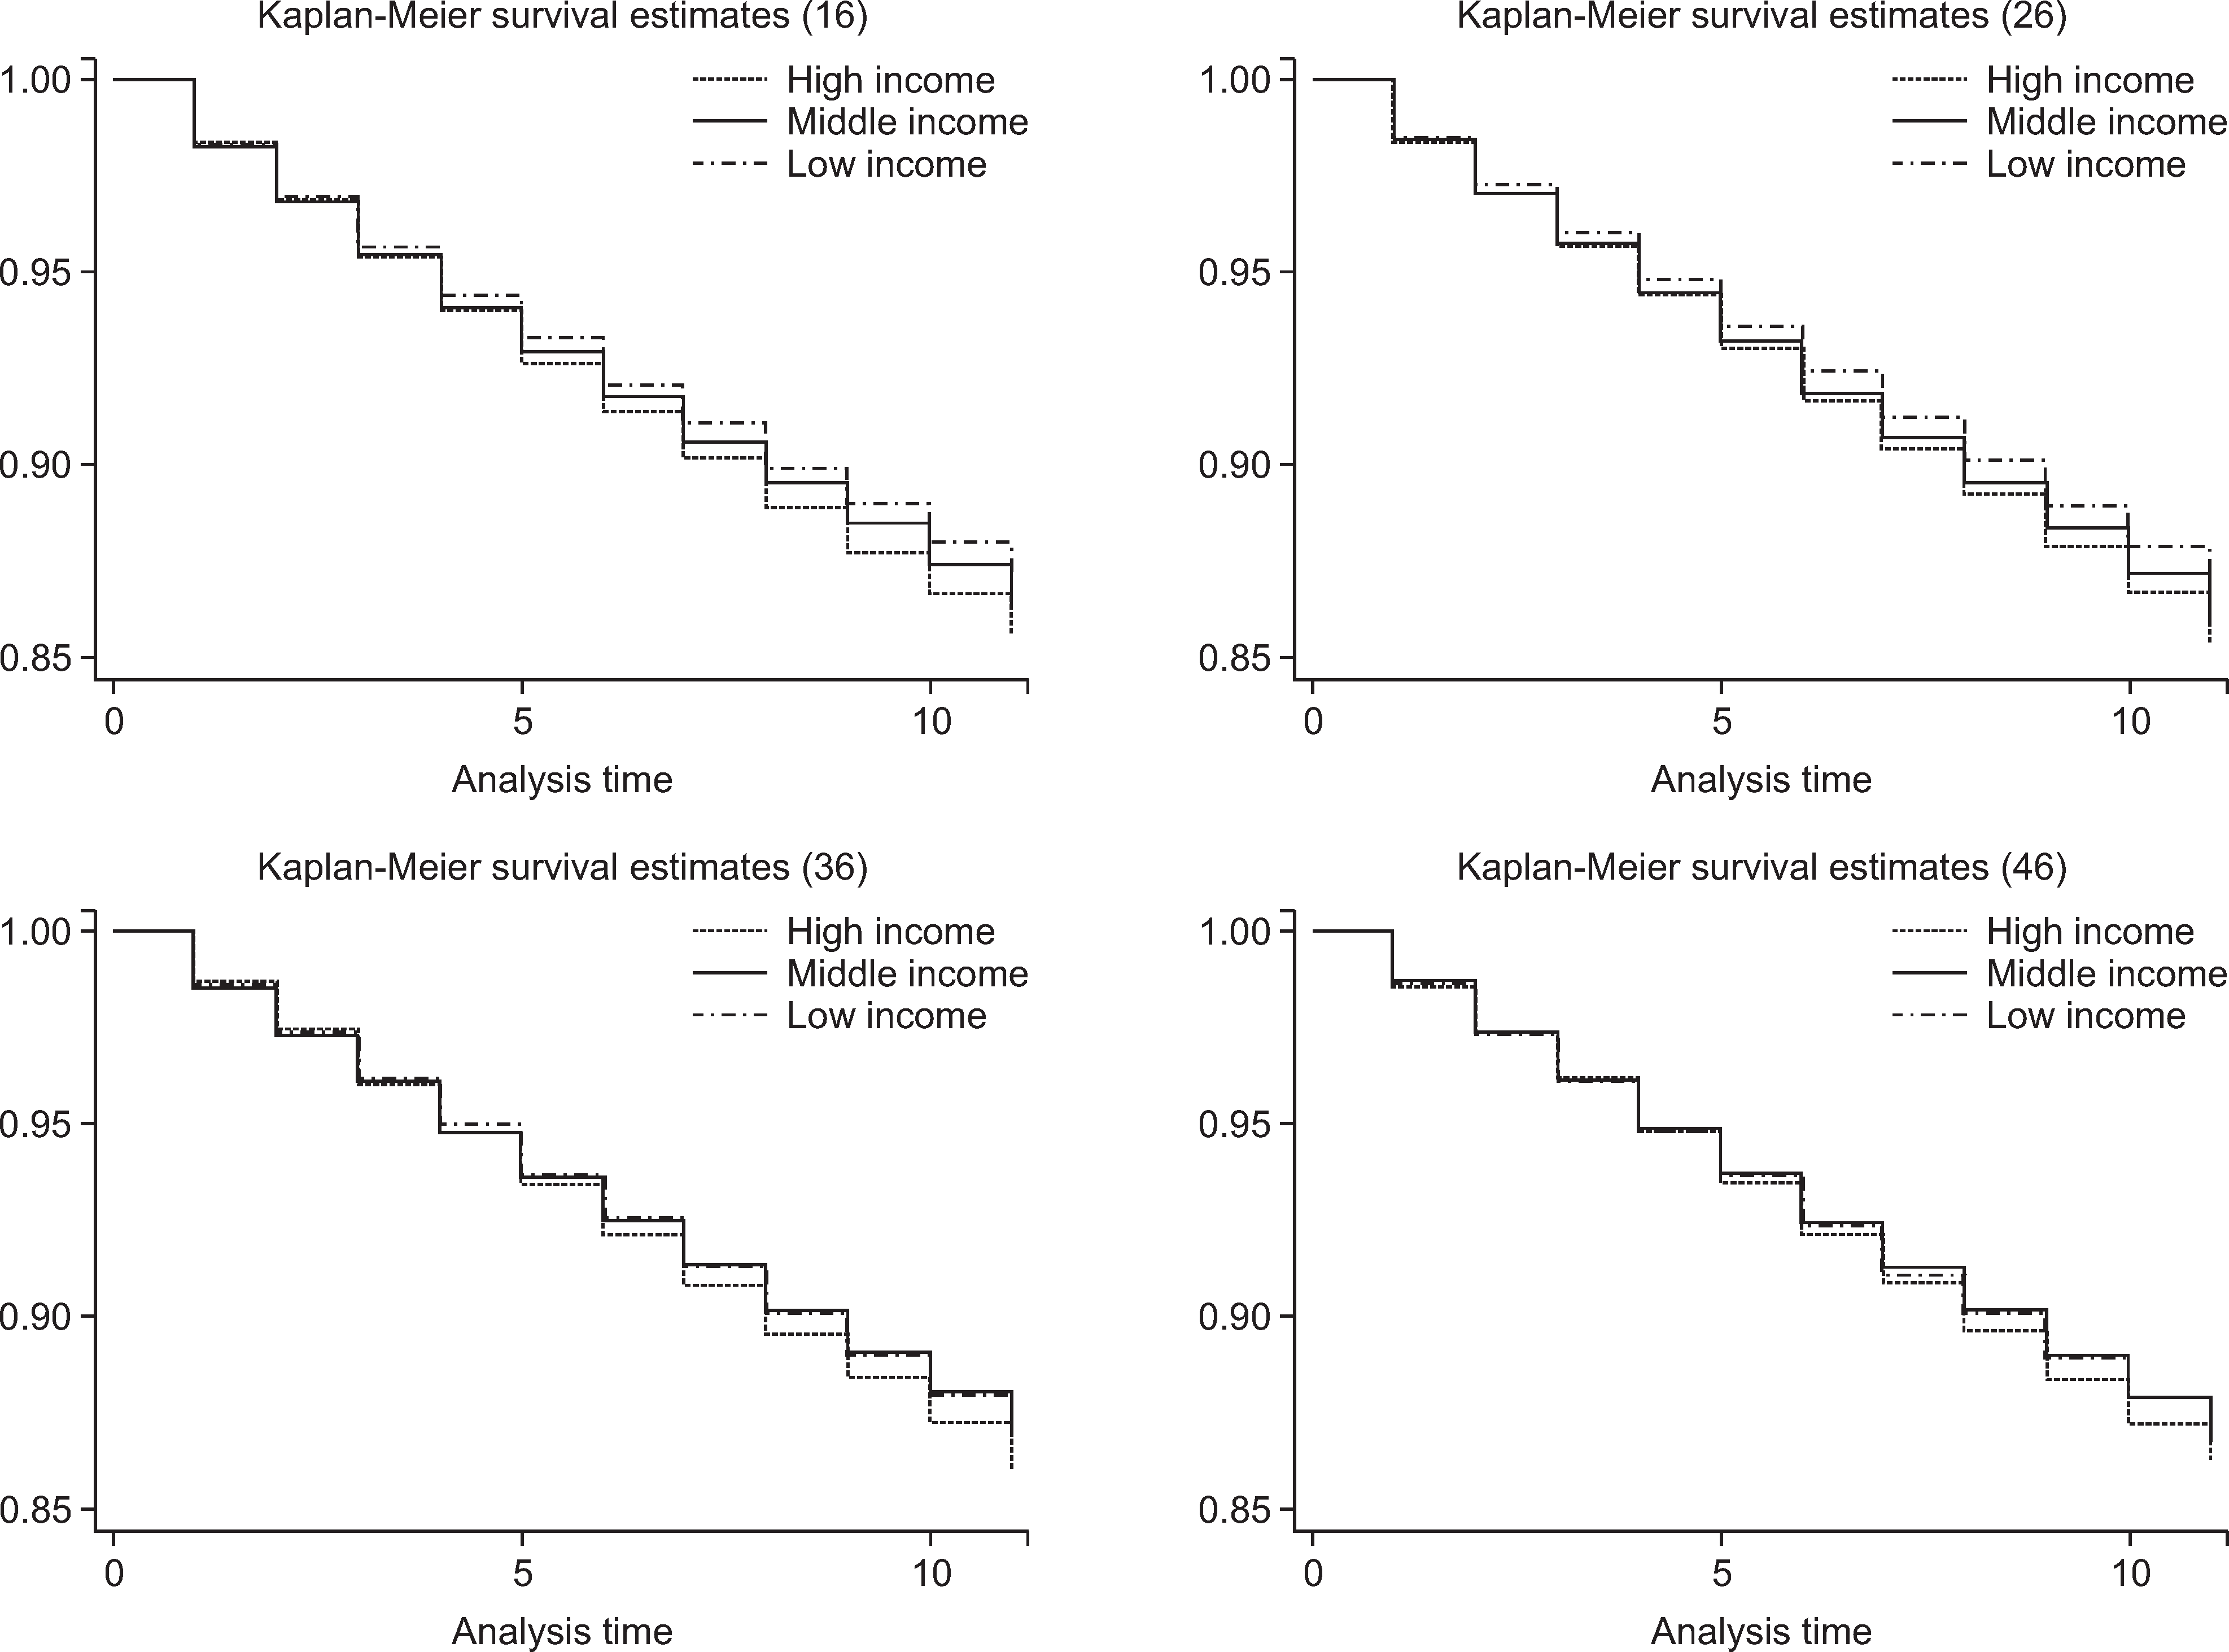
In the present study, the 11-year cumulative survival rate of teeth after non-surgical endodontic treatments was 86.90%. The survival rates of teeth tended to decrease for the posterior teeth; the maxillary teeth showed a lower survival rate than that of the mandibular teeth. The teeth with the highest survival rates were the mandibular left lateral incisor, maxillary right incisor, mandibular right lateral incisor, and maxillary left central incisor, in that order. The lowest survival rates were shown by the mandibular second molar, maxillary second molar, maxillary first molar, and mandibular first molar, in that order. The survival rate of the first molar (#16, #26, #36, #46) was higher in the low-income group than in the high-income group (P<0.001).
Go to : 
References
1. Ellis SG, Ashley MP, Deans RF. A survey of referrals to a restorative dentistry department in a district general hospital. Eur J Prostho-dont Restor Dent. 2001; 9:59–66.
2. Hull TE, Robertson PB, Steiner JC, del Aguila MA. Patterns of endodontic care for a Washington state population. J Endod. 2003; 29:553–556.

3. Health Insurance Review and Assessment Service. Healthcare Bigdata Hub[Interne t]. Health Insurance Review & Assessment Service [cited 2016 Dec 01]. Available from :. http://opendata.hira.or.kr/op/opc/olapHifrqSickInfo.do.
4. Bjørndal L, Reit C. The annual frequency of root fillings, tooth extractions and pulp related procedures in Danish adults during 1977-2003. Int Endod J. 2004; 37:782–788.
5. Rotstein I, Salehrabi R, Forrest JL. Endodontic treatment outcome: survey of oral health care professionals. J Endod. 2006; 32:399–403.

6. Chen SC, Chueh LH, Wu HP, Hsiao CK. Five-year follow-up study of tooth extraction after nonsurgical endodontic treatment in a large population in Taiwan. J Formos Med Assoc. 2008; 107:686–692.

7. Pineda E, Segura AM. Factors associated to endodontically treated tooth survival in patients over 20 years of age seen in a private IPS between 2006 and 2012. Rev Fac Odontol Univ Antioq. 2014; 25:283–298.
8. Salehrabi R, Rotstein I. Endodontic treatment outcomes in a large patient population in the USA: an epidemiologic study. J Endod. 2004; 30:846–850.
9. Fransson H, Dawson VS, Frisk F, Bjørndal L, Kvist T. Survival of root-filled teeth in the Swedish adult population. J Endod. 2016; 42:216–220.

10. National Health Insurance Service. National Health Insurance Sharing Service [Internet]. National Health Insurance Service [cited 2017 Apr 26]. Available from :. https://nhiss.nhis.or.kr.
11. Ruy JY, Nam J, Yi CH. Analysis on the survival rate and impact factors on survival duration for startup medium and small-sized firms in Seoul. Journal of the Korean Urban Management Association. 2014; 27:247–271.
12. Choi JY. Utilization value of medical big data created in operation of medical information system. Journal of the KIECS. 2015; 12:1403–1410.

13. Lee JH, Lee JS, Park JY, Choi JK, Kim DW, Kim YT, et al. Association of lifestyle-related Comorbidities With Periodontitis: A Nationwide Cohort Study in Korea. Medicine (Baltimore). 2015; 94:e1567.
14. Skupien JA, Opdam NJ, Winnen R, Bronkhorst EM, Kreulen CM, Pereira-Cenci T, et al. Survival of restored endodontically treated teeth in relation to periodontal status. Braz Dent J. 2016; 27:37–40.

15. Fransson H, Dawson VS, Frisk F, Bjørndal L, Kvist T. Survival of root-filled teeth in the Swedish adult population. J Endod. 2016; 42:216–220.

16. Jung TG, Paeng JY, Cho JH, Lee SH. The study on success rate of single implant replacing the mandibular first and second molars. J Korean Acad Prosthodont. 2013; 51:252–260.

17. Ahn E, Shin MS. Factors related to the unmet dental care needs of adults with dental pain. J Dent Hyg Sci. 2016; 6:355–360.

18. Kim HS, Ahn E, Kim MY, Kim SM, Shin HS. Trends of household income and dental care spending. J Korean Acad Oral Health. 2014; 38:17–24.

19. Kaiser family foundation. The Kaiser commision on medicaid and the unnsured [Internet]. Kaiser family foundation;[cited 2012 June]. Available from :. https://kaiserfamilyfoundation.files.wordpress.com/2013/03/7798-02.pdf.
20. Asgary S, Verma P, Nosrat A. Treatment outcomes of full pulpotomy as an alternative to tooth extraction in molars with hyperplastic/ irreversible pulpitis: a case Report. Iran Endod J. 2017; 12:261–265.
21. Ahn E, Shin H. On decomposing the determinants of dental utilization inequalities. Journal of the Korean Official Statistics. 2015; 20:140–159.
Go to : 
 | Fig. 1.Survival rate of endodontic treatment of first molars by income (2002-2013). *By Kaplan-Meier method. |
Table 1.
General characteristics by health insurance coverage of study population
Table 2.
Cumulative survival rate and failure rate of root canal treated teeth (2002-2013)
Table 3.
Survival period of tooth after non-surgical endodontic treatment unit: %
Table 4.
Survival rate of first molar root canal treatment according to general characteristics
Table 5.
Cumulative survival rate of endodontic treatment among first molars by income level (2002-2013)
| Tooth number | Income level | Cumulative survival rate | 95% CI | x2 | P† |
|---|---|---|---|---|---|
| #16 | Low | 0.870 | 0.865-0.874 | 23.88 | <0.001 |
| Middle | 0.864 | 0.860-0.868 | |||
| High | 0.856 | 0.852-0.859 | |||
| #26 | Low | 0.868 | 0.863-0.872 | 25.76 | <0.001 |
| Middle | 0.859 | 0.856-0.863 | |||
| High | 0.853 | 0.849-0.856 | |||
| #36 | Low | 0.867 | 0.863-0.872 | 13.11 | <0.05 |
| Middle | 0.868 | 0.864-0.872 | |||
| High | 0.859 | 0.856-0.863 | |||
| #46 | Low | 0.868 | 0.863-0.872 | 9.33 | <0.05 |
| Middle | 0.867 | 0.863-0.871 | |||
| High | 0.860 | 0.856-0.864 |


 PDF
PDF ePub
ePub Citation
 Print
Print


 XML Download