Abstract
Objectives
To understand the relationship between monthly household income and number of remaining teeth as an indicator of oral health, and to find the differences between middle-aged and older people in this respect.
Methods
This study was conducted on data extracted from the Korean National Health & Nutrition Examination Survey, which surveyed all Korean citizens in 2012. From these data, data of 4502 people about 40 years of age who completed the questionnaires and examination survey were selected and analyzed. This study investigated the main factors affecting the remaining teeth, and analyzed the moderating effect of age on the relationship between income level and remaining teeth.
Results
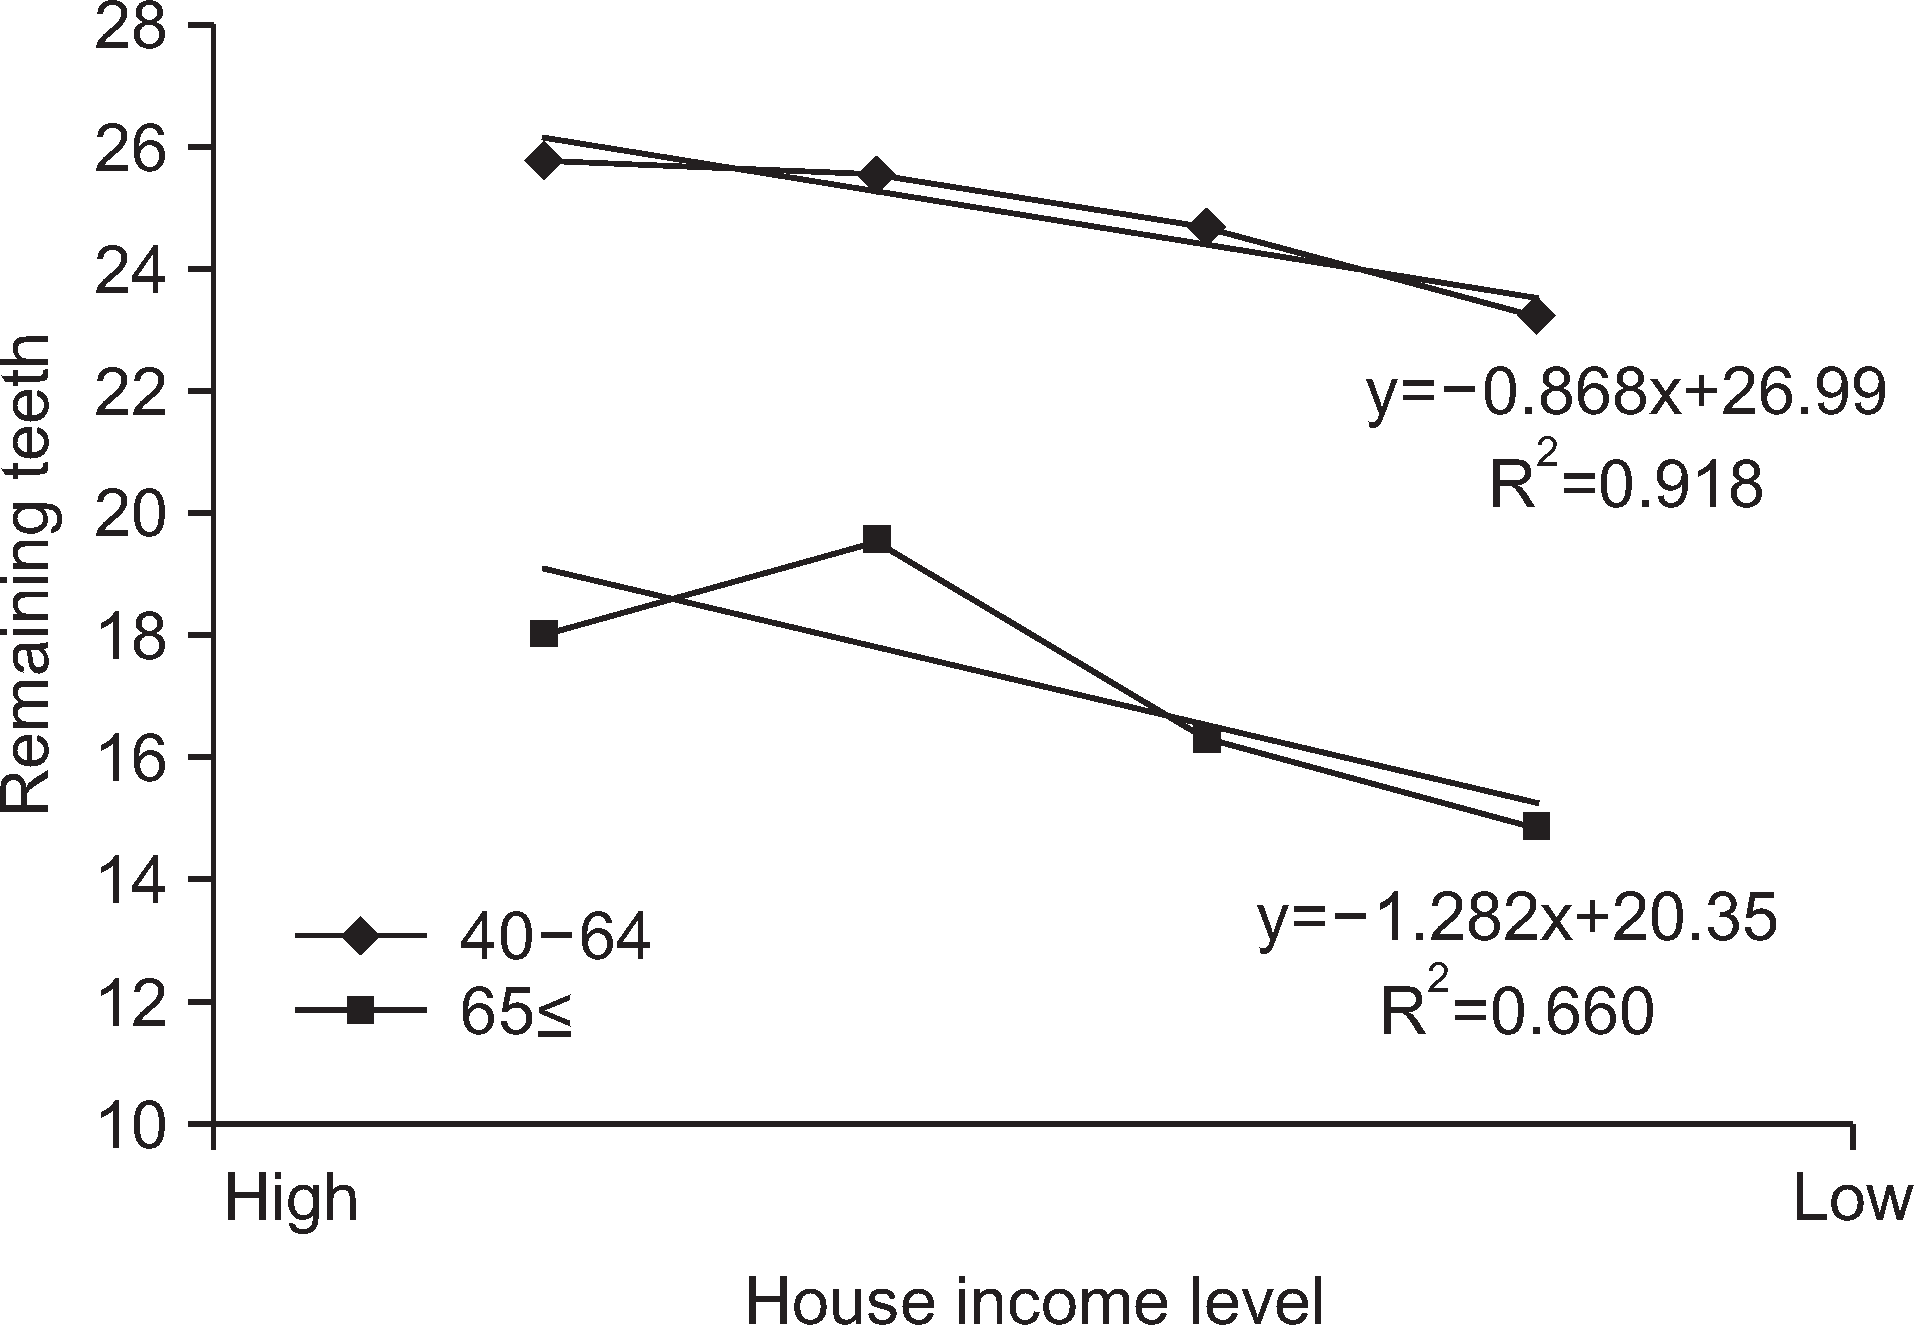
The average number of remaining teeth was 25.17 for middle-aged people and 15.95 for older people, which was significantly different. The number of remaining teeth for middle-aged people showed a significant relationship with income level, education level, and smoking habit. The number of remaining teeth in older people was related to the same factors, along with an additional factor of whether or not they underwent oral examinations. From the interaction analysis conducted to find the moderating effect of age on the relationship between the number of remaining teeth and income level, the number of remaining teeth was more affected by income level in older people than in middle-aged people.
References
1. Lalonde M. A new perspective on the health of Canadians. A Working Document. Ottawa: National Health and Welfare;1974. p. 11–26.
2. Kim YM, Kim MH. Health inequalities in Korea: current conditions and implications. J Prev Med Public Health. 2007; 40:431–438.

3. Adler N. Ostrove J. Socioeconomic status and health: what we know and what we don’t. Ann N Y Acad Sci. 1999; 896:3–15.
4. Woo HB. Income and life expectancy. J KIHASA. 2011; 31:60–94.
5. Kim MK, Chung WJ, Lim SJ, Lee JK, Kim EK. Socioeconomic inequity in self-rated health status and contribution of health behavioral factors in Korea. J Prev Med Public Health. 2010; 43:50–61.

6. Lee MS. Structures of health inequalities of Korean elderly : analysis of Korean longitudinal study of ageing. J Korean Association of Health and Medical Sociology. 2009; 25:5–32.
7. Michael marmot. The status syndrome: how social standing affects our health and longevity. 1st ed. London: Owl Books;2005. p. 1–336.
8. Woda A, Foster K, Mishellany A, Peyron MA. Adaptation of healthy mastication to factors pertaining to the individual or to the food. J Physiol Behav. 2006; 89:28–35.

9. Health insurance review and assessment service. Information, Statistics of Disease DB [Internet]. [cited 2015 Sep 01]. Available from:. http://www.hira.or.kr/rd/dissdic/infoMdfeeList.do?pgmid=HIRAA020044030000.
10. Korea centers for disease control and prevention. The fifth Korea national health and nutrition examination survey(KNHANES V-3). Cheongju: KCDC;2012. p. 1–103.
11. Hayes A. F.Introduction to mediation, moderation, and conditional process analysis: A regression-based approach. New York: The Guilford Press;2013. p. 282–290.
12. Statistical horizons. Paul D. Allison [internet]. [cited 2015 Dec 15].http://statisticalhorizons.com/multicollinearity.
13. Jung OJ, Oh GJ. A study of the relationship between socioeconomic status, oral health behaviors and periodontitis in the elderly Korean population. J Korean Acad Dent Health. 2011; 35:57–66.
14. Friedman PK, Kaufman LB, Karpas SL. Oral health disparity in older adults: dental decay and tooth loss. J Dent Clin North Am. 2014; 58:757–770.
15. Buchwald S, Kocher T, Biffar R, Harb A. Tooth loss and periodontitis by socio-economic status and 4 inflammation in a longitudinal population -based study. J Clin Periodontology. 2013; 40:203–211.
16. Lim HJ, Lee EK. Factors influencing the number of remaining natural teeth in elderly people visiting dental care services. J KSDH. 2013; 13:693–700.

17. Kim MJ, Lee HK. Relationship of dental health assessment to the number of existing permanent tooth in senior citizens visited a dental hospital or clinic from some regions. J KSDH. 2007; 7:161–166.
18. Barbato PR, Nagano HC, Zanchet FN, Boing AF, Peres MA. Tooth loss and associated socioeconomic, demographic, and dental-care factors in Brazilian adults: an analysis of the Brazilian Oral Health Survey, 2002-2003. Cad Saude Publica. 2007; 23:1803–1814.
19. Sanders A, Spencer A, Slade G. Evaluating the role of dental behaviour in oral health inequalities. Community Dent Oral Epidemiology. 2006; 34:71–79.

20. Eklund S, Burt B. Risk factors for total tooth loss in the United States; longitudinal analysis of national data. J Public Health Dent. 1994; 54:5–14.

21. Choi YK, Han SY, Kim CS. Relationship between oral health status and socioeconomic status of elderly in Korea -based on 2010~2011 Korea National Health and Nutrition Examination survey data. J Korea Dent Association. 2013; 51:265–273.
22. Kim JK, Lee KH. How to ensure health of the poor. J KMA. 2013; 11.
23. Jung YH. A Report on the Korea health panel survey : health care utilizations and out-of-pocket spending. J KIHASA. 2011; 64–81.
24. Kim NH, Kim HD, Han DH, Jin BH, Paik DI. Relationship between perceived oral symptoms and perceived oral health status among the elderly in welfare institutions in Seoul. J Korean Acad Dent Health. 2006; 30:141–150.
25. Huh SI, Lee SH. Unmet Health care needs and associated factors among patients with hypertension and those with diabetes in Korea. J Korea Acad Health Policy and Managemen. 2011; 21:1–22.

26. Kang YH, Kim HR. Socioeconomic mortality inequality in Korea: mortality follow-up of the 1998 national health and nutrition ex-amination survey(NHANES) Data. J Prev Med Public Health. 2006; 39:115–122.
27. Galobardes B, Shaw M, lawlor DA, lynch JW, Davey Smith G. Indicators of socioeconomic position. J Epidemiol Community Health. 2006; 60:95–101.
28. Kim JY. The relationship between socioeconomic status and health in Korea-focusing on age variations. J Korea Sociological Association. 2007; 41:127–153.
29. Seo YS. A study on health status by social-economic status of middle-aged and elderly. J Korea Gerontological Society. 2011; 31(4):1135–1153.
Table 1.
Characteristics of the study subjects
Table 2.
The difference between the middle aged and older people remaining teeth (N=4,502)
Table 3.
Factors associated with the remaining teeth (N=4,502)


 PDF
PDF ePub
ePub Citation
 Print
Print


 XML Download