Abstract
Objectives
No evidence has been found on various types of dental erosion, except for occupational dental erosion. This study aimed to evaluate the distribution of four types of dental erosion (occupational, dietary, systemic, and gastric) and its associated factors among workers in factories that use acids.
Methods
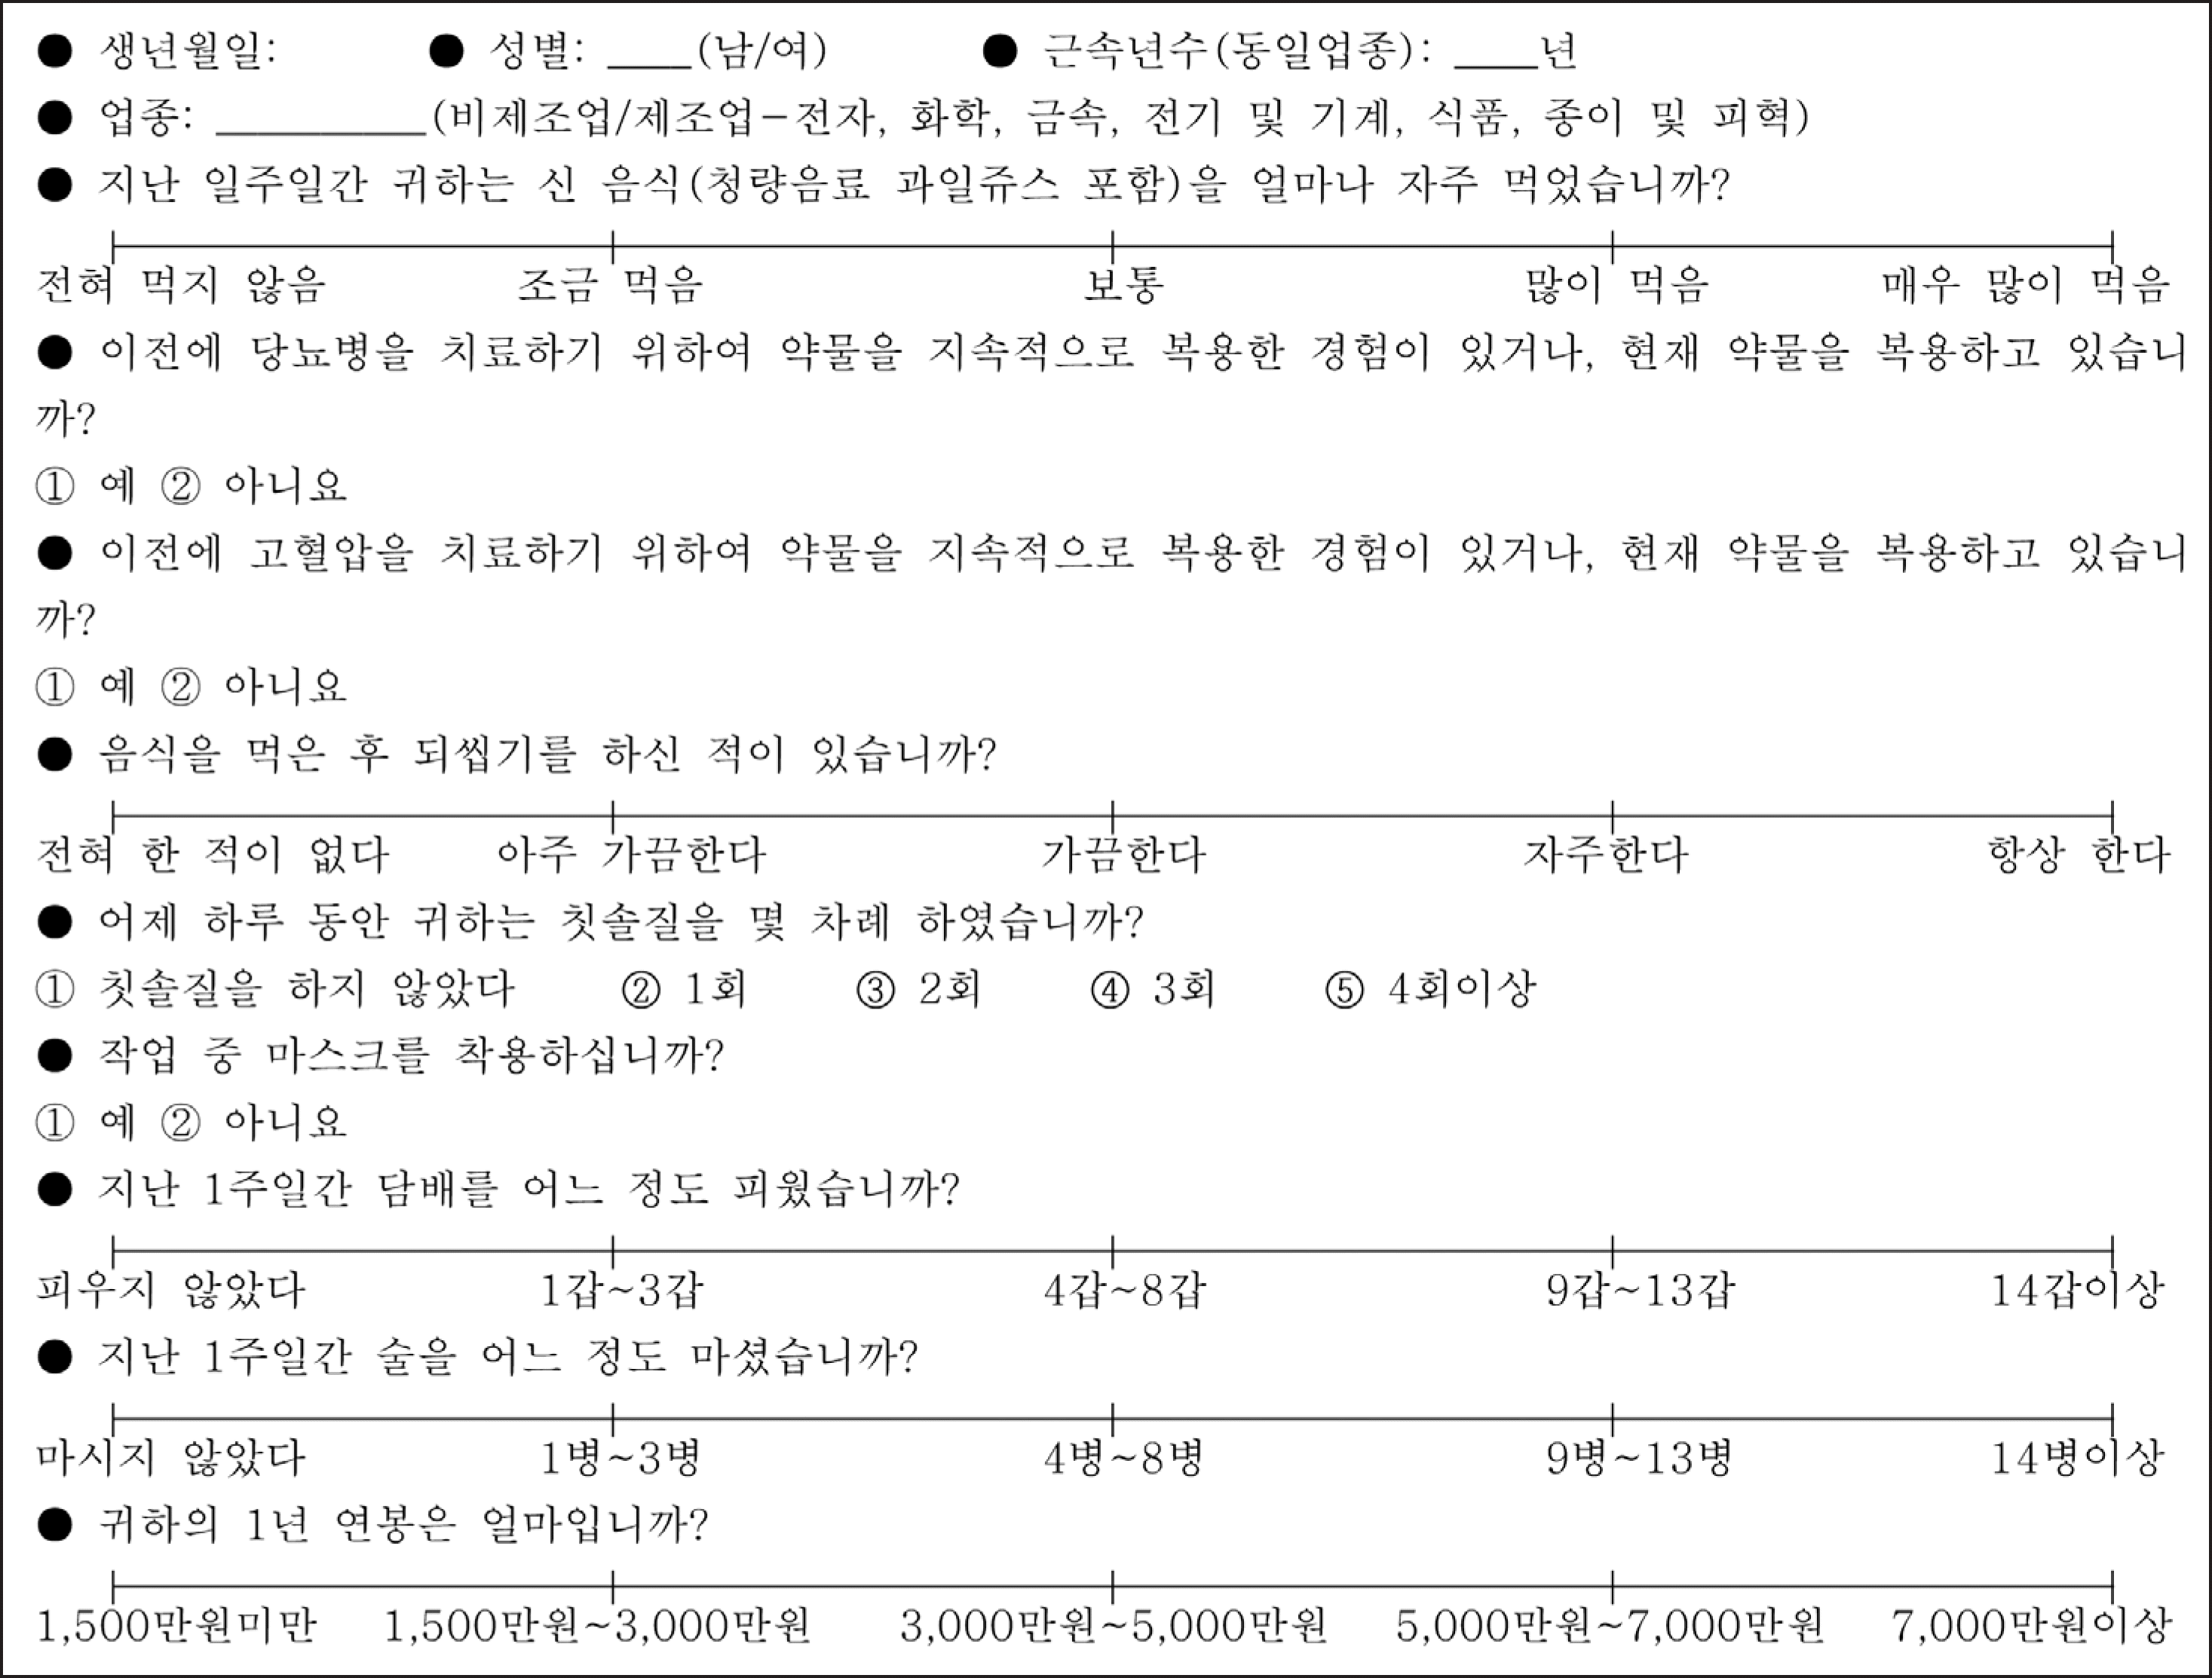
Of 89,034 workers from 4,625 factories that use acids, 716 workers from 38 factories were selected for this cross-sectional epidemiological study by using three-stage stratified cluster sampling. Evaluation for dental erosion was performed by a trained dentist by using Kim's criteria, and a saliva sample was collected directly from each participant. Data on acid sources and associated factors were collected by using questionnaires. By using a complex sample analysis, the T test and Rao-Scott chi-square test were applied to analyze the distribution of four acid factors and to evaluate the associated factors.
Results
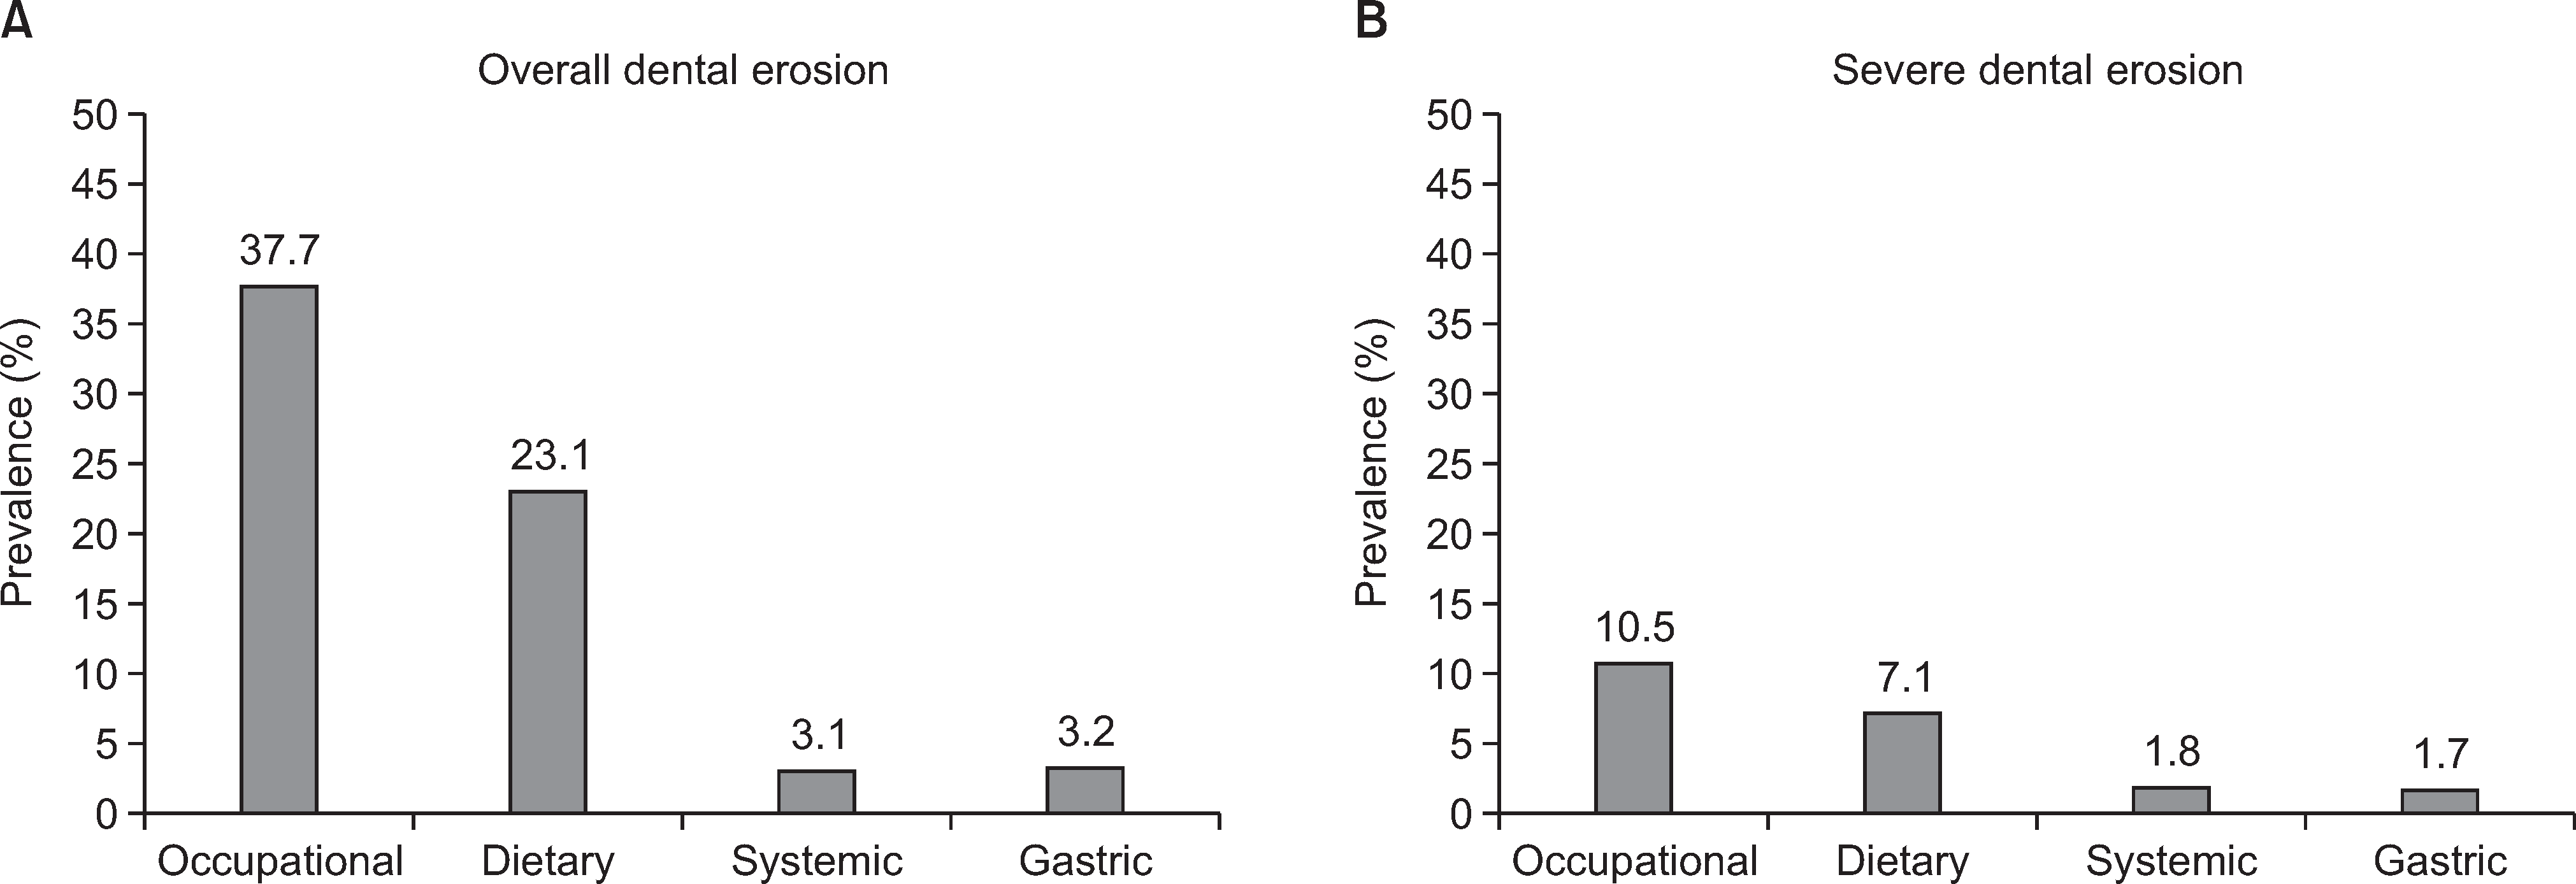
The prevalence of overall dental erosion was 37.7% for occupational dental erosion, 23.1% for dietary dental erosion, 3.1% for systemic dental erosion, and 3.2% for gastric dental erosion. The prevalence of severe dental erosion was 10.5% for occupational dental erosion, 7.1% for dietary dental erosion, 1.8% for systemic dental erosion, and 1.7% for gastric dental erosion. The factors associated with dental erosion were age, sex, acid exposure, dental cervical abrasion, and dental attrition.
Conclusions
Our data showed that the prevalence of dental erosion was high, moderate, and low in occupational, dietary, and gastric and systemic dental erosions, respectively, among workers exposed to acids. The related factors differed according to the types of dental erosion. Our data suggested that different types of promotion programs for dental erosion should be considered according to acid source.
Go to : 
References
1. Imfeld T. Dental erosion. Definition, classification and links. Eur J Oral Sci. 1996; 104:151–155.

3. Kim HD, Kim JB. An epidemiological study on dental erosion among industrial workers exposed to acids in Korea. J Korean Acad Oral Health. 1994; 18:303–338.
4. Kim HD. Occupational dental erosion by tooh type. J Korean Acad Oral Health. 2000; 24:309–318.
5. Zero DT. Etiology of dental erosion-extrinsic factors. Eur J Oral Sci. 1996; 104:162–177.
6. Kim H, Douglass CW. Associations between occupational health behaviors and occupational dental erosion. J Public Health Dent. 2003; 63:244–249.

7. Barbour ME, Lussi A. Erosion in relation to nutrition and the environment. Monogr Oral Sci. 2014; 25:143–154.

8. Hara AT, Carvalho JC, Zero DT. Causes of dental erosion: extrinsic factors. Amaechi BT. Dental Erosion and Its Clinical Management. Springer;2015. p. 69–96.

9. Dodds MW, Yeh CK, Johnson DA. Salivary alterations in type 2 (non-insulin-dependent) diabetes mellitus and hypertension. Community Dent Oral Epidemiol. 2000; 28:373–381.

10. Lasisi TJ, Fasanmade AA. Salivary flow and composition in diabetic and non-diabetic subjects. Niger J Physiol Sci. 2012; 27:79–82.
12. Scaramucci T, Carvalho JC, Hara AT, Zero DT. Causes of dental erosion: intrinsic factors. Amaechi BT. Dental Erosion and Its Clinical Management. Springer;2015. p. 35–67.

13. Kim JB, Paik DI, Moon HS, Kim HD. Knowledge opinion and practices about oral health of workers exposed to acids in Korea. J Korean Acad Oral Health. 1997; 21:155–184.
14. Kim JB, Paik DI, Kim HD. Distribution and management of occupational dental ersoion. Incheon: Korea Occupational Safety & Health Agency;2004.
15. Kim HD, Hong YC, Choi CH, Bae KH, Han DH, Shin MS, et al. Investigation on oral health management and promotion for workers exposed to acids. Incheon: Korea Occupational Safety & Health Agency;2014.
16. Kim HD. Developing oral health program for workers exposed to chemicals. Incheon: Korea Occupational Safety & Health Agen-cy;2008.
17. Kim HD. A guideline of oral examination for workers. Seoul: Korea Occupational Safety & Health Agency;1998.
18. Kim HD, Kim JB, Paik DI, Moon HS. Incidence and distribution of cervical dental erosion. J Korean Acad Oral Health. 1997; 21:9–10.
19. Cole A, Eastoe J. Biochemistry and oral biology. London: Wright;1988. p. 476–7.
20. Choi CH, Kim BI, Kwon HK. Dental erosion prevalence and risk factors in galvanizing and battery manufacture factory workers. J Korean Acad Oral Health. 2002; 26:535–554.
21. Kim EJ, Lee HJ, Lee EJ, Bae KH, Jin BH, Paik DI. Effects of pH and titratable acidity on the erosive potential of acidic drinks. J Korean Acad Oral Health. 2012; 36:13–19.
22. Aguiar YPC, Santos FGD, Moura EFdF, Costa FCMD, Auad SM, Paiva SMd, et al. Association between dental erosion and diet in Brazilian adolescents aged from 15 to 19: a population-based study. Scienti-ficWorldJournal. 2014; 2014.

23. Manaf ZA, Lee MT, Ali NH, Samynathan S, Jie YP, Ismail NH, et al. Relationship between food habits and tooth erosion occurrence in Malaysian University students. Malays J Med Sci. 2012; 19:56–66.
24. Wiegand A, Müller J, Werner C, Attin T. Prevalence of erosive tooth wear and associated risk factors in 2-7-year-old German kindergarten children. Oral Dis. 2006; 12:117–124.

25. Zero DT, Lussi A. Erosion-chemical and biological factors of importance to the dental practitioner. Int Dent J. 2005; 55:285–290.
26. Hara AT, Zero DT. The potential of saliva in protecting against dental erosion. Monogr Oral Sci. 2014; 25:197–205.

27. Bartlett D, Coward P. Comparison of the erosive potential of gastric juice and a carbonated drink in vitro. J Oral Rehabil. 2001; 28:1045–1047.

28. Braga SRM, De Oliveira E, Sobral MAP. Morphological and mineral analysis of dental enamel after erosive challenge in gastric juice and orange juice. Microsc Res Tech. 2011; 74:1083–1087.

Go to : 
 | Fig. 2.Prevalence of overall dental erosion (A) and severe dental erosion (B) according to acid sources. |
Table 1.
Characteristics of participants
| Variables | Category | N |
Occupation |
P-value† | |||
|---|---|---|---|---|---|---|---|
|
Non-Manufacturing¶ |
Manufacturing |
||||||
| N | %* (95% CI) | N | %* (95% CI) | ||||
| Age (years) | <29 | 137 | 26 | 27.5 (22.1-33.7) | 111 | 72.5 (66.3-77.9) | 0.189 |
| 30-39 | 249 | 40 | 22.1 (13.7-33.8) | 209 | 77.9 (66.2-86.3) | ||
| 40-49 | 232 | 21 | 17.3 (11.7-24.8) | 211 | 82.7 (75.2-88.3) | ||
| ≥50 | 98 | 8 | 15.0 (6.9-29.5) | 90 | 85.0 (70.5-93.1) | ||
| Sex | Male | 624 | 68 | 16.6 (11.3-23.8) | 556 | 83.4 (76.2-88.7) | <0.001 |
| Female | 92 | 27 | 46.0 (41-51) | 65 | 54.0 (49-59) | ||
| Occupational acid exposure (year) | <1 | 272 | 42 | 22.4 (14.7-32.6) | 230 | 77.6 (67.4-85.3) | 0.052 |
| 1-5 | 184 | 30 | 27.5 (19.7-36.9) | 154 | 72.5 (63.1-80.3) | ||
| 6-10 | 68 | 9 | 12.7 (7.2-21.5) | 59 | 87.3 (78.5-92.8) | ||
| ≥11 | 192 | 14 | 15.7 (10.5-22.8) | 178 | 84.3 (77.2-89.5) | ||
| Sour food | Little | 420 | 60 | 24.1 (19.6-29.3) | 360 | 75.9 (70.7-80.4) | 0.069 |
| Much | 294 | 35 | 17.3 (10.6-26.9) | 259 | 82.7 (73.1-89.4) | ||
| Diabetes | No | 703 | 93 | 20.8 (15.5-27.4) | 610 | 79.2 (72.6-84.5) | 0.578 |
| Yes | 13 | 2 | 27.5 (8.2-61.8) | 11 | 72.5 (38.2-91.8) | ||
| Hypertension¶ | No | 691 | 93 | 21.3 (15.6-28.3) | 598 | 78.7 (71.7-84.4) | 0.008 |
| Yes | 25 | 2 | 10.3 (6.1-17) | 23 | 89.7 (83-93.9) | ||
| Rumination | No | 675 | 89 | 21.2 (15.8-27.9) | 586 | 78.8 (72.1-84.2) | 0.222 |
| Yes | 38 | 6 | 17.3 (10.1-28.1) | 32 | 82.7 (71.9-89.9) | ||
| Income (million won/year) | <15 | 18 | 2 | 12.2 (8.7-16.9) | 16 | 87.8 (83.1-91.3) | 0.007 |
| <30 | 184 | 34 | 22.4 (13.6-34.7) | 150 | 77.6 (65.3-86.4) | ||
| <50 | 265 | 38 | 24.2 (18.2-31.4) | 227 | 75.8 (68.6-81.8) | ||
| <70 | 131 | 11 | 17.3 (12.7-23.2) | 120 | 82.7 (76.8-87.3) | ||
| ≥70 | 114 | 10 | 12.4 (10.1-15.2) | 104 | 87.6 (84.8-89.9) | ||
| Smoking | No | 410 | 63 | 24.3 (18.1-31.8) | 347 | 75.7 (68.2-81.9) | 0.034 |
| Yes | 304 | 32 | 16.5 (10.3-25.3) | 272 | 83.5 (74.7-89.7) | ||
| Drinking | No | 210 | 41 | 32.2 (24.3-41.3) | 169 | 67.8 (58.7-75.7) | <0.001 |
| Yes | 506 | 54 | 16.4 (12-21.9) | 452 | 83.6 (78.1-88) | ||
| Tooth brushing | ≤2 | 312 | 39 | 18.7 (12.5-27.1) | 273 | 81.3 (72.9-87.5) | 0.050 |
| ≥3 | 401 | 55 | 22.8 (18.1-28.4) | 346 | 77.2 (71.6-81.9) | ||
| Mask protection | No | 366 | 66 | 30.5 (24.2-37.8) | 300 | 69.5 (62.2-75.8) | <0.001 |
| Yes | 350 | 29 | 10.4 (6.9-15.6) | 321 | 89.6 (84.4-93.1) | ||
| Dental cervical abrasion | No | 585 | 84 | 22.1 (16-29.7) | 501 | 77.9 (70.3-84) | 0.131 |
| Yes | 121 | 11 | 16.2 (10.3-24.5) | 110 | 83.8 (75.5-89.7) | ||
| Dental attrition | No | 629 | 89 | 22.7 (17-29.6) | 540 | 77.3 (70.4-83) | 0.035 |
| Yes | 77 | 6 | 11.6 (5.7-22) | 71 | 88.4 (78-94.3) | ||
| Saliva flow rate (ml/min) | 698 | 94 | 0.276‡ (0.018) | 604 | 0.311‡ (0.009) | 0.099‡ | |
Table 2.
Prevalence of acid sources among participants (n=716)
Table 3.
Prevalence of overall dental erosion (G1-5) according to acid sources exposed (n=716)
Table 4.
Prevalence of severe dental erosion (G3-5) according to the acid sources exposed (n=716)


 PDF
PDF ePub
ePub Citation
 Print
Print


 XML Download