Abstract
Objectives
Health inequity across social classes is closely associated with unequal healthcare utilization, and there have been sustained efforts to improve healthcare accessibility. Public healthcare insurance is one attempt to eliminate such health inequities. The purpose of this study was to examine a horizontal equity index for dental service utilization, which included diverse factors affecting health inequity, such as personal health and social context variables.
Methods
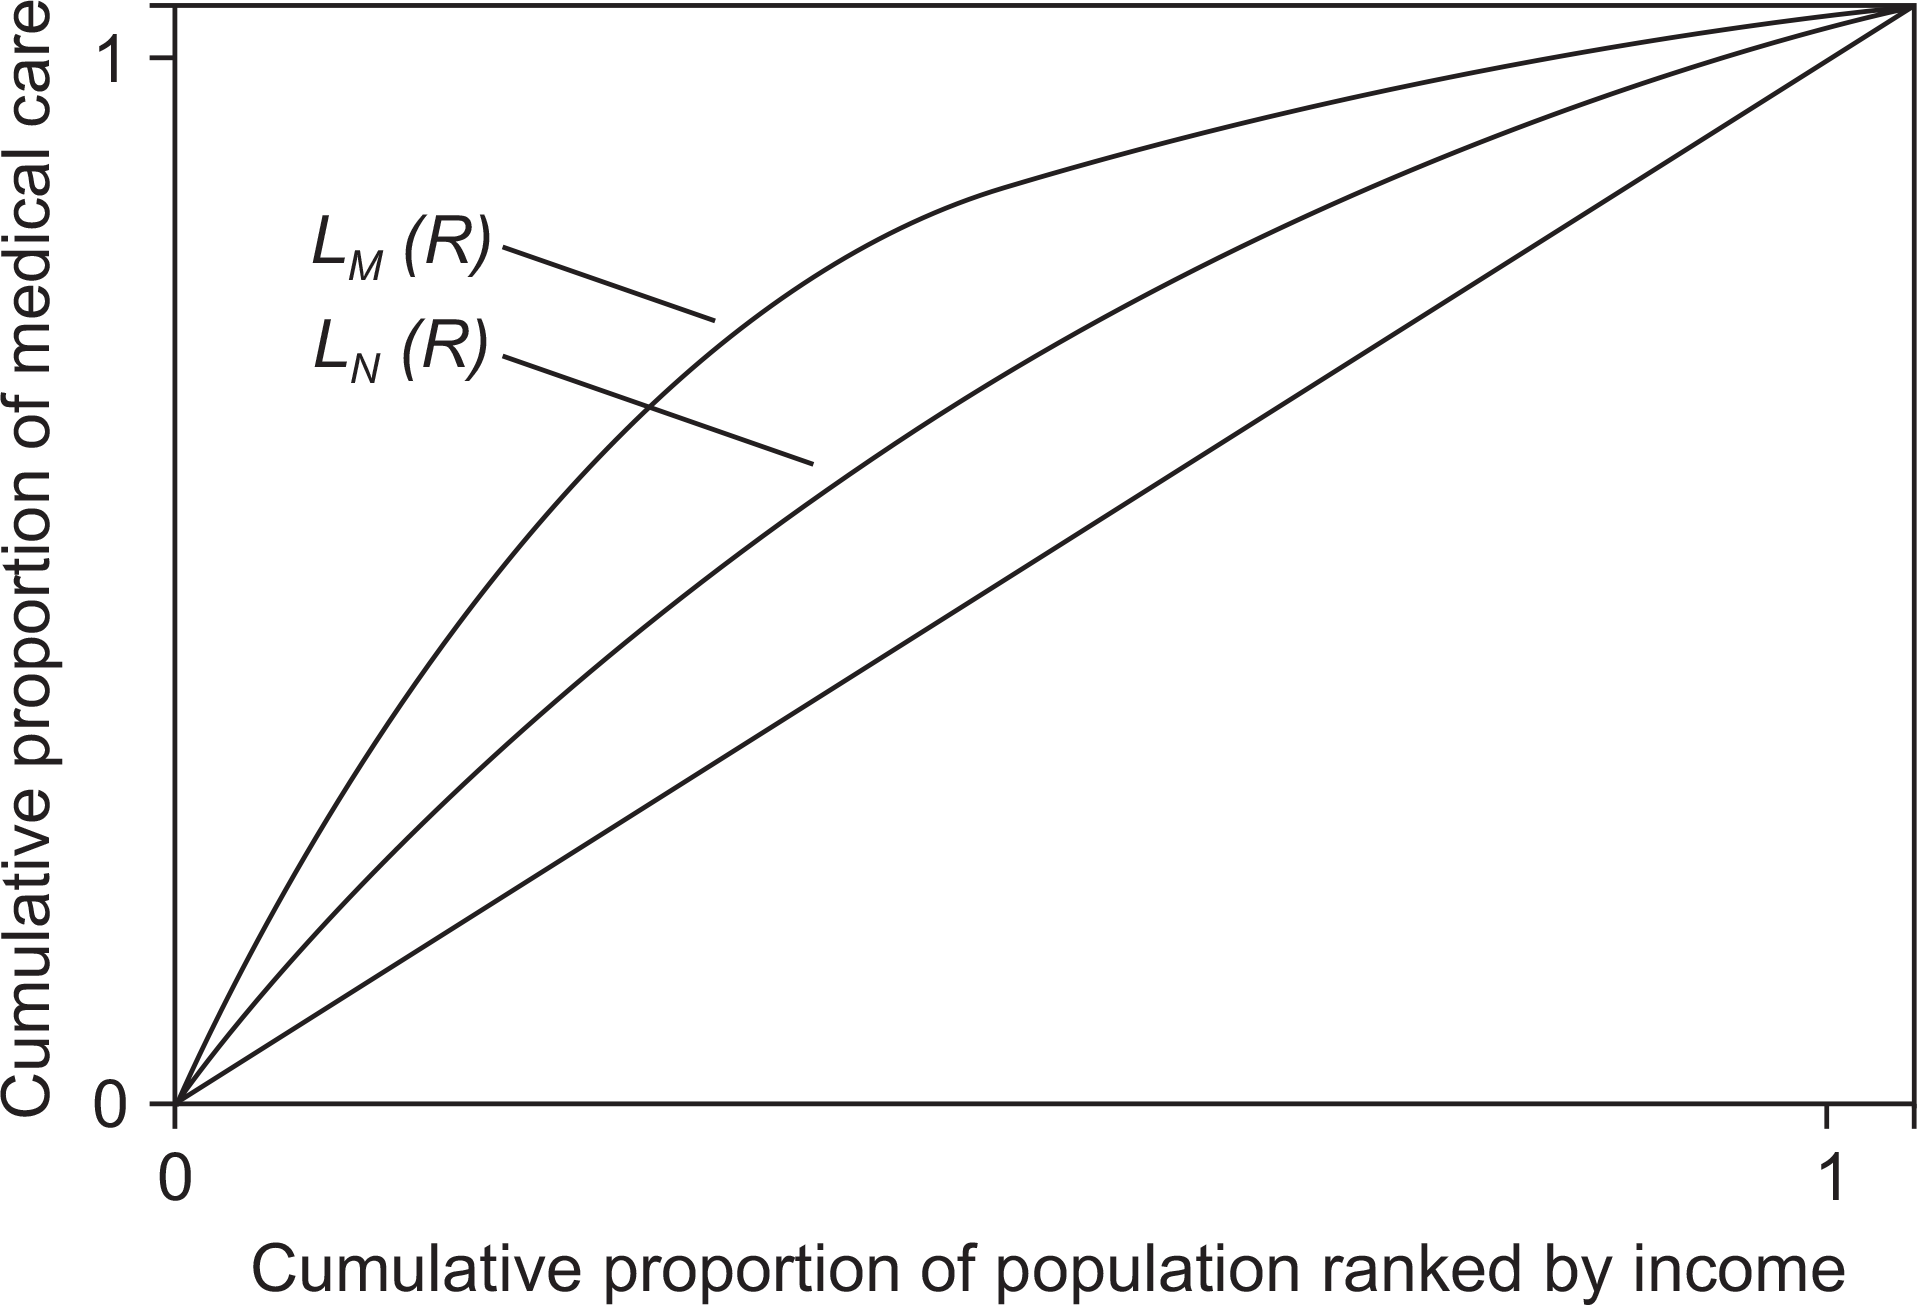
The 2008 to 2011 outpatient datasets of the Korean Healthcare Panel were analyzed. Zero-inflated negative binomial regression (ZINB) was conducted to estimate need-adjusted healthcare use with the following independent variables: health outcome (EQ-5D), chronic disease, and the Composite Deprivation Index. The concentration index and horizontal inequality index were calculated for the actual use of dental services and resource use-based dental visits.
Results
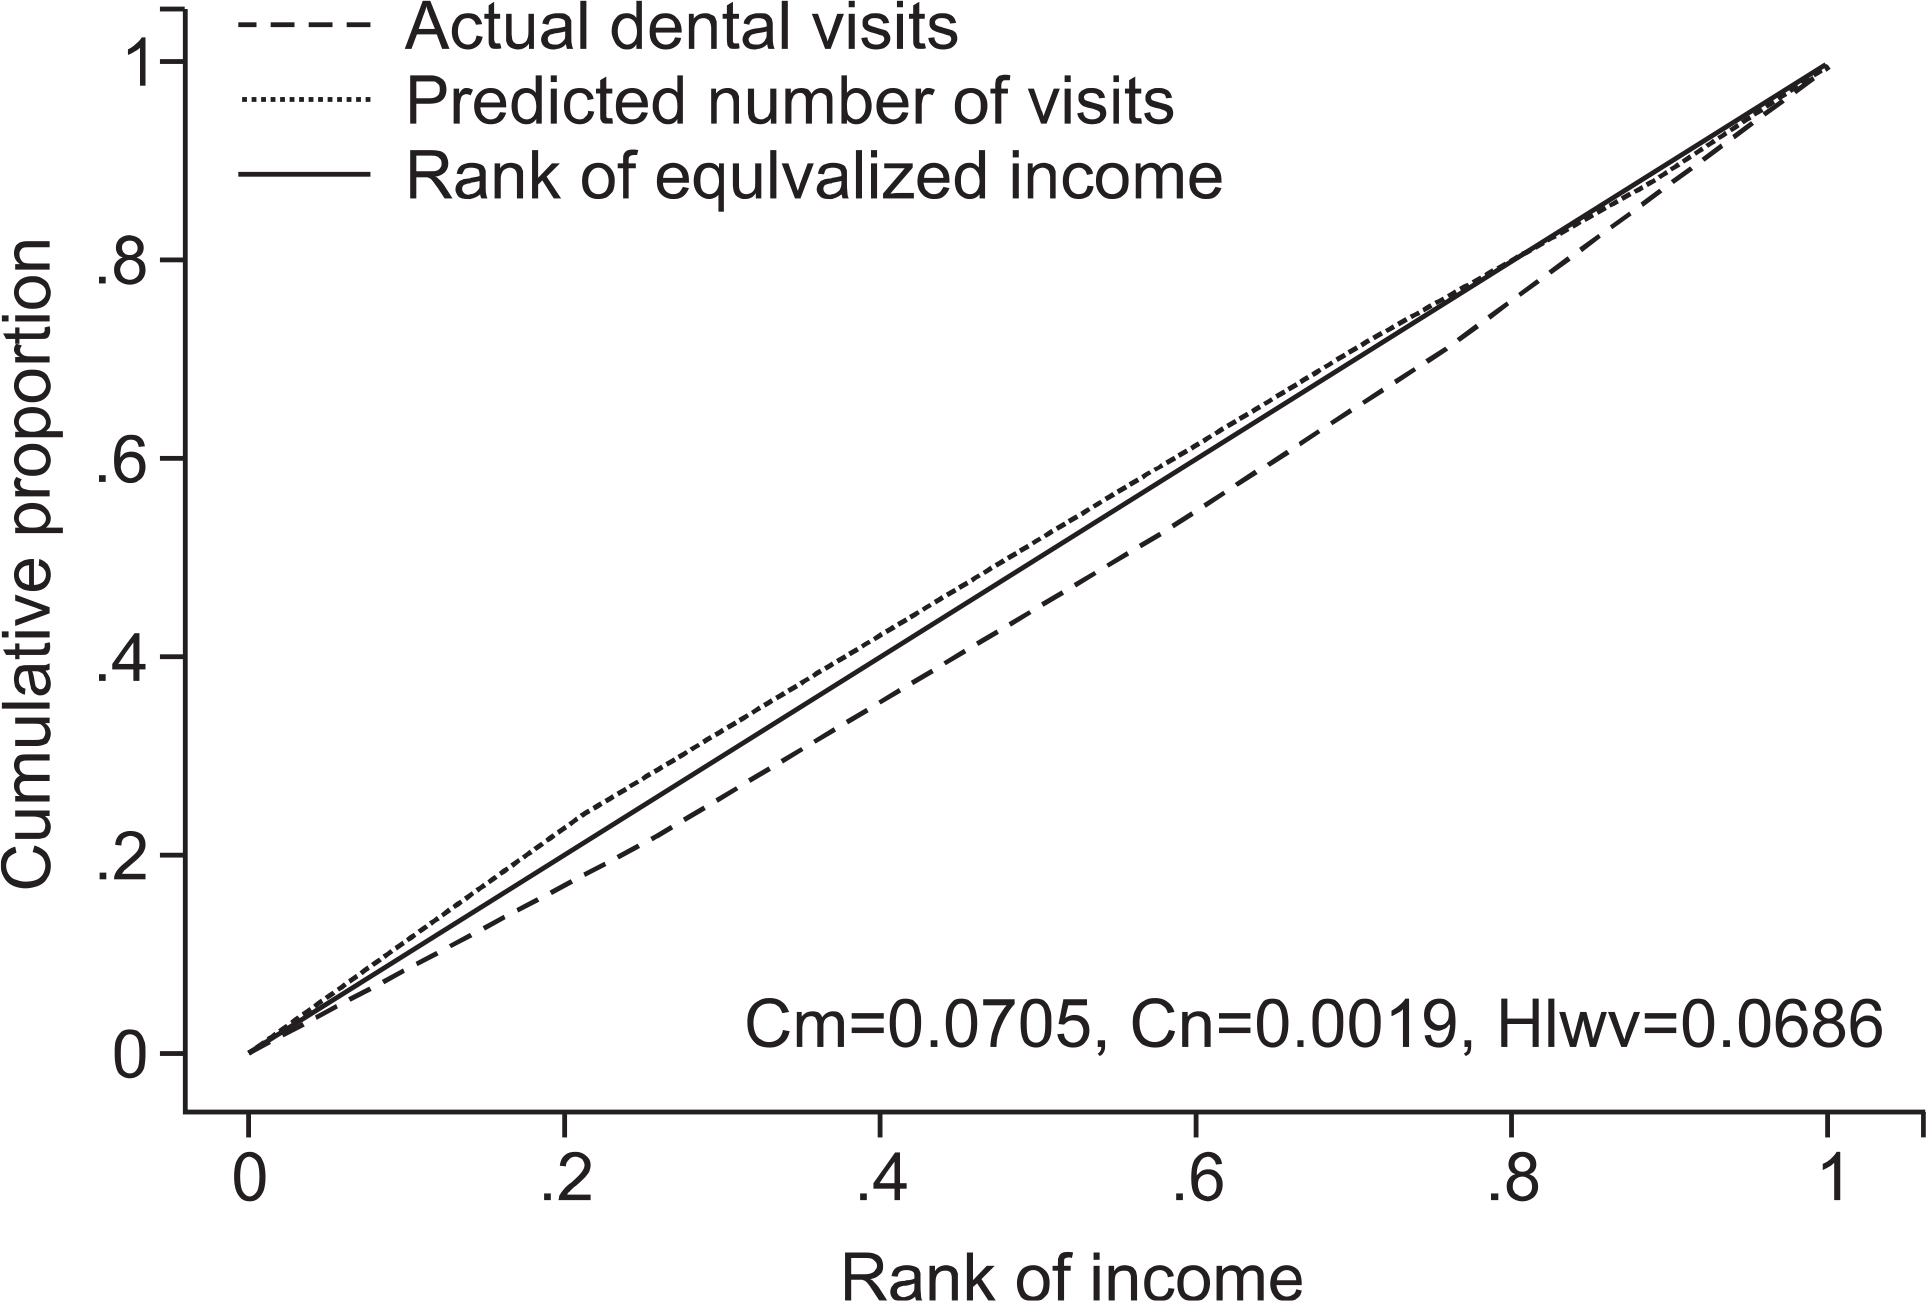
The ZINB regression analysis showed that age and personal health level on the EQ-5D were significant predictors, and the Composite Deprivation Index was influential. The concentration index for dental service utilization indicated that there was inequity favoring high-income brackets, but there was inequity favoring low-income groups when health level was taken into account. Overall, the horizontal equity index for dental service utilization estimated based on the two values was positive, meaning that there was inequity favoring high-income groups.
Conclusions
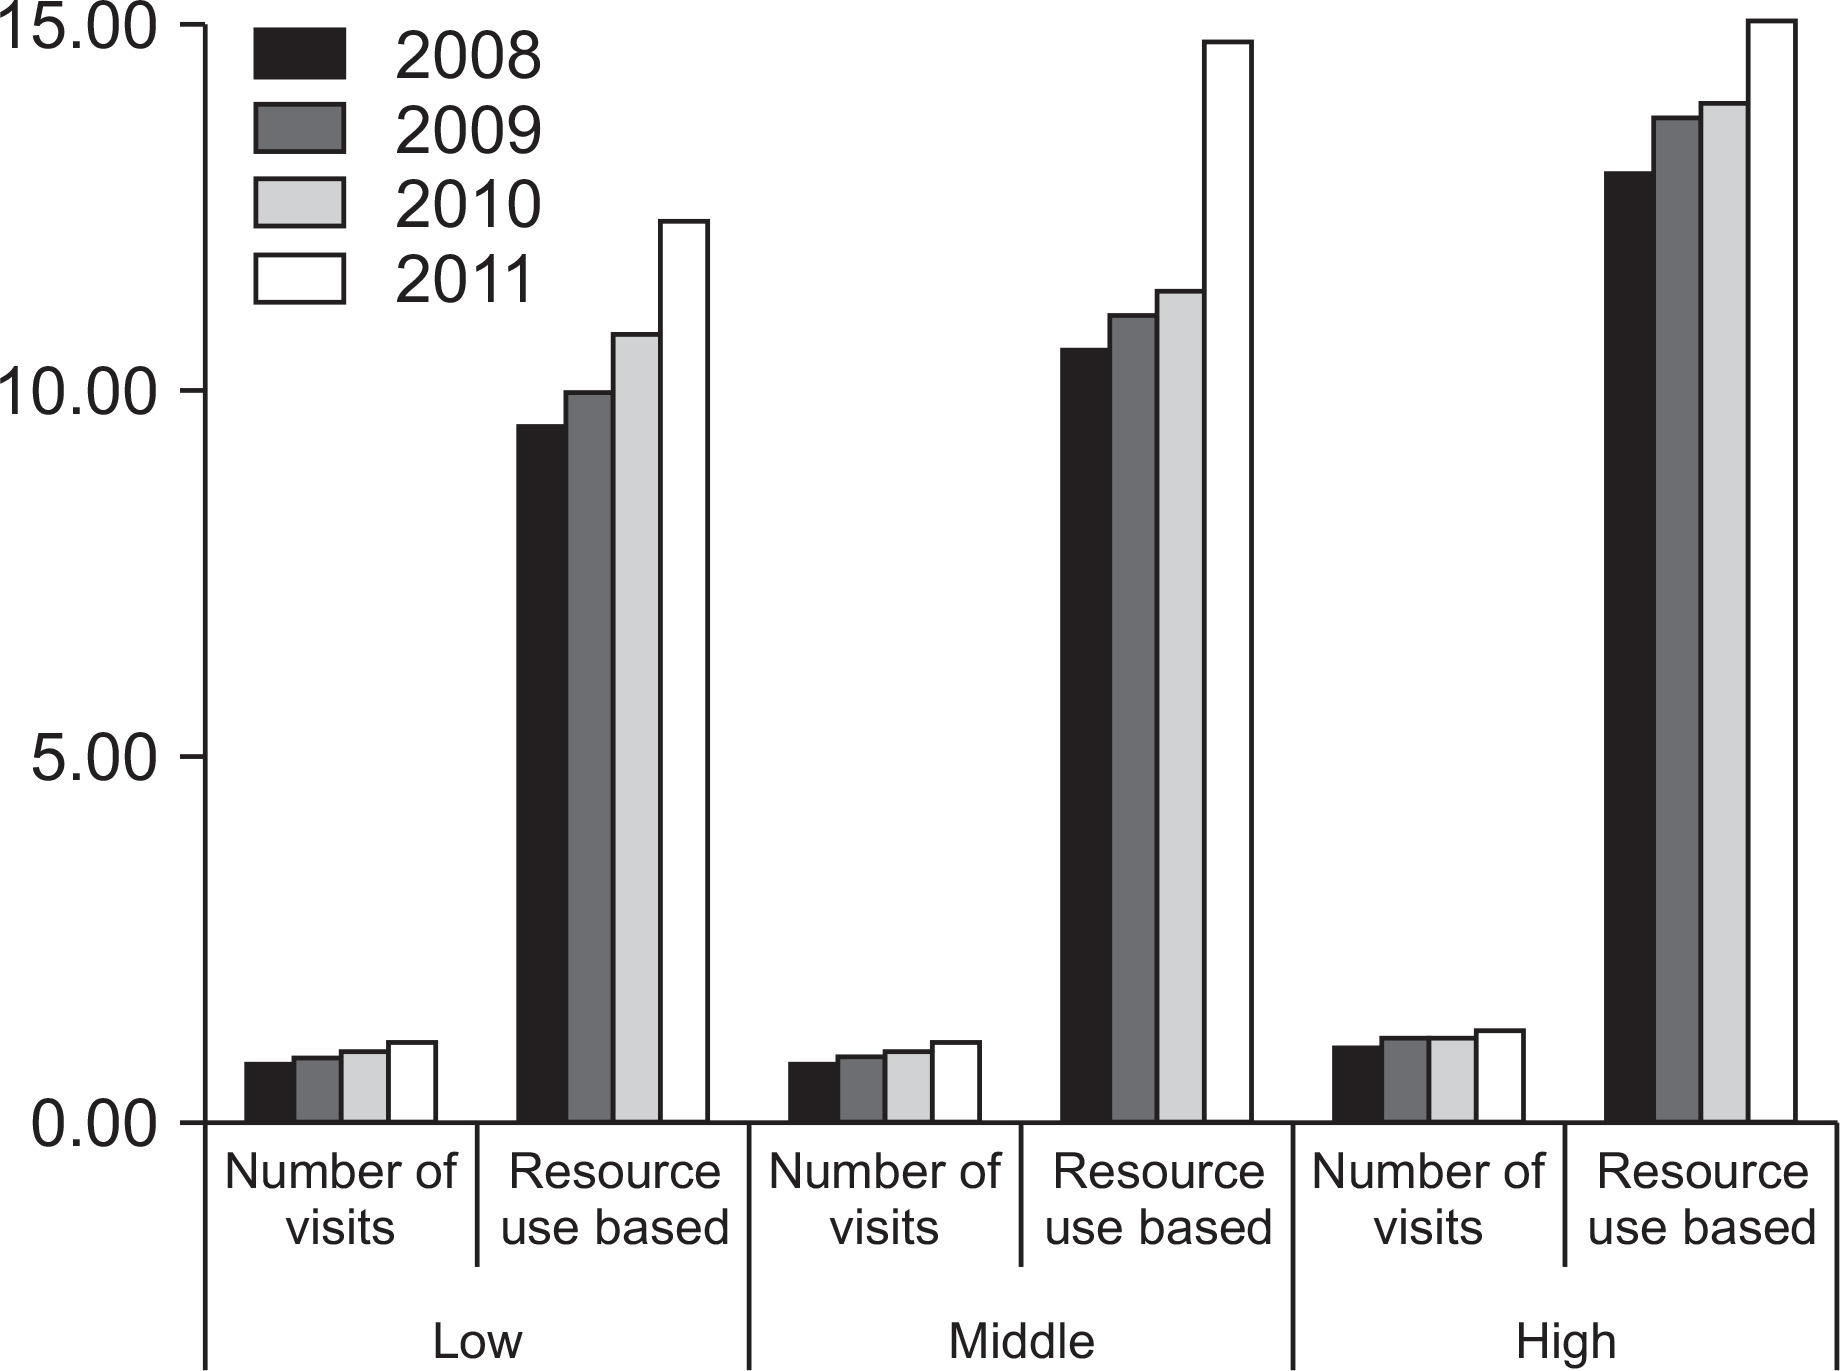
The use of dental services has been steadily on the rise, and dental service accessibility and public healthcare coverage seem to have expanded. However, when the horizontal equity index for dental service utilization was estimated based on health level, there was inequity, with high-income groups making more use of dental services. Thus, equal access to dental services is not guaranteed, despite the adjustment for need. Methods of increasing dental service use in different income brackets must be carefully considered to remove disparities in the use of dental services.
References
1. Kang EJ, Shin HS, Park HJ, Jo MW, Kim NY. A valuation of health status using EQ-5D. The Korean Journal of Health Eco-nomics and Policy. 2006; 12:19–43.
2. O’Donnell O, van Doorslaer E, Wagstaff A, Lindelow M. Analyzing health equity using household survey data. Washington: The World Bank;2007. p. 1–212.
3. Weucg S, Lewis G, Jenkins SP. Income equality and rated health in Britain. J Epidemiol Community Health. 2002; 56:436–441.
4. Aday LA, Anderson RA. A framework for the study of access to medical care: dose it matter? J Health So Beha. 1995; 36:1–10.
5. Levesque JF, Harris MF, Russell G. Patient-centered access to health care: conceptualising access at the interface of health systems and populations. Int J Equity Health. 2013; 11:12–18.
6. Wagstaff A, van Doorslaer E. “Measuring and Testing for inequity in the delivery of health care”. The Journal of Human Resources. 2000; 35:716–733.

7. Lu JF, Leung GM, Kwon S, Tin KY, Van Doorslaer E, O’Donnell O. Horizontal equity in health care utilization evidence from three high-income asian economies. Soc Sci Med. 2007; 64:199–212.

8. Crespo-Cebada E, Urbanos-Garrido RM. Equity and equality in the use of GP services for elderly people: The spanish case. Health policy. 2012; 104:193–199.

9. Wang Y, Wang J, Maitland E, Zhao Y, Nicholas S, Lu M. Growing old before growing rich: Inequality in health service utilization among the mid-aged and elderly in gansu and zhejiang provinces, china. BMC health services research. 2012; 12:302–312.

10. Orueta JF, Garcia-Alvarez A, Alonso-Moran E, Vallejo-Torres L, Nuno-Solinis R. Socioeconomic variation in the burden of chronic conditions and health care provision-analyzing administrative individual level data from the basque country, spain. BMC public health. 2013; 13:870–880.

11. Kim E, Kwon S, Xu K. Has income-related inequity in health care utilization and expenditures been improved? evidence from the korean national health and nutrition examination survey of 2005 and 2010. J Pre Med Public Health. 2013; 46:237–248.

12. Im KH, Lee JH. Income related inequality in medical care utilization by provider types. Korean Journal of health economics and policy. 2010; 16:39–56.
13. Kim D, Kim J, Park E, Shin H. Study on horizontal inequity in health care utilization in Korea. Seoul: Korea Institute for Health and Social Affairs;2011. p. 63–97.
14. Shin H, Kim J. Differences in income-related inequality and horizontal inequity in ambulatory care use between rural and nonrural areas: using the 1998-2001 U.S. National Health Interview Survey data. Int J Equity Health. 2010; 9:1–11.

15. Kim DJ, Lee SY, Ki M, Kim MH, Kim SS, Kim YM, et al. Developing health inequalities indicators and monitoring the status of health inequalities in Korea. Seoul: Korea Institute for Health and Social Affairs;2013. p. 261–385.
16. Niiranen T, Widström E, Niskanen T. Oral health care reform in Finland–aiming to reduce inequity in care provision. BMC Oral Health. 2008; 8:3–11.

17. Maharani DA. Inequity in dental care utilization in the Indonesian population with a self-assessed need for dental treatment. Tohoku J Exp Med. 2009; 218:229–239.

18. Vikum E, Krokstad S, Holst D, Westin S. Socioeconomic inequalities in dental services utilisation in a Norwegian county: the third Nord-Trondelag Health Survey. Scand J Public Health. 2012; 40:648–655.
19. Shin H, Kim HD. Income related inequality of dental care utilization in Korea. Health and Social Welfare Review. 2006; 7:69–93.
20. House J. Understanding social factors and inequalities in health: 20th century progress and 21st century prospect. J Health Soc Behav. 2001; 43:125–142.
22. Shin H, Lee S, Chu JM. Development of composite deprivation index for Korea: the correlation with standardized mortality ratio. J prev Med Public Health. 2009; 42:392–402.

23. Jung YH, Ko SJ, Son CK, Kim EJ, Seo NK, Hwang YH, et al. A report on the Korea Health Panel Survey of 2010. Seoul: Korea Institute for Health and Social Affairs, National Health Insurance Service;2012. p. 21–45.
24. Choi JS, Choi SE, Yeom AL, Yoon JY, Jung HR, Seo NK, et al. Report of 2011 Korea Health Pannel Survey(Ⅱ). Seoul: Korea Institute for Health and Social Affairs, National Health Insurance Corporation;2013. p. 13–39.
25. Long JS, Freese J. Model for count outcomes. Long JS, Freese J, editors. Regression models for categorical dependent variables using stata. 2nd.Texas: A stata press publication;2006. p. 223–262.
26. Shankar V, Milton J, Mannering F. Modeling accident frequency as zero-altered probability processes: an empirical inquiry. Accid Anal and Prev. 1997; 29:829–837.
27. Kim J, Amar S. Periodontal disease and systemic conditions: a bidirectional relationship. Odontology. 2006; 94:10–21.

Table 1.
Composition of Korea Health Panel data
Table 2.
Variables of using analysis
Table 3.
Demographic characteristics of respondents (unit: persons, %)
Table 4.
ZINB regression analysis of the number of visits & adjusted co-payments visits in dental
Table 5.
HIwv index in 2008-2011


 PDF
PDF ePub
ePub Citation
 Print
Print


 XML Download