Journal List > J Korean Acad Oral Health > v.39(2) > 1057675

Chung, Kim, Kim, Jung, Hong, Kim, and Chang: Logistic regression analysis of factors affecting the survival of first molars in Korean adults

Abstract

Objectives

This study aimed to analyze the variables affecting the survival of the four permanent first molars in an adult Korean population using logistic regression analysis.

Methods

The Korean government has been collecting oral health data at the national level at 3-year intervals since 2000. In addition, a national survey was conducted in 2006 among 15,777 persons aged 2-95 years who were stratified by age, gender, and region. The relationship between each of nine objective variables and tooth survival was analyzed by frequency, cross-tabulation, and logistic regression analysis, with age, gender, and economic status as functional variables. The inclusion level was α=0.05 and the exclusion level was α=0.10. The nine variables were age, occupational status, monthly family income, gender, frequency of brushing the teeth, snack intake per day, presence of diabetes, education level, and smoking (packs per year).

Results

The survival rate of the molars decreased with increased age. In individuals who engaged in farming, stock breeding, and fishing, the rate was 2-5 times lower than that of individuals in higher positions in terms of jobs and society. Furthermore, the survival rate for smokers was 5-10 percent lower, compared with non-smokers.

Conclusions

The most significant predictor of the survival rate of the four permanent molars in Korean adults was age, followed by jobs, smoking, and gender.

References

1. Lee SK, Lee KW, Chang KW. Reasons of extracted permanent teeth in Korean population. J Korean Acad Oral Health. 2001; 25:139–163.
2. Klock KS. Patients’ perceptions of the decision-making process leading to extraction of permanent teeth in Norway. Community Dent Oral Epidemiol. 1995; 23:165–169.
crossref
3. Eckerbom M, Magnusson T, Martinsson T. Reasons for and incidence of tooth mortality in a Swedish population. Endodont Dent Traumatol. 1992; 8:230–234.
crossref
4. Klock KS, Haugejorden O. Primary reasons for extraction of permanent teeth in Norway: changes from 1968 to 1988. Community Dent Oral Epidemiol. 1991; 19:336–341.
crossref
5. Morita M, Kimura T, Kanegae M, Ishikawa A, Watanabe T. Reasons for extraction of permanent teeth in Japan. Community Dent Oral Epidemiol. 1994; 22:303–306.
crossref
6. Reich E, Hiller KA. Reasons for tooth extraction in the western states of Germany. Community Dent Oral Epidemiol. 1993; 21:379–383.
crossref
7. Murray H, Locker D, Kay EJ. Patterns of and reasons for tooth extractions in gerneral dental practice in Ontario, Canada. Community Dent Oral Epidemiol. 1996; 24:196–200.
8. Ong G. Periodontal reasons for tooth loss in an Asian population. J Clin Periodontol. 1995; 23:307–309.
crossref
9. Angelillo IF, Nobile CGA, Pavia M. Survey of reasons for extraction of permanent teeth in Italy. Community Dent Oral Epidemiol. 1996; 24:336–340.
crossref
10. Choi SH, Shin SC, Kwon JH, Lyoo YJ, Kim IS, Chang YS, Cho JW. Dental health capacity of the first permeanent molars among Koreans. J Korean Acad Oral Health. 2005; 29:430–440.
11. Choi YH, Suh I, Nam JM, Oh DK, Son HK, Kwon HK. Associations of missing teeth with medical status. J Korean Acad Oral Health. 2002; 26:169–180.
12. Woo HB. Differences in healthy life expectancy by gender and education for middle-aged and older Koreans. Korean J Sociol. 2009; 43:165–187.
13. Lee SE. Differential life expectancy and the progressivity of the national pension system in Korea. Korean Soc Secur Stud. 2006; 22:217–240.
14. Lee HK, Shon KH. A Study on the causes of death that contributed the gaps of life expectancy among Korean and Japanese elderly. J Korean Gerontol Soc. 2005; 25:133–147.
15. Kim GS, Lee HJ, Kim YS, Jeon JG, Chang KW. Logistic regression analysis of factors affecting survival of permanent second molars in Korean adults. J Korean Acad Oral Health. 2013; 37:232–240.
crossref
16. Kim JB, Chung SS, Lee HJ, Kim YS, Jeon JG, Chang KW. Logistic regression analysis of factors affecting the survival of central incisors in Korean adults. J Korean Acad Oral Health. 2014; 87:263–269.
crossref
17. Kim YS, Lee CH, Kim SG, Chang KW. Dental Aesthetic Index (DAI) of Adolescent in Chollabukdo. J Korean Acad Oral Health. 2002; 26:303–312.
18. Han DH, Kim JB. The association between smoking and periodontitis: findings from the Korean National Oral Health Survey 2006. J Korean Acad Oral Health. 2009; 33:634–643.
19. Kim HY. Evaluation of effects of health behaviors and dental service use on the association between socioeconomic status and unmet dental treatment needs. J Korean Acad Oral Health. 2006; 30:85–94.
20. Bergstrom J. Periodontitis and smoking: an evidence-based appraisal. J Evid Based Dent Pract. 2009; 6:33–41.
21. Burt B. Research, science, and therapy committee of the American Academy of Periodontology. Position Paper: epidemiology of periodontal diseases. J Periodontol. 2005; 76:1406–1419.
22. Han GS, Kim YS, Kang JK, Hwang YS, Han DH, Bae KH. Dental hygiene and dental education: Relation of smoking and periodontal status among 30s-50s adults in metropolitan area. J Korean Acad Oral Health. 2008; 32:250–260.
23. Mun SJ, Chung WG, Kim NH. Changes in daily toothbrushing frequency among Korean adults from 2000 to 2006. J Korean Acad Oral Health. 2009; 33:183–191.
24. Koivusilta L, Honkala S, Honkala E, Rimpelae A. Toothbrushing as part of the adolescent lifestyle predicts education level. J Dent Res. 2003; 82:361–366.
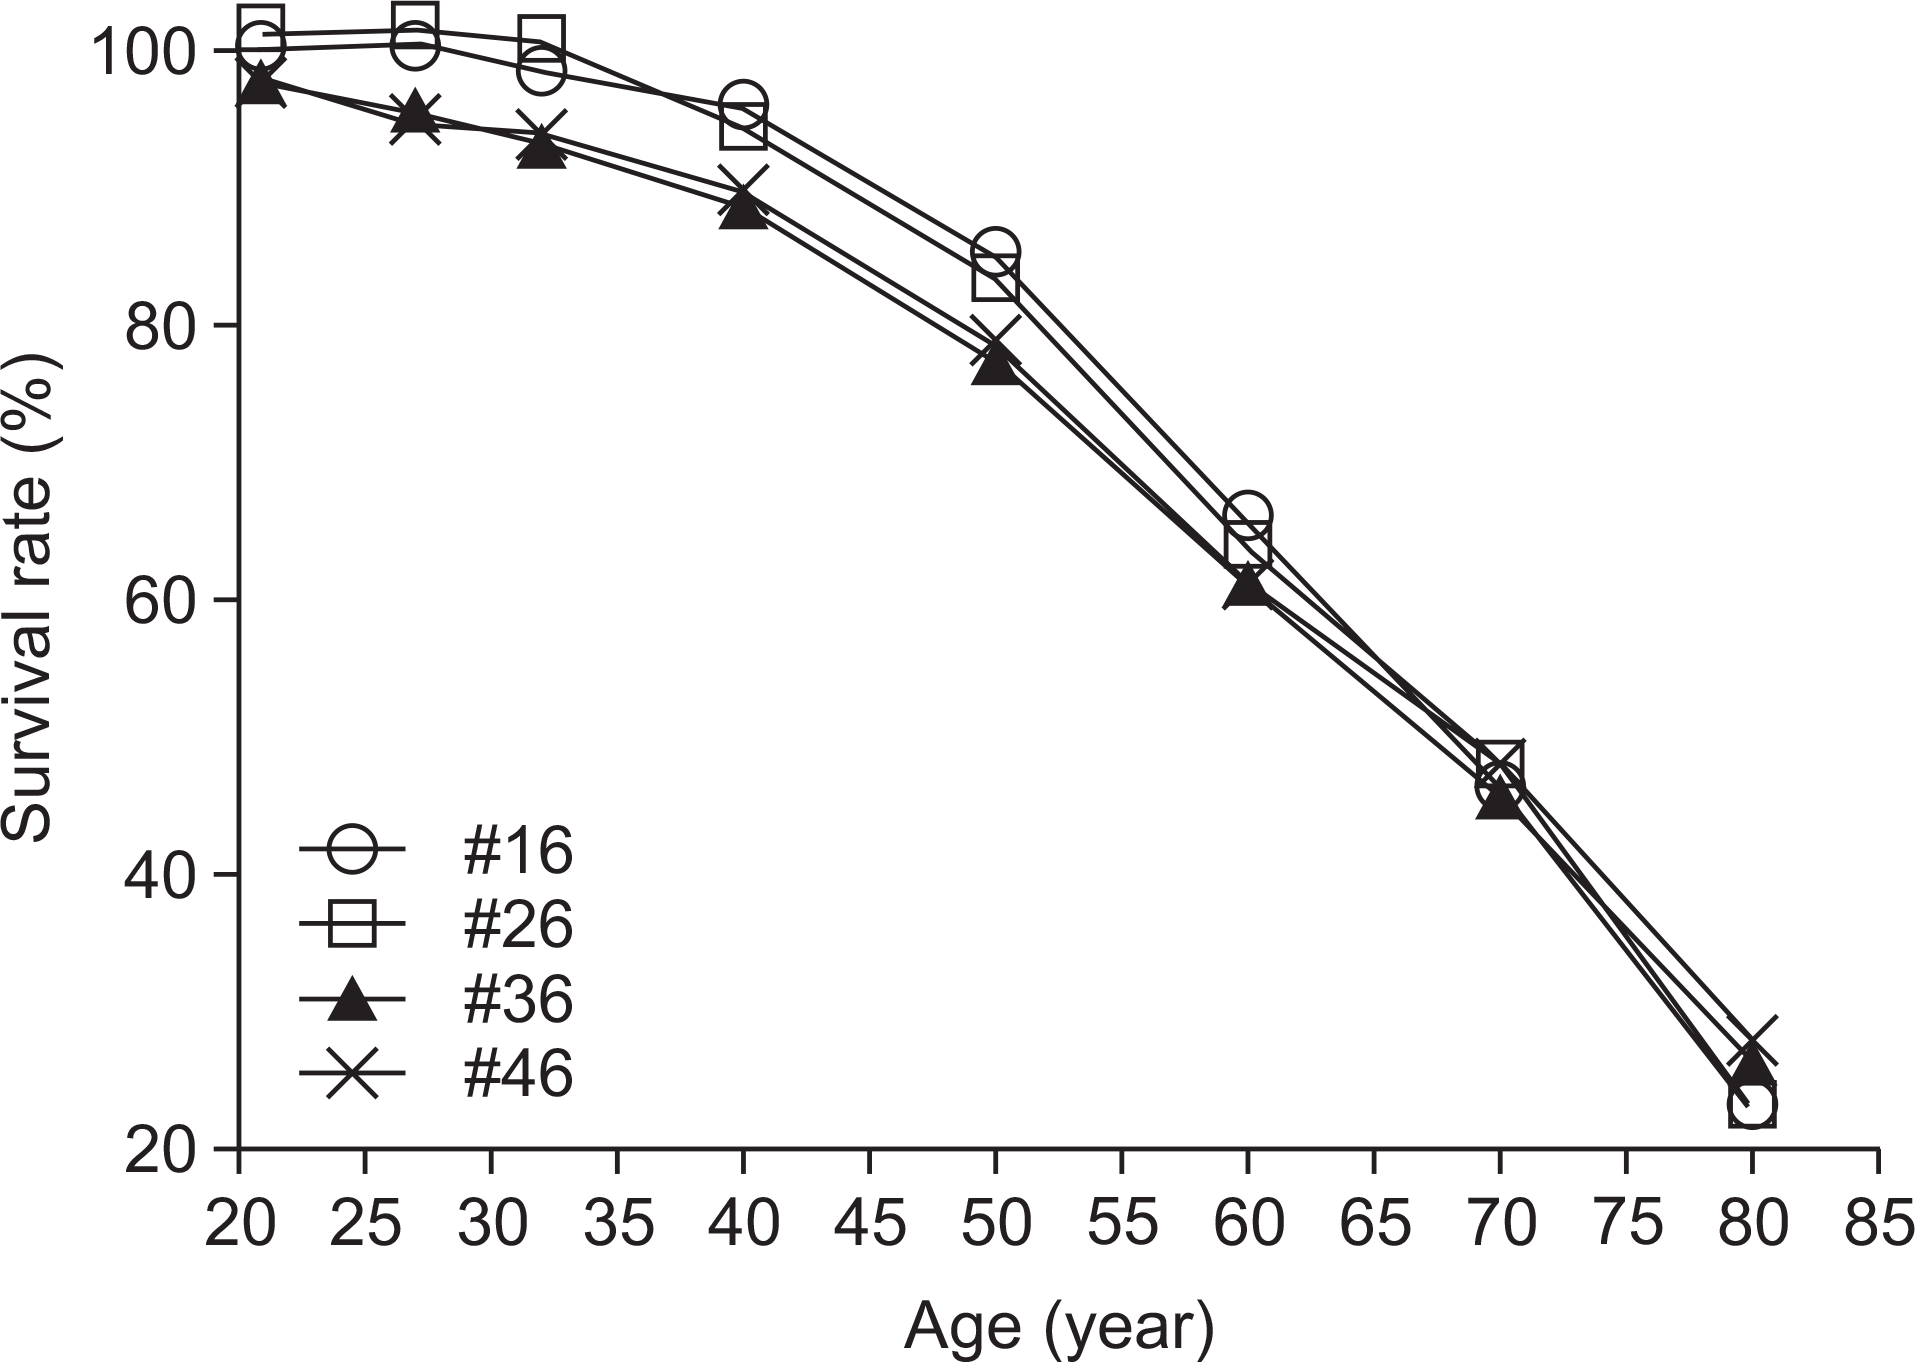
Fig. 1.
Survival rate of 4 molars. #16: maxillary right first molar, #26: maxillary left first molar, #36: mandibular left first molar, #46: mandibular right first molar. Survival rate= No. of all the present teeth /No. of examined teeth including any absent teeth×100 (%).
jkaoh-39-88f1.tif
Table 1
Sample distribution of 2006 Korean national oral health surve with weight reflected
Age Frequency Percent
20-29 2,489 20.8
30-39 2,970 24.9
40-49 2,493 20.9
50-59 1,757 14.7
60-69 1,269 10.6
70+ 973 8.1
Total 11,950 100.0
Table 2.
Logistic regression model estimation to survival in maxillary right first molar (#16)
Variable b S.E. P OR
Exp (b) 95%CI
Age level ―.749 .046 .000 .473 .432 .518
Jobs
High executives, Expert1 Reference .000
Clerk ―.503 .263 .055 .605 .361 1.011
Service workers ―.947 .212 .000 .388 .256 .587
Functional workers ―1.013 .213 .000 .363 .239 .552
Agriculture, animal husbandry2 ―1.573 .233 .000 .207 .131 .327
Soldier and etc. ―1.198 .227 .000 .302 .194 .471
Toothbrushing frequency ―.254 .051 .000 .775 .702 .856
Family income .073 .032 .023 1.076 1.010 1.146
Smoking, pack-year ―.079 .027 .003 .924 .877 .974
Education level .151 .052 .004 1.163 1.050 1.289
Diabetes ―.323 .155 .037 .724 .534 .981
Constant 6.278 .446 .000 532.811

Order of variables entered from 1st to 7th stage: age, Jobs, toothbrushing frequency, family income, smoking, pack-year, education level, diabetes. A level: 10 years per unit. Jobs: 1 high rank executives, staff or manager, expert and professionals (ex: doctor, lawyer); 2 agriculture, animal husband and fishing industry.

Table 3.
Logistic regression model estimation to survival in maxillary left first molar (#26)
Variable b S.E. P OR
Exp (b) 95%CI
Age level ―.863 .041 .000 .422 .389 .457
Jobs
High executives, Expert1 Reference .000
Clerk .344 .226 .129 1.410 .905 2.197
Service workers ―.184 .158 .243 .832 .611 1.133
Functional workers ―.354 .154 .022 .702 .519 .949
Agriculture, animal husbandry2 ―.689 .164 .000 .502 .364 .693
Soldier and etc. ―.206 .166 .215 .814 .587 1.127
Smoking, pack-year ―.100 .026 .000 .905 .860 .951
Diabetes ―.430 .150 .004 .651 .485 .873
Constant 6.188 .219 .000 486.764

Order of variables entered from 1st to 4th stage: age, Jobs, smoking, pack-year, diabetes. Age level: 10 years per unit. Jobs: 1 high rank executives, staff or manager, expert and professionals (ex: doctor, lawyer); 2 agriculture, animal husbandry and fishing industry.

Table 4.
Logistic regression model estimation to survival in mandibular left first molar (#36)
Variable β S.E. P OR
Exp (β) 95%CI
Age level ―.588 .034 .000 .556 .520 .594
Jobs
High executives, Expert1 Reference .000
Clerk .222 .179 .214 1.249 .879 1.773
Service workers ―.179 .135 .186 .836 .641 1.090
Functional workers ―.492 .134 .000 .612 .470 .796
Agriculture, animal husbandry2 ―.884 .150 .000 .413 .308 .554
Soldier and etc. ―.568 .145 .000 .567 .426 .753
Gender (reference: male) ―.652 .081 .000 .521 .444 .611
Smoking, pack-year ―.089 .026 .001 .915 .869 .963
Family income .081 .025 .001 1.085 1.032 1.140
Constant 4.549 .206 .000 94.492

Order of variables entered from 1st to 5th stage: age, Jobs, gender, smoking, pack-year, family income. Age level: 10 years per unit. Jobs: 1 high rank executives, staff or manager, expert and professionals (ex: doctor, lawyer); 2 agriculture, animal husbandry and fishing industry.

Table 5.
Logistic regression model estimation to survival in mandibular right first molar (#46)
Variable β S.E. P OR
Exp (β) 95%CI
Age level ―.592 .035 .000 .553 .517 .592
Jobs
High executives, Expert1 Reference .000
Clerk .033 .184 .857 1.034 .721 1.482
Service workers ―.475 .141 .001 .622 .472 .819
Functional workers ―.478 .144 .001 .620 .468 .823
Agriculture, animal husbandry2 ―1.171 .159 .000 .310 .227 .423
Soldier and etc. ―.669 .154 .000 .512 .379 .693
Gender (reference: male) ―.525 .083 .000 .592 .503 .696
Smoking, pack-year ―.085 .027 .001 .919 .872 .968
Toothbrushing frequency ―.138 .044 .002 .871 .798 .950
Family income .061 .026 .018 1.063 1.011 1.119
Constant 5.132 .248 .000 169.376

Order of variables entered from 1st to 6th stage: age, Jobs, gender, smoking, pack-year, toothbrushing frequency, family income. Age level: 10 years per unit. Jobs: 1 high rank executives, staff or manager, expert and professionals (ex: doctor, lawyer); 2 agriculture, animal husbandry and fishing industry.

TOOLS
Similar articles