Journal List > J Korean Acad Oral Health > v.39(1) > 1057671

Jin, Kim, Park, Jeong, Bae, Kim, Jeong, Lee, Woo, and Choi: Diagnostic predictability of self-reported questionnaire for periodontitis

Abstract

Objectives

The present study aimed to evaluate the validity of a set of self-reported questionnaires for periodontitis for estimating the prevalence of chronic adult periodontitis in the Korean population.

Methods

The questionnaire is comprised of a total of 14 questions with four summarized concepts including self-diagnosis of oral status, subjective signs related to oral health, smoking and drinking status, and use of auxiliary oral hygiene devices including scaling. The predictiveness of the measures from these self-reported questions was assessed by logistic regression modeling using receiver operating characteristic (ROC) statistics, sensitivity, and specificity.

Results

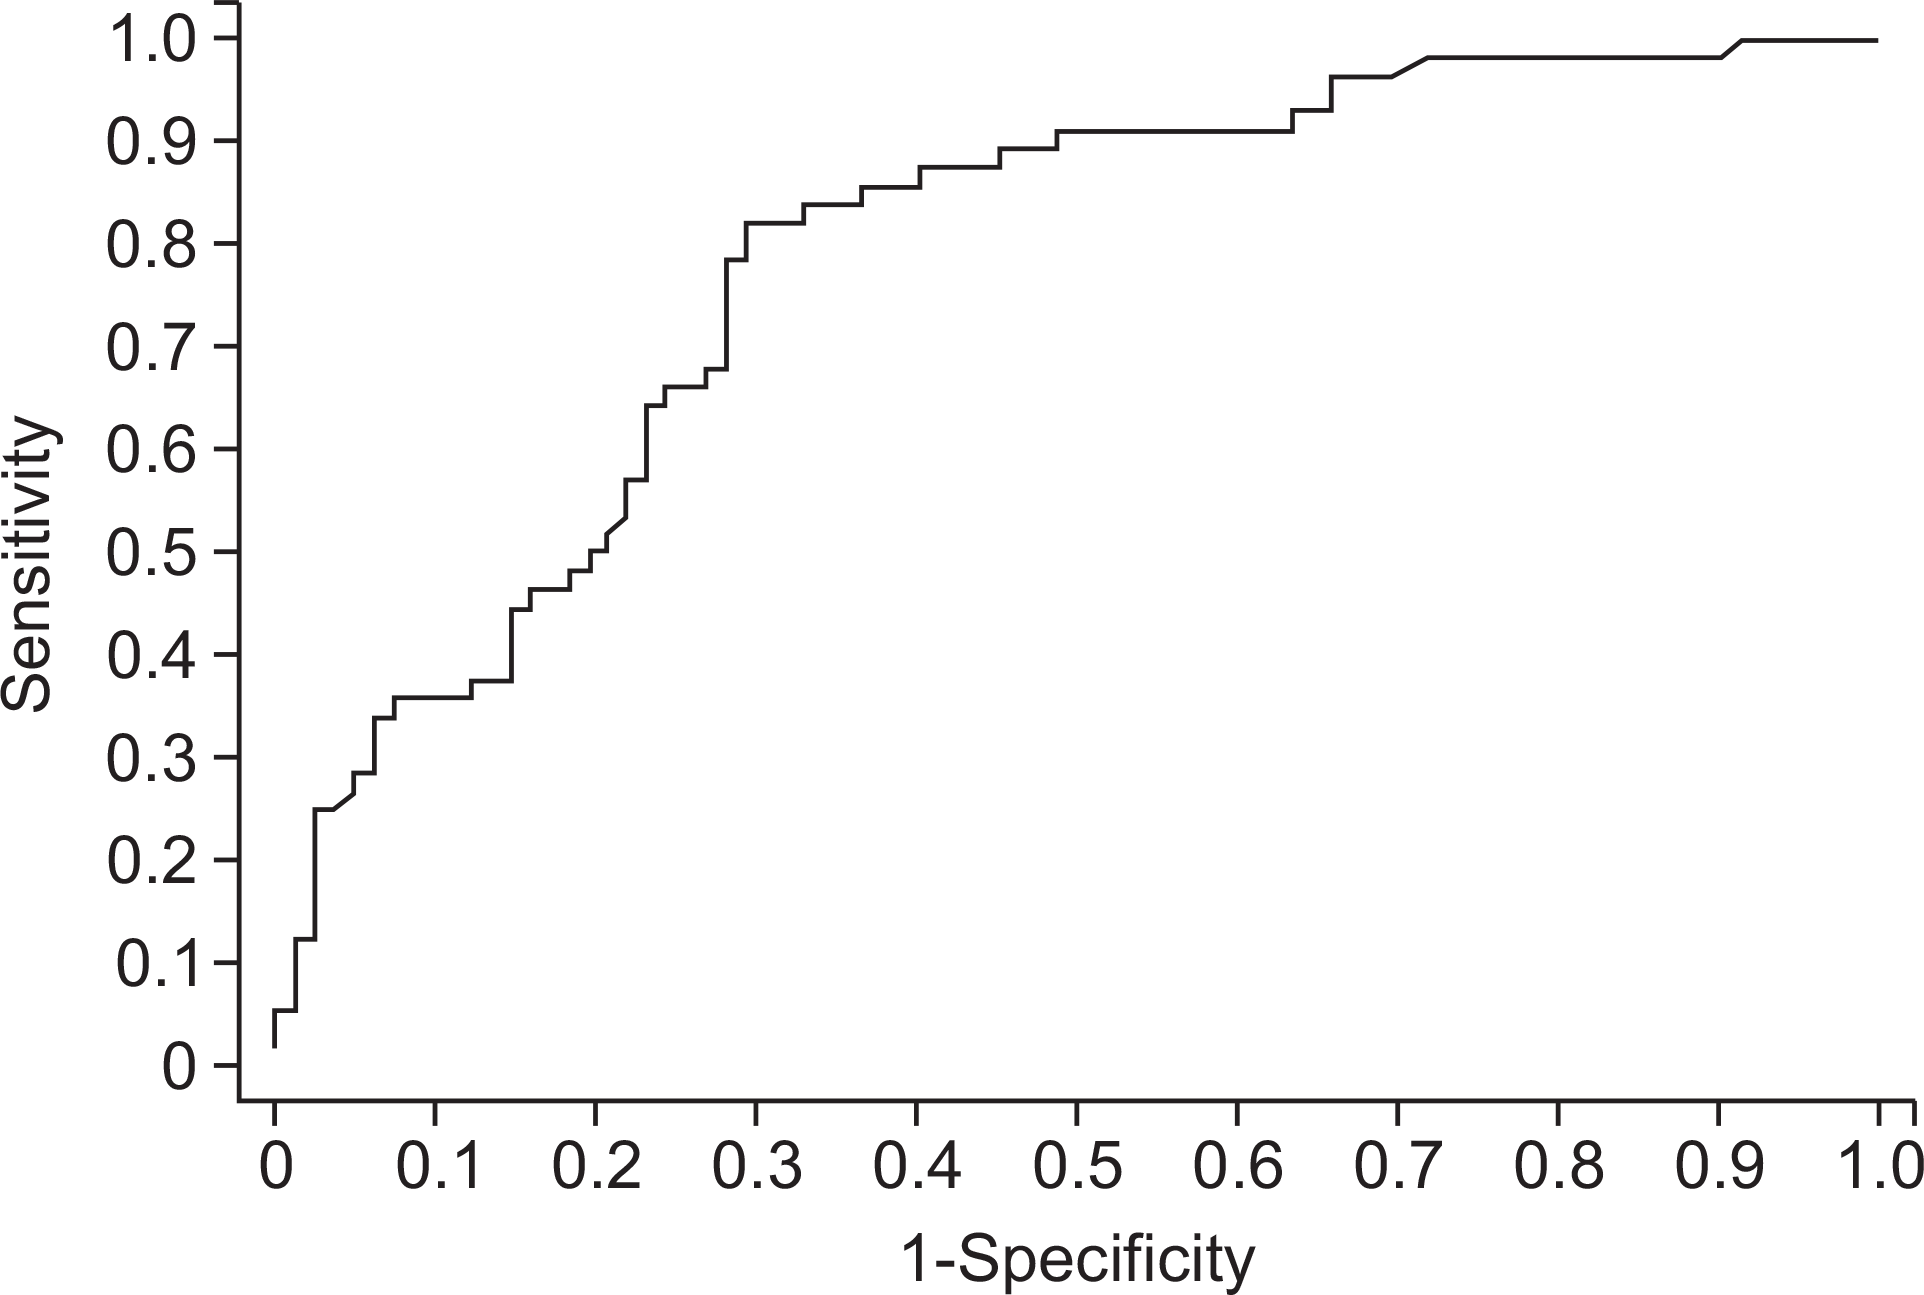
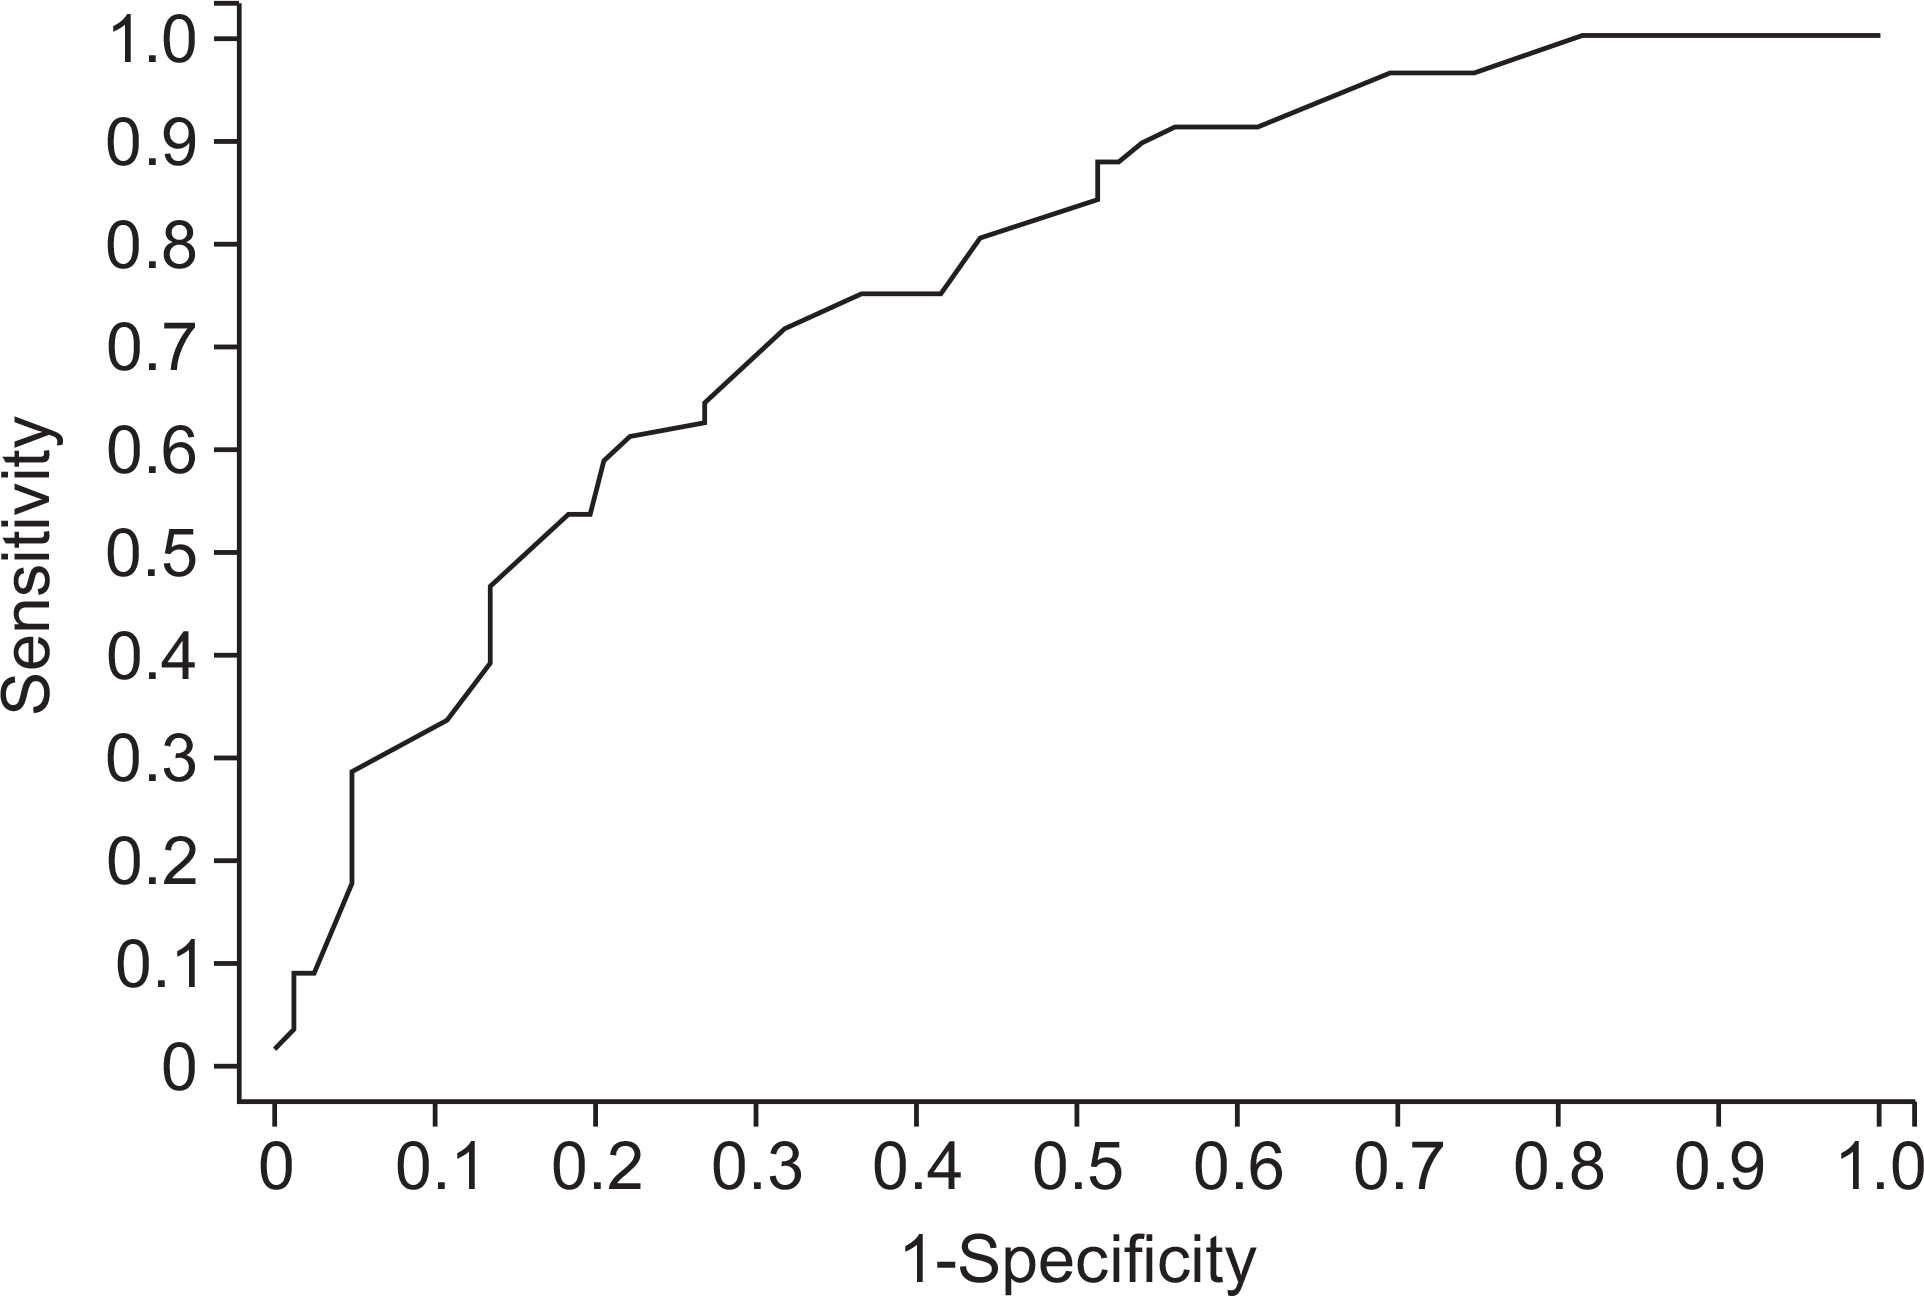
The sensitivity, specificity, and AUC including all questions were 0.571, 0.768, and 0.781, respectively; the sum of sensitivity and specificity was 1.34. To gain robustness, a simplified predictive model was built with six questions. Its results were 0.536, 0.817, and 0.762 for sensitivity, specificity, and AUC, respectively. The sum of sensitivity and specificity was found to be 1.35.

Conclusions

The self-reported questionnaire for periodontitis showed considerable validity, but further study is required to provide optimal validity and predictability.

References

1. Albandar JM, Rams TE. Global epidemiology of periodontal dis-eases: an overview. Periodontol 2000. 2002; 29:7–10.
crossref
2. Pihlstrom BL, Michalowicz BS, Johnson NW. Periodontal diseases. Lancet. 2005; 366:1809–1820.
crossref
3. Seymour GJ, Ford PJ, Cullinan MP, Leishman S, Yamazaki K. Relationship between periodontal infections and systemic disease. Clin Microbiol Infect. 2007; 13:3–10.
crossref
4. Health Insurance Review and Assessment Service, Nation Helath Insurance Corporation. 2010 National Health Insurance Statistical Yearbook. Seoul: Health Insurance Review & Assessment Service, Nation Health Insurance Corporation;2011. p. 556.
5. Ministry of Health and Welfare. 2011 Korea Health Statistics: Korea National Health and Nutrition Examination Survey (KNHANES V-2). Seoul: Ministry of Health & Welfare;2012. p. 15.
6. Eke PI, Dye BA, Wei L, Slade GD, Thornton-Evans GO, Beck JD, et al. Self-reported measures for surveillance of periodontitis. J Dent Res. 2013; 92:1041–1047.
crossref
7. WHO. Oral health surveys: basic methods. 4th ed.Geneva: World Health Organization;2000. p. 27–37.
8. Centers for Disease Control and Prevention. [Internet]. [cited 2014 Aug 20]. Available at:. http://www.cdc.gov/brfss/.
9. Vartiainen E, Seppälä T, Lillsunde P, Puska P. Validation of self reported smoking by serum cotinine measurement in a community-based study. J Epidemiol Community Health. 2002; 56:167–170.
crossref
10. Okura Y, Urban LH, Mahoney DW, Jacobsen SJ, Rodeheffer RJ. Agreement between self-report questionnaires and medical record data was substantial for diabetes, hypertension, myocardial infarction and stroke but not for heart failure. J Clin Epidemiol. 2004; 57:1096–1103.
crossref
11. Eke PI, Genco RJ. CDC Periodontal Disease Surveillance Project: background, objectives, and progress report. J Periodontol. 2007; 78:1366–1371.
crossref
12. Slade GD. Interim analysis of validity of periodontitis screening questions in the Australian population. J Periodontol. 2007; 78:1463–1470.
crossref
13. Yamamoto T, Koyama R, Tamaki N, Maruyama T, Tomofuji T, Ekuni D, et al. Validity of a questionnaire for periodontitis screening of Japanese employees. J Occup Health. 2009; 51:137–143.
crossref
14. Jin HJ, Bae GH, Kim JB, Park DY, Jeong SH, Kim BI, et al. Validity and reliability of a questionnaire for evaluating periodontal disease. J of Korean Acad of Oral Health. 2014; 38:170–175.
crossref
15. WHO. Basic methods. Seoul: Komoonsa;2000. p. 27–37.
16. Ministry of Health and Welfare. 2000 Korean National Oral Health Survey. Summary. Seoul: Ministry of Health and Welfare;2001. p. 34.
17. Blicher B, Joshipura K, Eke P. Validation of self-reported periodontal disease: a systematic review. J Dent Res. 2005; 84:881–890.
crossref

Fig. 1.
ROC curve for model I.
jkaoh-39-63f1.tif
Fig. 2.
ROC curve for model II.
jkaoh-39-63f2.tif
Table 1.
Distribution of the study population by self-reported (response reclassification)
Question N Periodontitis Categories P-value Sensitivity Specificity Odds ratio 95% Confidence Interval
CPI<3 CPI=3
1. Do you think that you have gum diseases?
Yes 54 24 (28.9) 30 (53.6) 0.003 0.536 0.711 2.837 1.398, 5.757
No 85 59 (71.1) 26 (46.4) Ref.
2. When you think about your oral heath, what do you think about your oral condition such as teeth and gums?
≤Average 116 68 (81.9) 48 (85.7) 0.556 0.857 0.181 1.324 0.520, 3.369
Good 23 15 (18.1) 8 (14.3) Ref.
3. Have you ever experienced any treatment for gum disease, such as the teeth cleaning in the clinic?
No 36 24 (29.3) 12 (21.4) 0.303 0.214 0.707 0.659 0.297, 1.461
Yes 102 58 (70.7) 44 (78.6) Ref.
4. Have you ever had periodontal treatment or surgery with anesthesia (including deep cleaning)?
Yes 75 38 (45.8) 37 (66.1) 0.019 0.661 0.542 2.306 1.143, 4.652
No 64 45 (54.2) 19 (33.9) Ref.
5. Have you ever had any teeth become loose on their own, without an injury?
Yes 41 18 (21.7) 23 (27.7) 0.014 0.411 0.783 2.517 1.194, 5.305
No 98 65 (78.3) 33 (72.3) Ref.
6. Have you ever been told by a dental professional that you lost bone around your teeth?
Yes 17 7 (8.4) 10 (17.9) 0.096 0.176 0.961 2.360 0.840, 6.631
No 122 76 (91.6) 46 (82.1) Ref.
7. Have you ever had bleeding around the gums when you brush your teeth?
Yes 88 55 (62.5) 33 (58.9) 0.328 0.589 0.329 0.704 0.348, 1.424)
No 50 27 (37.5) 23 (41.1) Ref.
8. Have you ever had painful gums when you chew solid food (carrots or peanuts)?
Yes 51 29 (34.9) 22 (39.3) 0.602 0.393 0.651 1.205 0.598, 2.428
No 88 54 (65.1) 34 (61.7) Ref.
9. Do you use dental floss to clean between your teeth?
No 96 50 (60.2) 46 (82.1) 0.008 0.821 0.390 2.944 1.303, 6.652
Yes 42 32 (39.8) 10 (17.9) Ref.
10. Do you use interdental brush to clean between your teeth?
No 105 64 (77.1) 41 (73.2) 0.600 0.732 0.229 0.811 0.371, 1.774
Yes 34 19 (22.9) 15 (26.8) Ref.
11. Do you use dental rinse products to clean your mouth (gargle, listerine)?
No 104 64 (77.1) 40 (71.4) 0.449 0.714 0.229 0.742 0.342, 1.609
Yes 35 19 (22.9) 16 (28.6) Ref.
12. Have you ever smoked in our life?
Yes 45 20 (24.1) 25 (44.6) 0.011 0.446 0.759 2.540 1.226, 5.263
No 94 63 (75.9) 31 (55.4) Ref.
13. Have you drank alcohol in the last year?
Yes 90 56 (67.5) 34 (60.7) 0.414 0.607 0.325 0.745 0.368, 1.510
No 49 27 (32.5) 22 (39.3) Ref.
Table 2.
Logistic regression model (model I) to predict periodontitis
Question Beta Standard error P-value Odds ratio 95% Confidence interval
1. Do you think that you have gum diseases?
No vs. Yes 1.163 0.485 0.016 3.199 1.237, 8.273
9. Do you use dental floss to clean between your teeth?
Yes vs. No 1.620 0.518 0.002 5.054 1.830, 13.957
12. Have you ever smoked in our life?
No vs. Yes 1.101 0.472 0.020 3.007 1.192, 7.588
5. Have you ever had any teeth become loose on their own, without an injury?
No vs. Yes 0.186 0.521 0.721 1.205 1.434, 3.343
4. Have you ever had periodontal treatment or surgery with anesthesia (including deep cleaning)?
No vs. Yes 0.936 0.452 0.038 2.550 1.051, 6.188
6. Have you ever been told by a dental professional that you lost bone around your teeth?
No vs. Yes 0.493 0.673 0.464 1.637 0.437, 6.124
3. Have you ever experienced any treatment for gum disease, such as the teeth cleaning in the clinic?
Yes vs. No ―0.386 0.516 0.455 0.680 0.247, 1.87)
7. Have you ever had bleeding around the gums when you brush your teeth?
No vs. Yes ―0.680 0.454 0.134 0.507 0.208, 1.232
13. Have you drank alcohol in the last year?
No vs. Yes 0.927 0.470 0.049 0.396 0.158, 0.994
11. Do you use dental rinse products to clean your mouth (gargle, listerine)?
Yes vs. No ―0.355 0.495 0.473 0.701 0.266, 1.850
2. When you think about your oral heath, what do you think about your oral condition such as teeth and gums?
Good vs. =Average 0.138 0.581 0.813 1.147 0.367, 3.587
10. Do you use interdental brush to clean between your teeth?
Yes vs. No 0.528 0.521 0.311 0.590 0.212, 1.638
8. Have you ever had painful gums when you chew solid food (carrots or peanuts)?
Yes vs. No ―0.847 0.503 0.092 0.429 0.160, 1.149

Sensitivity=0.571, Specificity=0.768, Sensitivity+Specificity=1.339, AUC=0.781.

Table 3.
Logistic regression model (model II) to predict periodontitis
B SE P-value Odds ratio 95% CI
1. Do you think that you have gum diseases?
No vs. Yes 1.214 0.438 0.006 3.367 1.427, 7.948
9. Do you use dental floss to clean between your teeth?
Yes vs. No 1.348 0.471 0.004 3.851 1.529, 9.703
12. Have you ever smoked in our life?
No vs. Yes 0.986 0.435 0.024 2.679 1.142, 6.287
4. Have you ever had periodontal treatment or surgery with anesthesia?
No vs. Yes 1.146 0.424 0.007 3.145 1.369, 7.224
13. Have you drank alcohol in the last year?
No vs. Yes ―0.919 0.434 0.034 0.399 0.170, 0.934
8. Have you ever had painful gums when you chew solid food (carrots or peanuts)?
Yes vs. No ―0.859 0.469 0.067 0.423 0.169, 1.063

Sensitivity=0.536, Specificity=0.817, Sensitivity+Specificity=1.353, AUC=0.762.

TOOLS
Similar articles