Abstract
Objectives
The aim of this 7-year study was to examine regional differences in scaling experience rate.
Methods
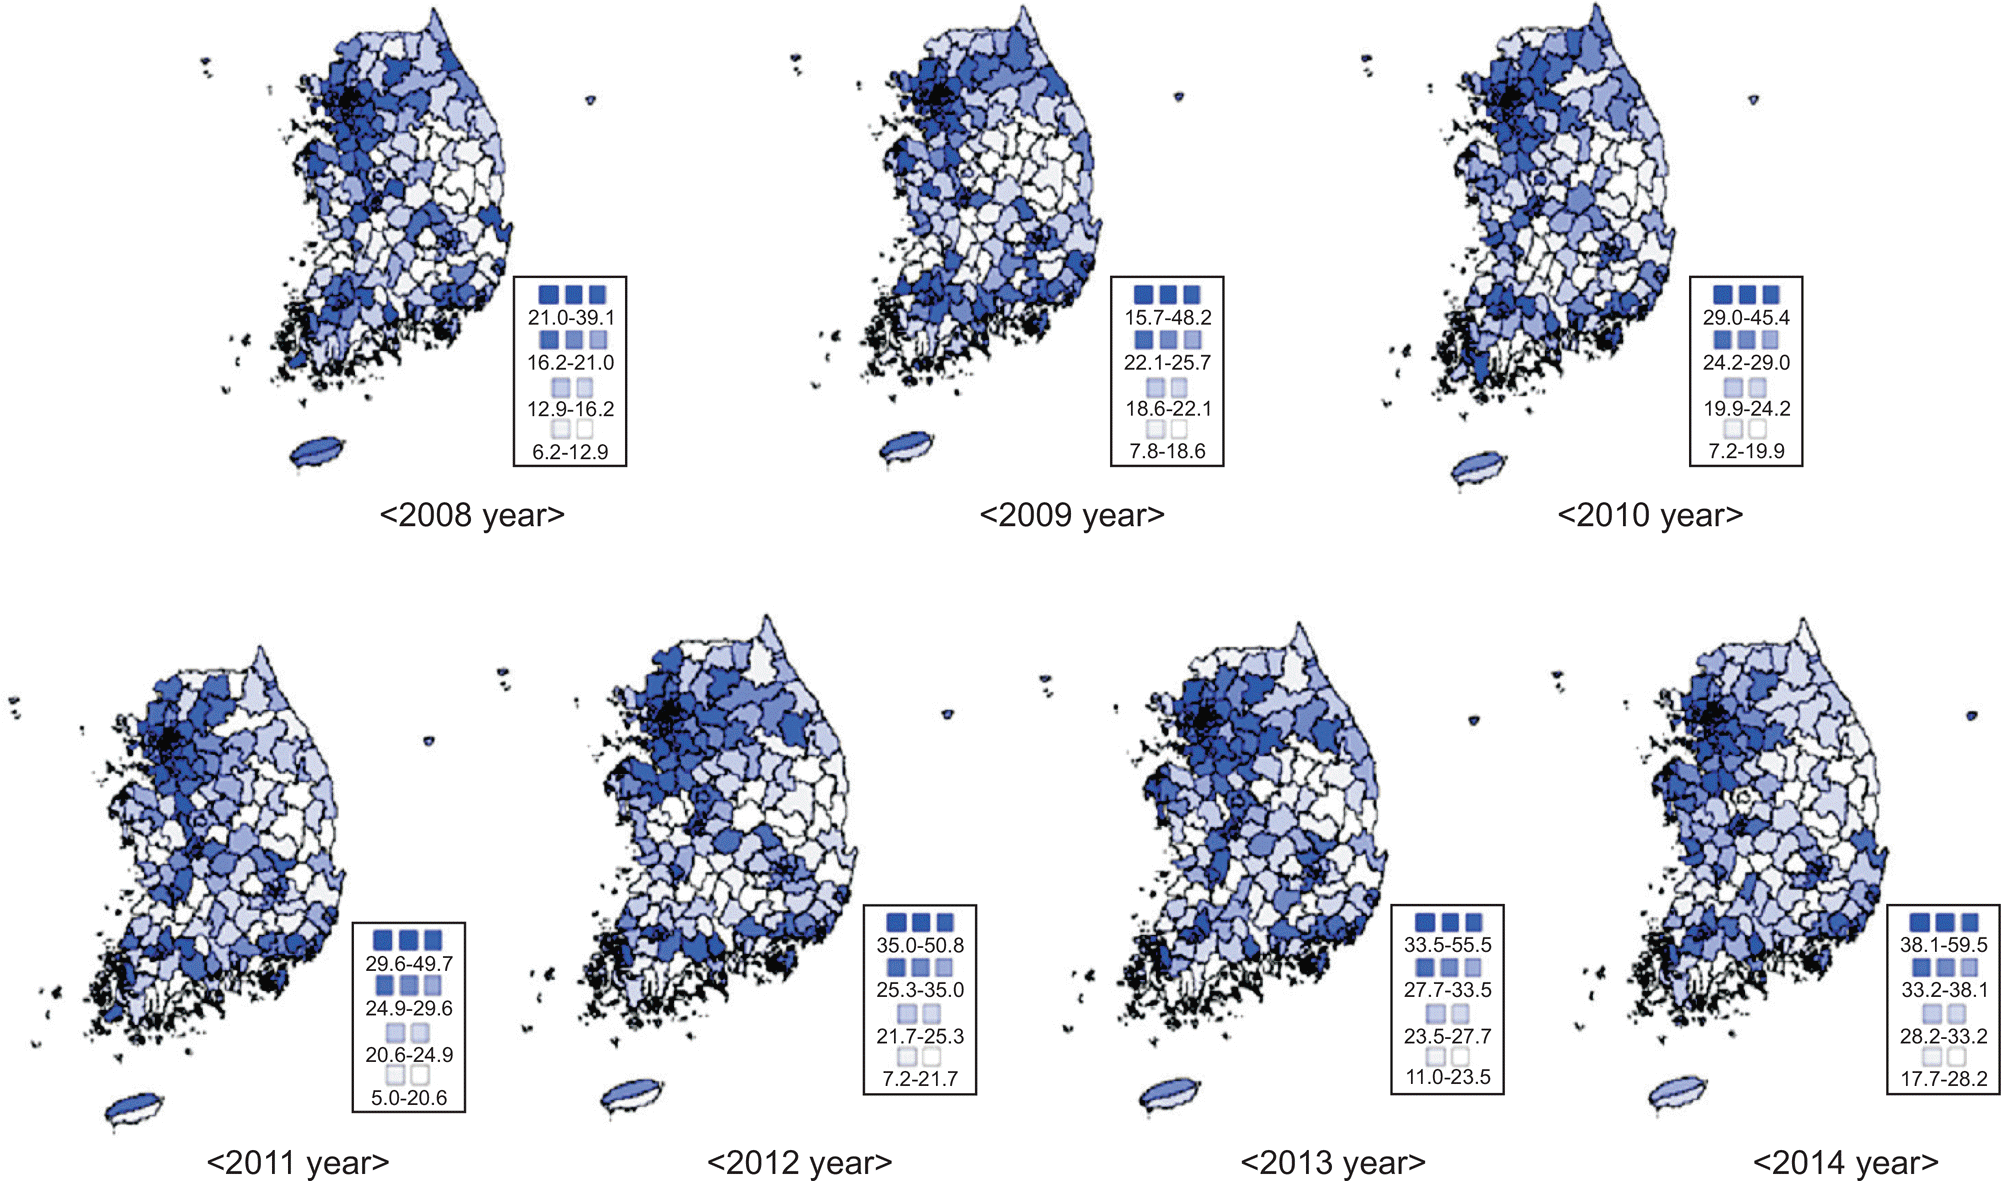
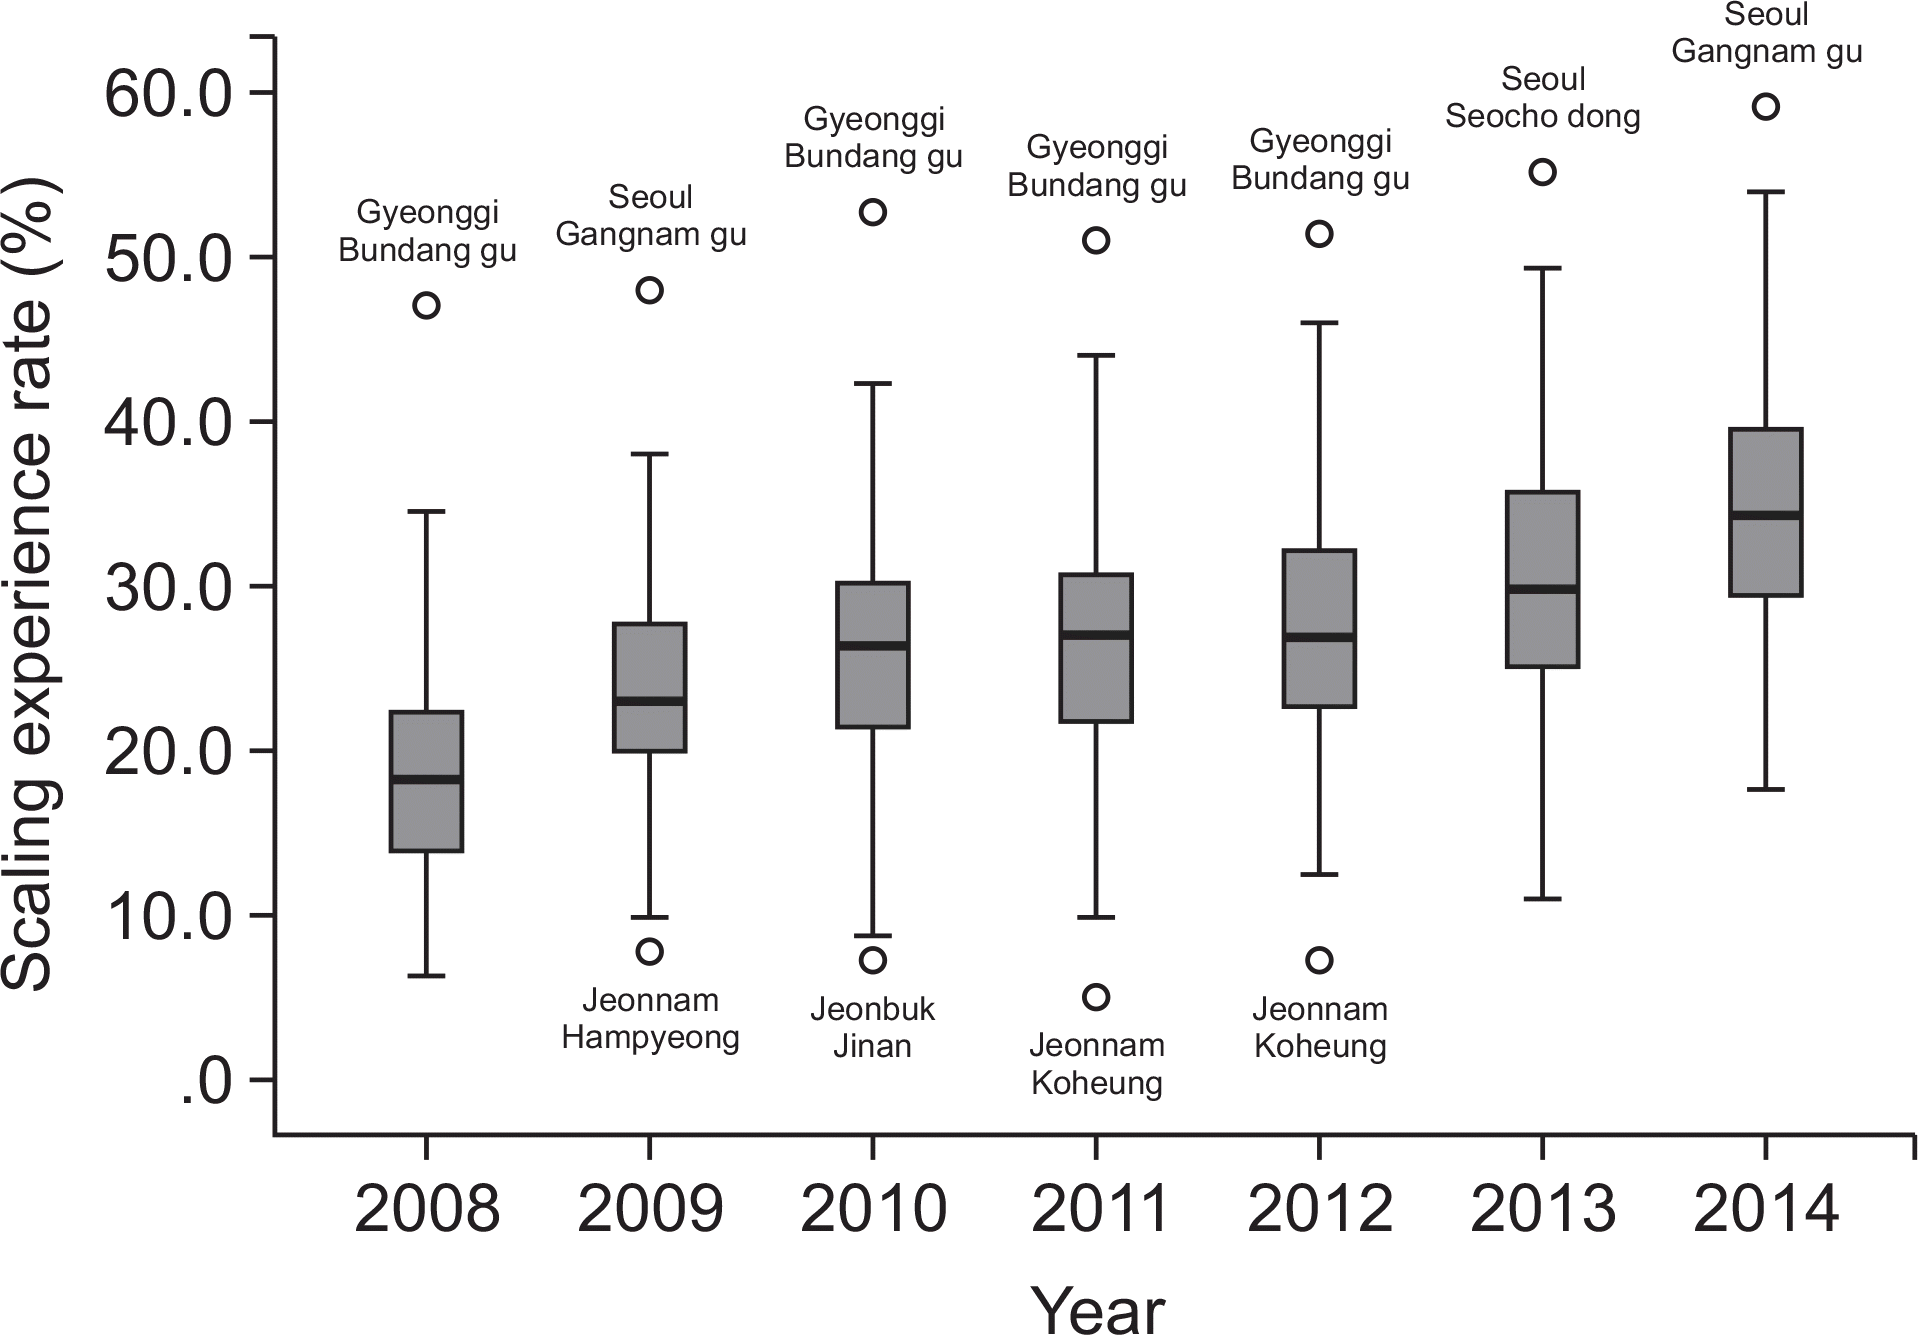
This study used data on scaling experience rate from the Community Health Survey (CHS) obtained between 2008 and 2014. The standardized frequency of scaling experience rate was analyzed using the SPSS 20.0 program, and shown as a Box Plot. Using the Map Wizard for Excel 10.0, the scaling experience rate in each region was illustrated using Geographic Information System (GIS).
Results
The scaling experience rate in 2008 was 18.6% and in 2014, was 34.9%. From 2008 to 2014, the annual rate of scaling experience increased approximately 1.8 times. The scaling experience appeared to form clustering on GIS, and there were differences in scaling experience rate between cities, towns, and districts. Although the scaling experience rate increased, the gap between regions seems consistent.
Go to : 
References
1. Korea national health and nutrition examination survey. Korea national health and nutrition examination survey, raw data download, [Internet]. Korea Centers for Disease Control and Prevention. [2015 Aug 09].https://knhanes.cdc.go.kr/knhanes/index.do.
2. National health insurance statistical yearbook. National Health Insurance Corporation [Internet]. National health insurance corporation, health insurance review & assessment service;[2015 Aug 09]. http://www.nhis.or.kr/wbdy/retriveWbdy01.xx, http:// www.nhis.or.kr/bbs7/boards/B0075/5943, http://www.nhis.or.kr/bbs7/boards/B0075/5944, http://www.nhis.or.kr/bbs7/boards/B0075/5947, http://www.nhis.or.kr/bbs7/boards/B0075/5949,http://www.nhis.or.kr/bbs7/boards/B0039/2822.
3. Ha JE, Bae KH. Reasons for extraction of permanent teeth in korea. J Korea Acad Oral Health. 2012; 36:32–37.
5. Noh HJ. Cost-benefit analysis of periodontal disease prevention-focusing preventive scaling[Master’s thesis]. Seoul: Kyung Hee Uni-versity;2002. [Korean].
6. Community Health Survey. Community Health Survey, raw data download [Internet]. The ministry of health & welfare, korea centers for disease control and prevention. [2015 Jul 13].https://chs.cdc.go.kr/chs/index.do.
7. Lee HH. A study on structures of the koreans’ health inequality: focused on effects of socioeconomic status [Doctoral dissertation]. Sejong: Korea University;2014. [Korean].
8. Lee YJ. Regional analysis of the equity and causes in utilization of the national health insurance[Doctoral dissertation]. Seoul: Chung Ang University;2006. [Korean].
9. Han JH. A study on priority-setting in expanding the dental health insurance coverage[Doctoral dissertation]. Seoul: Han Yang Univer-sity;2007. [Korean].
10. Lee YJ. An study on the inequality of health care resources distribution affected by regional characteristics. Journal of Critical Social Welfare. 2005; 21:49–78.
11. Kim HY. Community inequalities in health: The contextual effect of social capital. The Korean J Social. 2009; 12:1111–1130.
12. Lee HJ, Bae KH. A change in the regional disparity based on the national insurance coverage of dental sealant in korea. J Korea Acad Oral Health. 2014; 38:165–169.

13. Kim NH, Jeon JE, Chung WG, Kim DK. Social determinants related to the regional difference of unmet dental need in korea. 2014. J Korea Acad Oral Health. 2012; 36:62–72.
14. Hah MY. A study on the changes in consumers’ awareness and the rate of scaling in each region after its coverage by the national health insurance scheme[Master’s thesis]. Gyeonggi: Dan Kook Uni-versity;2014. [Korean].
15. Korea institute for health and social affairs. Korea institute for health and social affairs(KINSHASA). published materials, health-welfare policy forum [Internet]. [2015 Aug 09].https://www.kihasa.re.kr/html/jsp/publication/periodical/forum/list.jsp?aid=262.
Go to : 
Table 1.
Distribution of scaling experience rate by region and year (Unit: %)
| Mean±SE* | 2008 yr | 2009 yr | 2010 yr | 2011 yr | 2012 yr | 2013 yr | 2014 yr |
|---|---|---|---|---|---|---|---|
| Total | 18.9±.42† | 23.0±.42† | 26.2±.45† | 26.9±.47† | 27.6±.45† | 30.6±.48† | 34.7±.48† |
| City | 18.7±.64 | 28.2±.59 | 26.2±.73 | 26.5±.70 | 27.8±.72 | 30.1±.73 | 34.5±.74 |
| Town | 22.2±.47 | 19.4±.56 | 30.5±.65 | 31.9±.66 | 32.7±.61 | 35.8±.72 | 40.3±.71 |
| District | 14.3±.68 | 36.9±.67 | 21.3±.68 | 22.0±71 | 22.1±.65 | 24.9±.68 | 28.9±.68 |
Table 2.
Quartile range of scaling experience rate by region and year (Unit: %
Table 3.
Difference of scaling experience rate by region and year (Unit: %)
| Year | Lowest rate region | Mean±SE* | Highest rate region | Mean±SE* | Difference rate† |
|---|---|---|---|---|---|
| 2008 yr | Kyeongnam Namhae | 6.2±.426 | Gyeonggi Bundang gu | 47.2±.426 | 41.0 |
| 2009 yr | Jeonnam Hampyeong | 7.8±.426 | Seoul Gangnam gu | 48.2±.426 | 40.4 |
| 2010 yr | Jeonbuk Jinan | 7.2±.455 | Gyeonggi Bundang gu | 53.0±.455 | 45.8 |
| 2011 yr | Jeonnam Koheung | 5.0±.474 | Gyeonggi Bundang gu | 51.3±.474 | 46.3 |
| 2012 yr | Jeonnam Koheung | 7.2±.454 | Gyeonggi Bundang gu | 51.3±.454 | 44.1 |
| 2013 yr | Jeonnam Koheung | 11.0±.480 | Seoul Seocho dong | 55.5±.480 | 44.5 |
| 2014 yr | Kyeongbuk Yeongyang | 17.7±.483 | Seoul Gangnam gu | 59.5±.483 | 41.8 |


 PDF
PDF ePub
ePub Citation
 Print
Print


 XML Download