Abstract
Objectives
This study aimed to evaluate the effect of oral health education interval and toothbrushing instruction, the difference between the demonstration-only method and the demonstration with chairside practice toothbrushing instruction method, and the effect of initial patient plaque control ability on the plaque index.
Methods
Patients (n=60) were randomly assigned to receive a 1-week, 2-week, or 3-week interval of oral health education and toothbrushing instruction. Each group was further subdivided into the demonstration-only group and the demonstration with chairside practice group. Patients were categorized as having “good”, “fair”, or “poor” initial plaque control ability, based on the Turesky modification of the Quigley-Hein plaque index (TQHI). Patients attended five sessions during which they received oral health education and toothbrushing instruction of the modified Bass technique. Plaque evaluation was performed at each visit using the TQHI.
Results
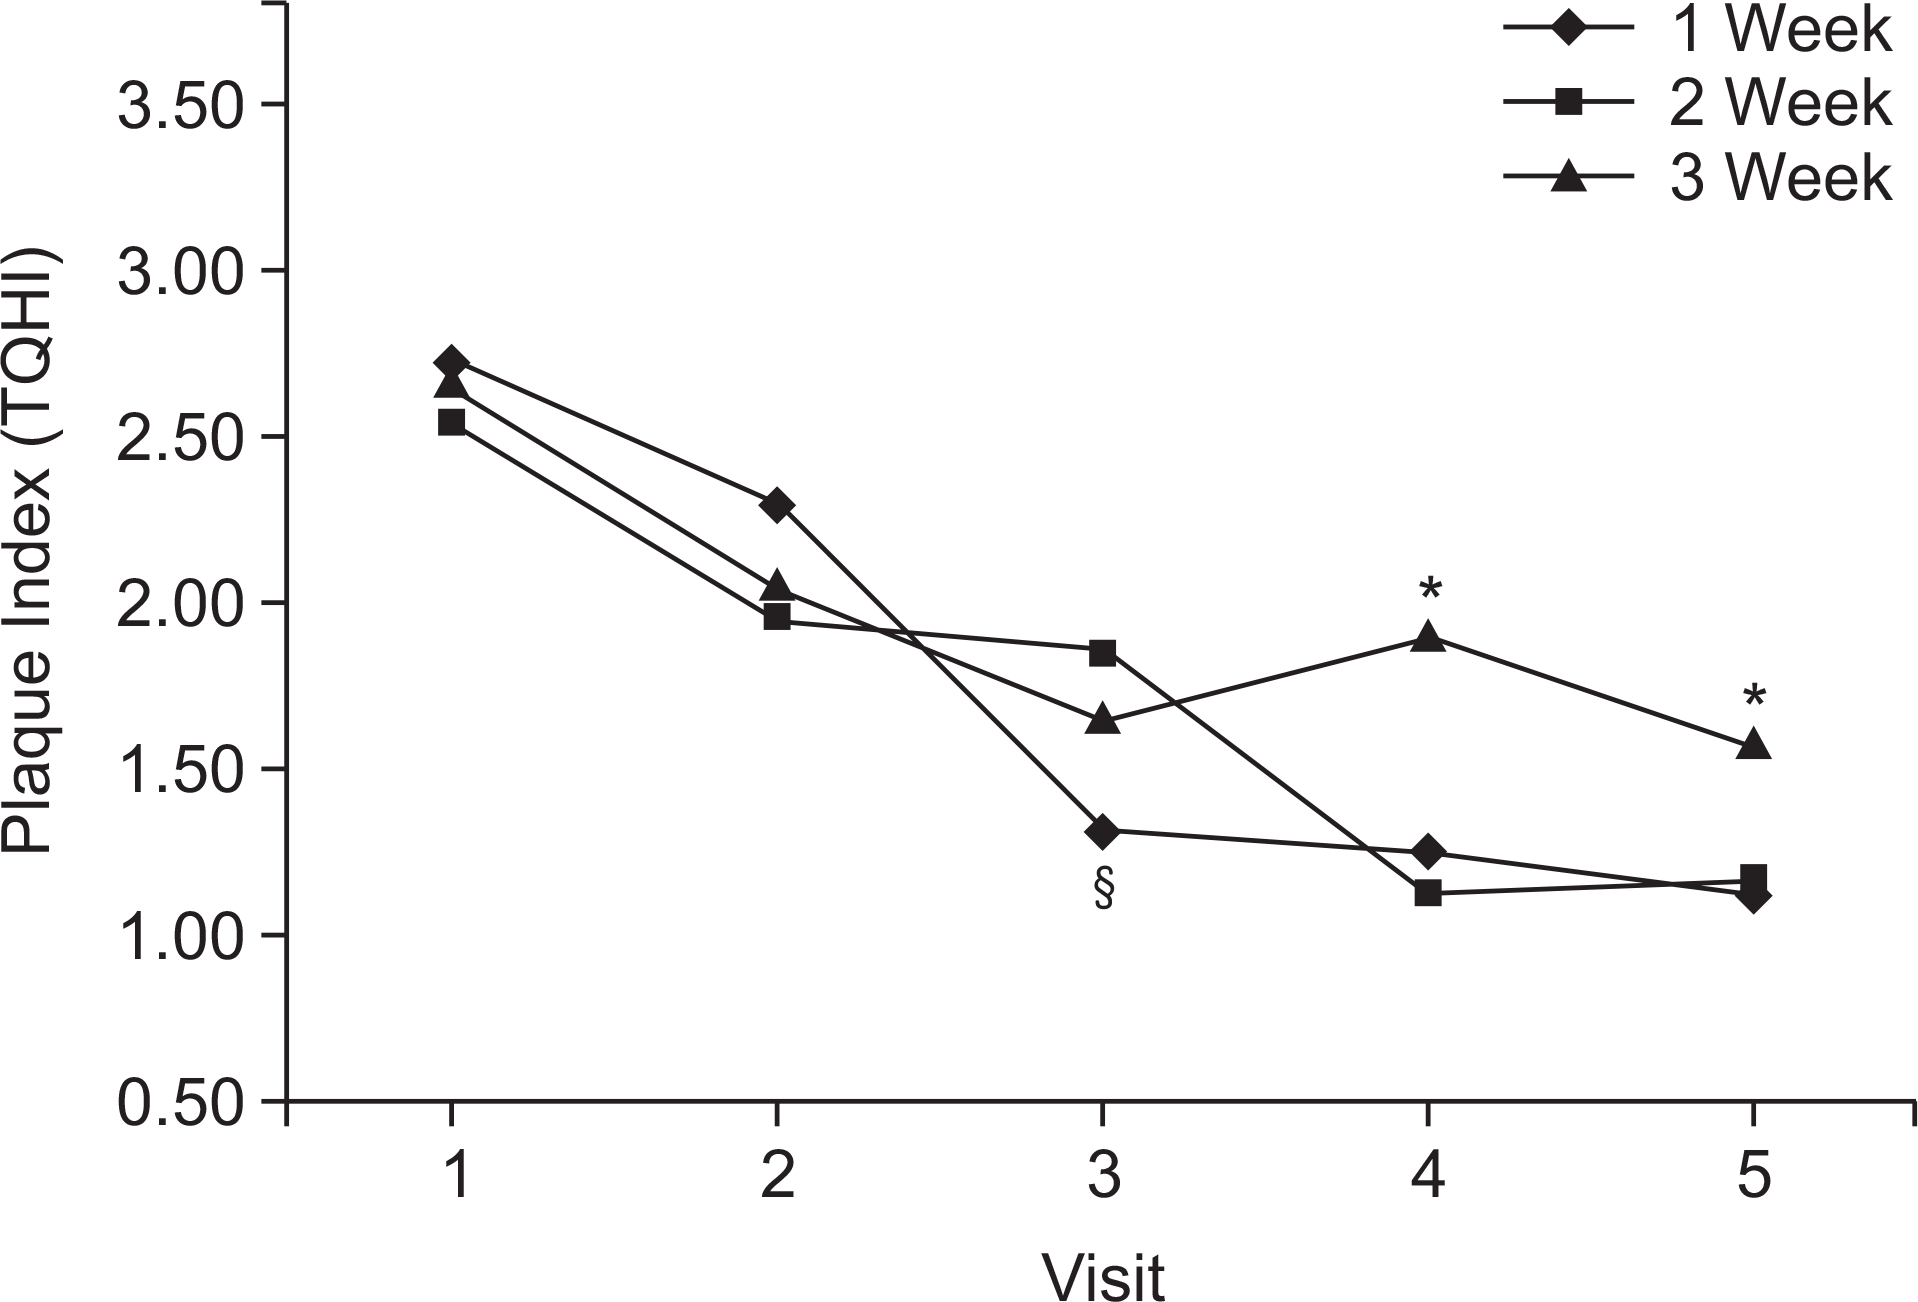
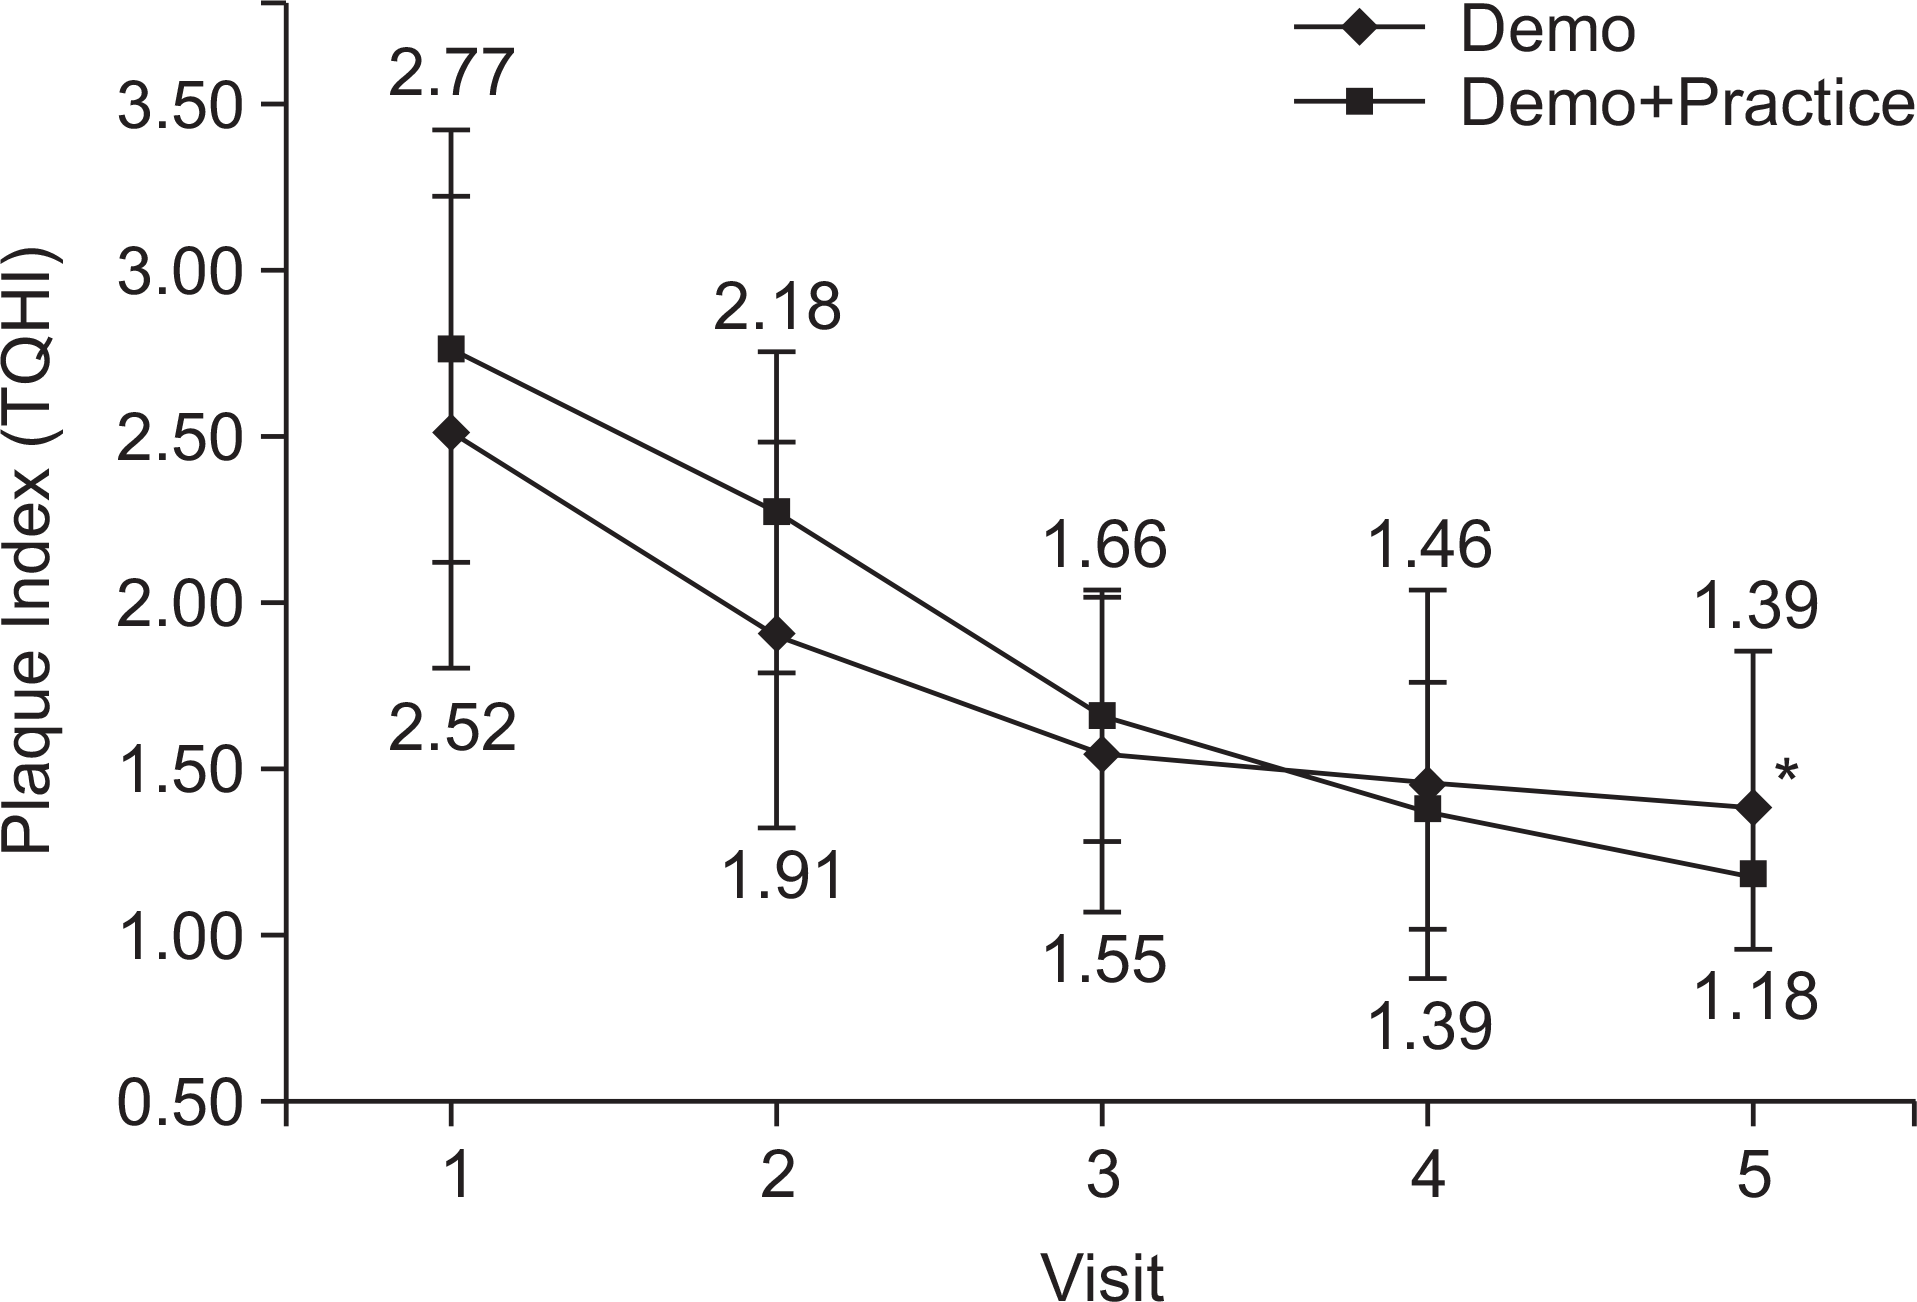
The plaque index tended to improve from the first visit to the fifth visit, but there were no significant differences between the 1-week, 2-week, and 3-week education interval. The demonstration with the chairside practice group showed significantly greater improvements in the plaque index, compared to the demonstration-only group. In the good, fair, and poor plaque control ability groups, the plaque index improved gradually from the first to the fifth visit. When plaque control was poor, the improvement in the plaque index increased to a greater degree after oral health education and toothbrushing instruction.
Go to : 
References
2. Knowles JW, Burgett FG, Nissle RR, Shick RA, Morrison EC, Ram-fjord SP. Results of periodontal treatment related to pocket depth and attachment level. Eight years. J Periodontol. 1979; 50(5):225–233.

3. Lindhe J, Nyman S. The effect of plaque control and surgical pocket elimination on the establishment and maintenance of periodontal health. A longitudinal study of periodontal therapy in cases of advanced disease. J Clin Periodontol. 1975; 2(2):67–79.

4. Suomi JD, Greene JC, Vermillion JR, Doyle J, Chang JJ, Leatherwood EC. The effect of controlled oral hygiene procedures on the progression of periodontal disease in adults: results after third and final year. J Periodontol. 1971; 42(3):152–160.

5. Axelsson P, Lindhe J. Effect of controlled oral hygiene procedures on caries and periodontal disease in adults. J Clin Periodontol. 1978; 5(2):133–151.

6. Sangnes G. Effectiveness of vertical and horizontal toothbrushing techniques in the removal of plaque. II. Comparison of brushing by six-year-old children and their parents. J Dent Child. 1974; 41(2):119–123.
7. Kremers L, Lampert F, Etzold C. Comparative clinical studies on 2 toothbrushing methods-Roll and Bass technic. Dtsch Zahnarztl Z. 1978; 33(1):58–60.
8. Poyato-Ferrera M, Segura-Egea JJ, Bullón-Fernández P. Comparison of modified Bass technique with normal toothbrushing practices for efficacy in supragingival plaque removal. Int J Dent Hyg. 2003; 1(2):110–114.

9. Bergenholtz A, Gustafsson LB, Segerlund N, Hagberg C, Ostby N. Role of brushing technique and toothbrush design in plaque removal. Scand J Dent Res. 1984; 92(4):344–351.

10. Jang KW, Hwang YS, Kim JB, Song YS, Baek DI, Choi BK, et al. Oral Health Education. 4th ed.Seoul: Komoonsa;2007. p. 17–53.
11. Calley KH, Rogo E, Miller DL, Hess G, Eisenhauer L. A proposed client self-care commitment model. J Dent Hyg. 2000; 74(1):24–35.
12. Jönsson B, Ohrn K, Oscarson N, Lindberg P. The effectiveness of an individually tailored oral health educational programme on oral hygiene behaviour in patients with periodontal disease: a blinded randomized-controlled clinical trial (one-year follow-up). J Clin Periodontol. 2009; 36(12):1025–1034.

13. Arunakul M, Kuphasuk Y, Boonyathanasit R. Effectiveness of oral hygiene instruction media on periodontal health among hearing impaired children. J Trop Med Public Health. 2012; 43(5):1297–1303.
14. Turesky S, Gilmore ND, Glickman I. Reduced plaque formation by the chloromethyl analogue of victamine C. J Periodontol. 1970; 41(1):41–43.

15. Gibson JA, Wade AB. Plaque removal by the Bass and Roll brushing techniques. J Periodontol. 1977; 48(8):456–459.

16. Robinson E. A comparative evaluation of the Scrub and Bass Methods of toothbrushing with flossing as an adjunct (in fifth and sixth graders). Am J Public Health. 1976; 66(11):1078–1081.

17. Addy M, Griffiths G, Dummer P, Kingdom A, Shaw WC. The distribution of plaque and gingivitis and the influence of toothbrushing hand in a group of South Wales 11-12 year-old children. J Clin Periodontol. 1987; 14(10):564–572.

18. Alexander AG. A study of the distribution of supra and subgingival calculus, bacterial plaque and gingival inflammation in the mouths of 400 individuals. J Periodontol. 1971; 42(1):21–28.

19. Quirynen M, Dekeyser C, van Steenberghe D. Discriminating power of five plaque indices. J Periodontol. 1991; 62(2):100–105.

20. Cugini M, Thompson M, Warren PR. Correlations between two plaque indices in assessment of toothbrush effectiveness. J Contemp Dent Pract. 2006; 7(5):1–9.

21. Jo BD, Kim DK, Lee BJ. Change in plaque control ability by the professional oral health care program. J Korean Acad Oral Health. 2015; 39(1):25–36.

22. Schlueter N, Klimek J, Ganss C. Relationship between plaque score and video-monitored brushing performance after repeated instruction-a controlled, randomised clinical trial. Clin Oral Investig. 2013; 17(2):659–667.

23. Ashkenazi M, Bidoosi M, Levin L. Factors associated with reduced compliance of children to dental preventive measures. Odontology. 2012; 100(2):241–248.

24. Ower P. The role of self-administered plaque control in the management of periodontal diseases: 2. Motivation, techniques and assessment. 2003; 30(3):110–116.
25. Acharya S, Goyal A, Utreja AK, Mohanty U. Effect of three different motivational techniques on oral hygiene and gingival health of patients undergoing multibracketed orthodontics. Angle Orthod. 2011; 81(5):884–888.

26. Renton-Harper P, Addy M, Warren P, Newcombe RG. Comparison of video and written instructions for plaque removal by an oscil-lating/rotating/reciprocating electric toothbrush. J Clin Periodontol. 1999; 26(11):752–756.

27. Addy M, Renton-Harper P, Warren P, Newcombe RG. An evaluation of video instruction for an electric toothbrush. Comparative single-brushing cross-over study. J Clin Periodontol. 1999; 26(5):289–293.
28. Hodges NJ, Franks IM. Modelling coaching practice: the role of instruction and demonstration. J Sports Sci. 2002; 20(10):793–811.

29. Zaki HA, Bandt CL. Model presentation and reinforcement-an effective method for teaching oral hygiene skills. J Periodontol. 1970; 41(7):394–397.

30. Ashkenazi M, Kessler-Baruch O, Levin L. Oral hygiene instructions provided by dental hygienists: results from a self-report cohort study and a suggested protocol for oral hygiene education. Quintessence Int. 2014; 45(3):265–269.
Go to : 
 | Fig. 1.Mean plaque index of 1-week, 2-week, and 3-week education interval groups at the first, second, third, fourth and fifth visits. §Indicates a statistically significant difference between the 1-week interval and the 2-week interval or 3-week interval, as measured by one-way analysis of variance (ANOVA) (P<0.05). *Indicates a statistically significant difference between the 1-week or 2-week interval and the 3-week interval, as measured by one-way ANOVA (P<0.05). TQHI, Turesky modification of the Quigley-Hein Plaque Index. |
 | Fig. 2.The change in the mean plaque index at the first, second, third, fourth, and fifth visits in the demonstration-only group (n=30) and the demonstration with chairside practice group (n=30). *Indicates a statistically significant difference between groups, as measured by the t test (P<0.05). TQHI, Turesky modification of the Quigley-Hein Plaque Index. |
Table 1.
Sex ratio, mean age, and initial plaque control ability of the 1-week, 2-week, and 3-week education interval groups
| Education interval | Sex | Mean Age (y) | Initial Plaque Control Ability | Total | |||
|---|---|---|---|---|---|---|---|
| M | F | Good | Fair | Poor | |||
| 1 week | 6 | 14 | 49.4 | 0 | 16 | 4 | 20 |
| 2 week | 7 | 13 | 50 | 1 | 16 | 3 | 20 |
| 3 week | 5 | 15 | 51.4 | 2 | 15 | 3 | 20 |
| Total | 18 | 42 | 50.2 | 3 | 47 | 10 | 60 |
Table 2.
The number of patients in the subgroups divided by education interval and education method
| Education interval | Education Method | Total | |
|---|---|---|---|
| Demonstration | Demonstration with Chairside Practice | ||
| 1 week | 10 | 10 | 20 |
| 2 week | 10 | 10 | 20 |
| 3 week | 10 | 10 | 20 |
| Total | 30 | 30 | 60 |
Table 3.
Changes in the mean plaque index at the first, second, third, fourth, and fifth visits during the 1-week, 2-week, and 3-week education interval
Table 4.
Changes in mean plaque index at the first, second, third, fourth, and fifth visits, according to initial plaque control ability
| Visit | Changes in the Mean Plaque Index (1st-5th visit) | ||||||
|---|---|---|---|---|---|---|---|
| 1st | 2nd | 3rd | 4th | 5th | |||
| Plaque control ability | Good (n=3) | 1.40 (0.26) | 1.37 (0.33) | 1.07 (0.54)* | 0.87 (0.28)* | 0.85 (0.28)* | 0.55 |
| Fair (n=47) | 2.53 (0.48) | 2.07 (0.47)§ | 1.62 (0.42)§ | 1.41 (0.49)§ | 1.29 (0.39)§ | 1.24 | |
| Poor (n=10) | 3.62 (0.24) | 2.45 (0.72)* | 1.72 (0.29)* | 1.66 (0.42)* | 1.39 (0.25)* | 2.23 | |


 PDF
PDF ePub
ePub Citation
 Print
Print


 XML Download