Abstract
Methods
This study performed an analysis by combining outpatient use data, household data, and additional survey data in 2011 from the Korea Health Panel Annual Data from 2008 to 2011. Standardization was conducted on variables of supplier-related factors, and a four-point scale survey questionnaire was converted into a triangle fuzzy number to fuzzify the data. A two-part model was applied to the fuzzified values. In the first part, a study was conducted to determine which supplier factors affected the decision to visit dental outpatient facilities. In the second part, dental outpatient facilities use was analyzed based on the supplier factors.
Results
The study results showed that ages, marital status, education level, position of employment, and income level affected the decision to visit dental outpatient facilities. Furthermore, gender and age affected the usage of dental outpatient facilities. In conclusion, supplier factors affected the decision to visit dental outpatient facilities and usage significantly. Among the supplier factors, dentist recommendation was a significant factor.
Go to : 
References
1. Park JK. A study on the choice factors of doctor’s office dental clinic and oriental medical clinic. Business Administration Graduate School of Kyung Hee University;2005.
2. Peters DH, Garg A, Bloom G, Walker DG, Brieger WR, Rahman MH. Poverty and access to health care in developing countries. Annals of the New York Academy of Sciences. 2007; 1136:161–171.

3. Kang HJ, Yoon SJ, H SL, Koh SG, Seo HY. Policy Issues for Measuring the Quality of Health Care across Korea : Designing a National Healthcare Quality Report (I). Korea Institute for Health and Social Affairs policy report 2013.
4. Song BN, Song KS, Jang SH. Health promotion lifestyle to the selection factors of dental institutions among some office workers. Journal of Korean society of Dental Hygiene. 2012; 12:179–187.

5. Evans J, Lindsay W. Managing for quality and performance excellence. South-western cengage learning;Mason, OH: 2009. p. 128–133.
6. Perneger TV. Adjustment for patient characteristics in satisfaction surveys. Int J Qual Health Care. 2004; 16:433–435.

7. Sofaer S, Firminger K. Patient perceptions of the quality of health services. Annu Rev Public Health. 2005; 26:513–559.

8. Kim YK, Jung KT, Am YS, Lee SE, Jang YH, Han BR. The influence of dental service qualities on the patient satisfaction and royalty in dental clinics and hospitals. Korean J Hosp Manage. 2003; 8:49–71.
9. Papanicolas I, Cylus J, Smith PC. An analysis of survey data from eleven countries finds that satisfaction with health system performance means many things. Health Aff. 2013; 32:734–742.

10. Park JW, Yun SJ, Choe DC. The influence of medical care service quality and image on customer satisfaction and repurchase intention. Journal of korea service management society. 2003; 4:57–81.
11. Jung SY, Ahn HS, Kim SH, Jang JH, Park YD. Comparison of orthodontia patients' choice and satisfaction at different type of dental hospital. J Korean Acad Oral Health. 2005; 29:516–526.
12. Kim SY. The effect of hospital image on the hospital selection -A case of the community hospital. Graduate School Yonsei University;1987. p. 17–38.
13. Bowers MR, Swan JE, Koehler WF. “What Attributes Determine Quality and Satisfaction with Health Care Delivery?”. Health Care Management Review. 1994; 19(4):49–55.

14. Shelton DL. African-American Health: Study in Black and White. American Medical News. May 1.http://www.Ama-Assn.Org/Amed-news/2000/05/01/Hlsa0501.Htm.2000.
15. Zimmer AC. Verbal versus numerical processing. Scholz R., editorIndividual Decision Making Under Uncertainty. Amstersam: North-Holland;1985.
16. Kim MS. Medical diagnosis expert system introduced fuzzy theory in consultation mode. Graduate School of the University of Suwon;1991.
17. Sung DK, Choi IK. Developing an Evaluation Model for the Competitiveness of Local Medical Centers. Korean Public Administration Quarterly. 2009; 21:1399–1420.
18. Jang Yh, Huh SI, Park SVA, Shin SH, Kang EJ, Shin KY, Youm YS, Kang MA, Park HK, Kang SW, O JW, Koh SJ, Park EJ, Kim YH. A Report on the Korea Health Panel Survey. Korea Institute for Health and Social Affairs policy report 2007.
19. Cho IC, Cheon KC, Heo Woo, Kwak Choonjong. New Product Development for DSLR Camera applying Quality Function Deployment and Fuzzy Theory. Journal of Korean Production & Operation Management Society. 2012; 23:43–27.
20. Cho YS, Kwon HK, Chung WG. Dimensions and measures in patient satisfaction with dental care. J Korean Acad Oral Health. 2005; 29:407–417.
21. Chien CJ, Tsai HH. Using fuzzy numbers to evaluate perceived service quality. Fuzzy sets and system. 2000; 116:289–300.

22. Tsaur SH, Chang TY, Yen CH. The evaluation of airline service quality by fuzzy MCDM. Tourism Management. 2002; 23:107–115.

23. Benitez JM, Martin JC, Roman C. Using fuzzy number for measuring quality of service in the hotel industry. Tourism Management. 2007; 28:544–555.

24. Kim J, Park CS, Kang EJ. A study on medical consumers' selection of dental clinic institutions depending on their Lifestyle. J Korean Acad Oral Health. 2007; 31:568–579.
25. Veugelers PJ, Yip AM. Socioeconomic disparities in health care use: Does universal coverage reduce inequalities in health? J Epidemiol Community Health. 2003; 57:424–428.

27. Chung JH, Han JH. The Effects of the Attribute-Level Satisfaction on the Overall Satisfaction and the Mediation Role of Involvement in Medical Service. Korea Journal of Business Administration. 2009; 16:243–258.
28. Seo PS. The impact of doctor’ communication styles on patient satisfaction: empirical examination. Korean J Hosp Manaag. 2002; 7:57–101.
29. Sung BK. A Study on the Dental Service Statifation of Cityizens in Deajeon. Journal of Korean society of Dental Hygiene. 2008; 8:19–30.
30. Donabedian A. The Definition of Quality and Approaches to Its Assessment. Health Administration Press;1980.
Go to : 
Table 1.
Variables of analyses
Table 2.
Triangular Fuzzy Numbers
| Linguistic Terms | Very Low | Low | High | Very High |
|---|---|---|---|---|
| Fuzzy number (a,b,c) | (0, 0, 0.33) | (0, 0.33, 0.67) | (0.33, 0.67, 1) | (0.67, 1, 1) |
Table 3.
Socio-demographic characteristics of respondents (unit: persons, %)
Table 4.
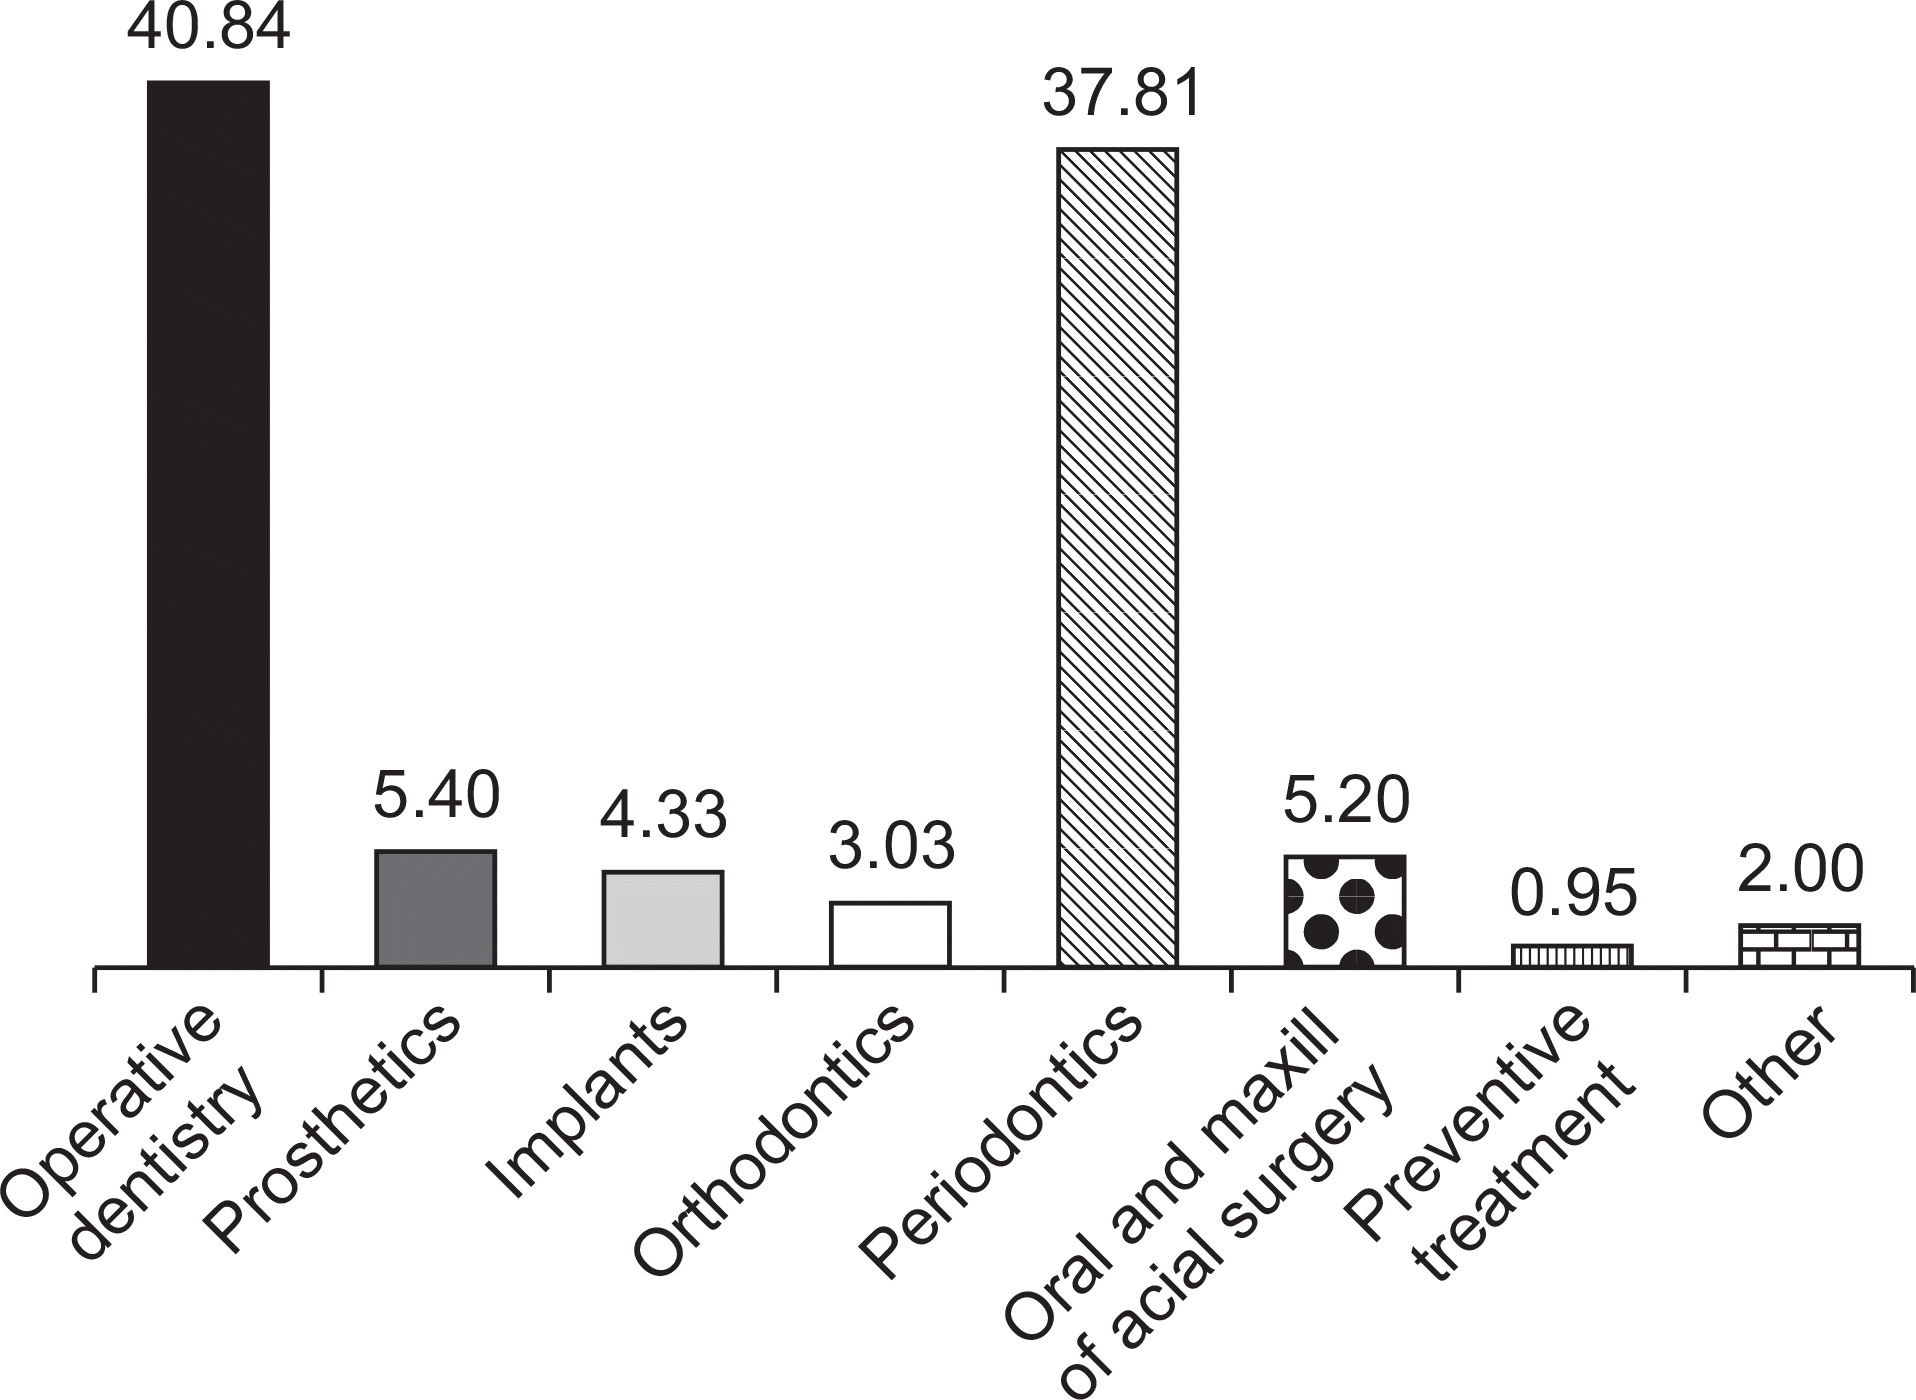
Dental service types according to socio-demographic characteristics(unit: percent)
Table 5.
Factors of influencing whether dental services utilization
Table 6.
Factors of influencing on dental services utilization among dental user
| Variables | Classification | Model 1 | Model 2 | ||
|---|---|---|---|---|---|
| e^b† | Z | dy/dx†† | Z | ||
| Gender | Male | 1 | |||
| Female | 0.914* | ―2.246 | ―0.437* | ―2.17 | |
| Age | 20-45 years | 1 | |||
| 45-65 years | 1.226*** | 3.954 | 1.037*** | 3.95 | |
| 65 years or over | 1.247* | 3.337 | 1.146* | 3.41 | |
| 20 years or below | 1.003 | 0.022 | 0.027 | 0.04 | |
| Marital status | Married | 1 | |||
| Unmarried | 1.021 | 0.311 | 0.137 | 0.39 | |
| Divorced/Widowed/Separated | 1.022 | 0.384 | 0.108 | 0.37 | |
| Education level | Primary school or lower | 1 | |||
| Middle school or lower | 0.897 | ―1.777 | ―0.545 | ―1.77 | |
| High school | 0.969 | ―0.556 | ―0.139 | ―0.49 | |
| College or higher | 0.931 | ―1.096 | ―0.325 | ―0.99 | |
| Employment by status of worker | Day labor | 1 | |||
| Regular | 0.888 | ―1.357 | ―0.593 | ―1.35 | |
| Employees | 1.044 | 0.643 | 0.234 | 0.69 | |
| Other | 1.055 | 0.914 | 0.271 | 0.92 | |
| Economic activity | Activity | 1 | |||
| Non-activity | 1.045 | 0.918 | 0.227 | 0.94 | |
| Income quartile | Low | 1 | |||
| Low-middle | 1.087 | 1.580 | 0.426 | 1.59 | |
| High-middle | 1.023 | 0.417 | 0.102 | 0.36 | |
| High | 0.964 | ―0.609 | ―0.196 | ―0.66 | |
| Dentistry | Operative dentistry | 1 | |||
| Prosthetics | 1.053 | 0.628 | 0.262 | 0.63 | |
| Implants | 1.783*** | 7.212 | 2.944* | 7.10 | |
| Orthodontics | 1.948*** | 6.424 | 3.297* | 6.16 | |
| Periodontics | 0.743*** | ―7.367 | ―1.486* | ―7.19 | |
| Oral and maxillofacial surgery | 0.575*** | ―6.312 | ―2.757* | ―6.16 | |
| Preventive treatment | 0.746* | ―2.864 | ―1.486* | ―2.87 | |
| Provider | 1.082* | 2.044 | |||
| Trust | 0.755 | 0.75 | |||
| listening courteously | 0.815 | 0.72 | |||
| Explanation | 1.971* | 2.04 | |||
| Consultation hours | ―0.151 | ―0.23 | |||
| Patient respect | ―0.921 | ―0.91 | |||


 PDF
PDF ePub
ePub Citation
 Print
Print


 XML Download