Abstract
Objectives
The purpose of this study was to analyze the dental caries pattern in primary dentition of Korean children aged 2-5 years old.
Methods
The dental caries pattern in primary dentition was analyzed using data from the Korea National Oral Health Survey, 2006. Subjects for this study were 582 children aged 2-5 years old. Statistical analysis was conducted with frequency analysis, correlation analysis, cluster analysis, and multiple correspondence analysis.
Results
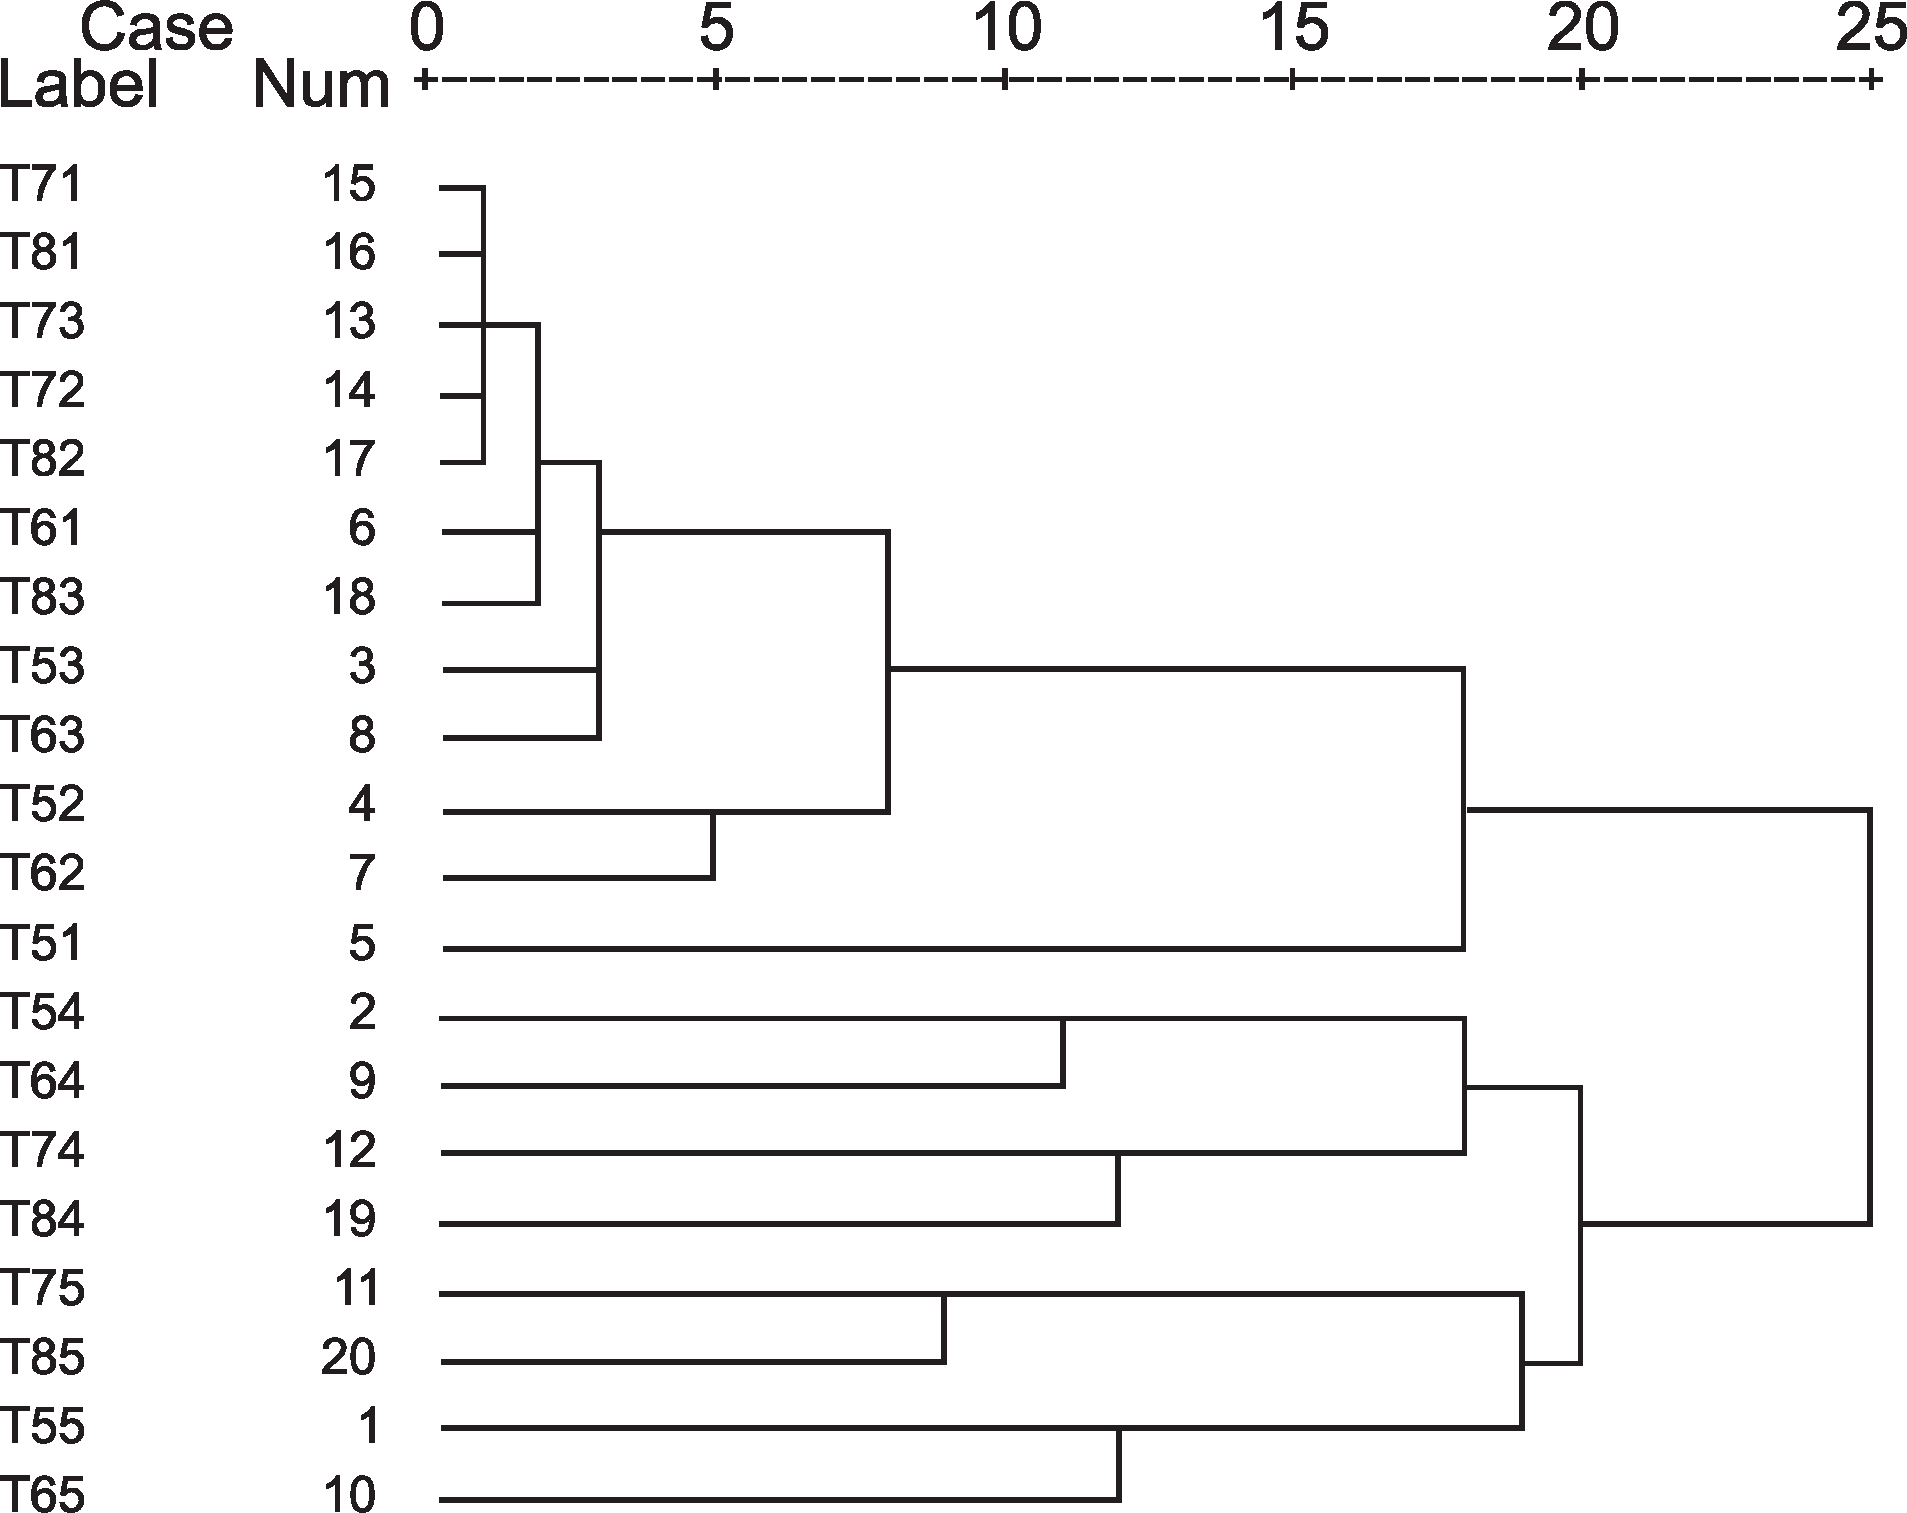
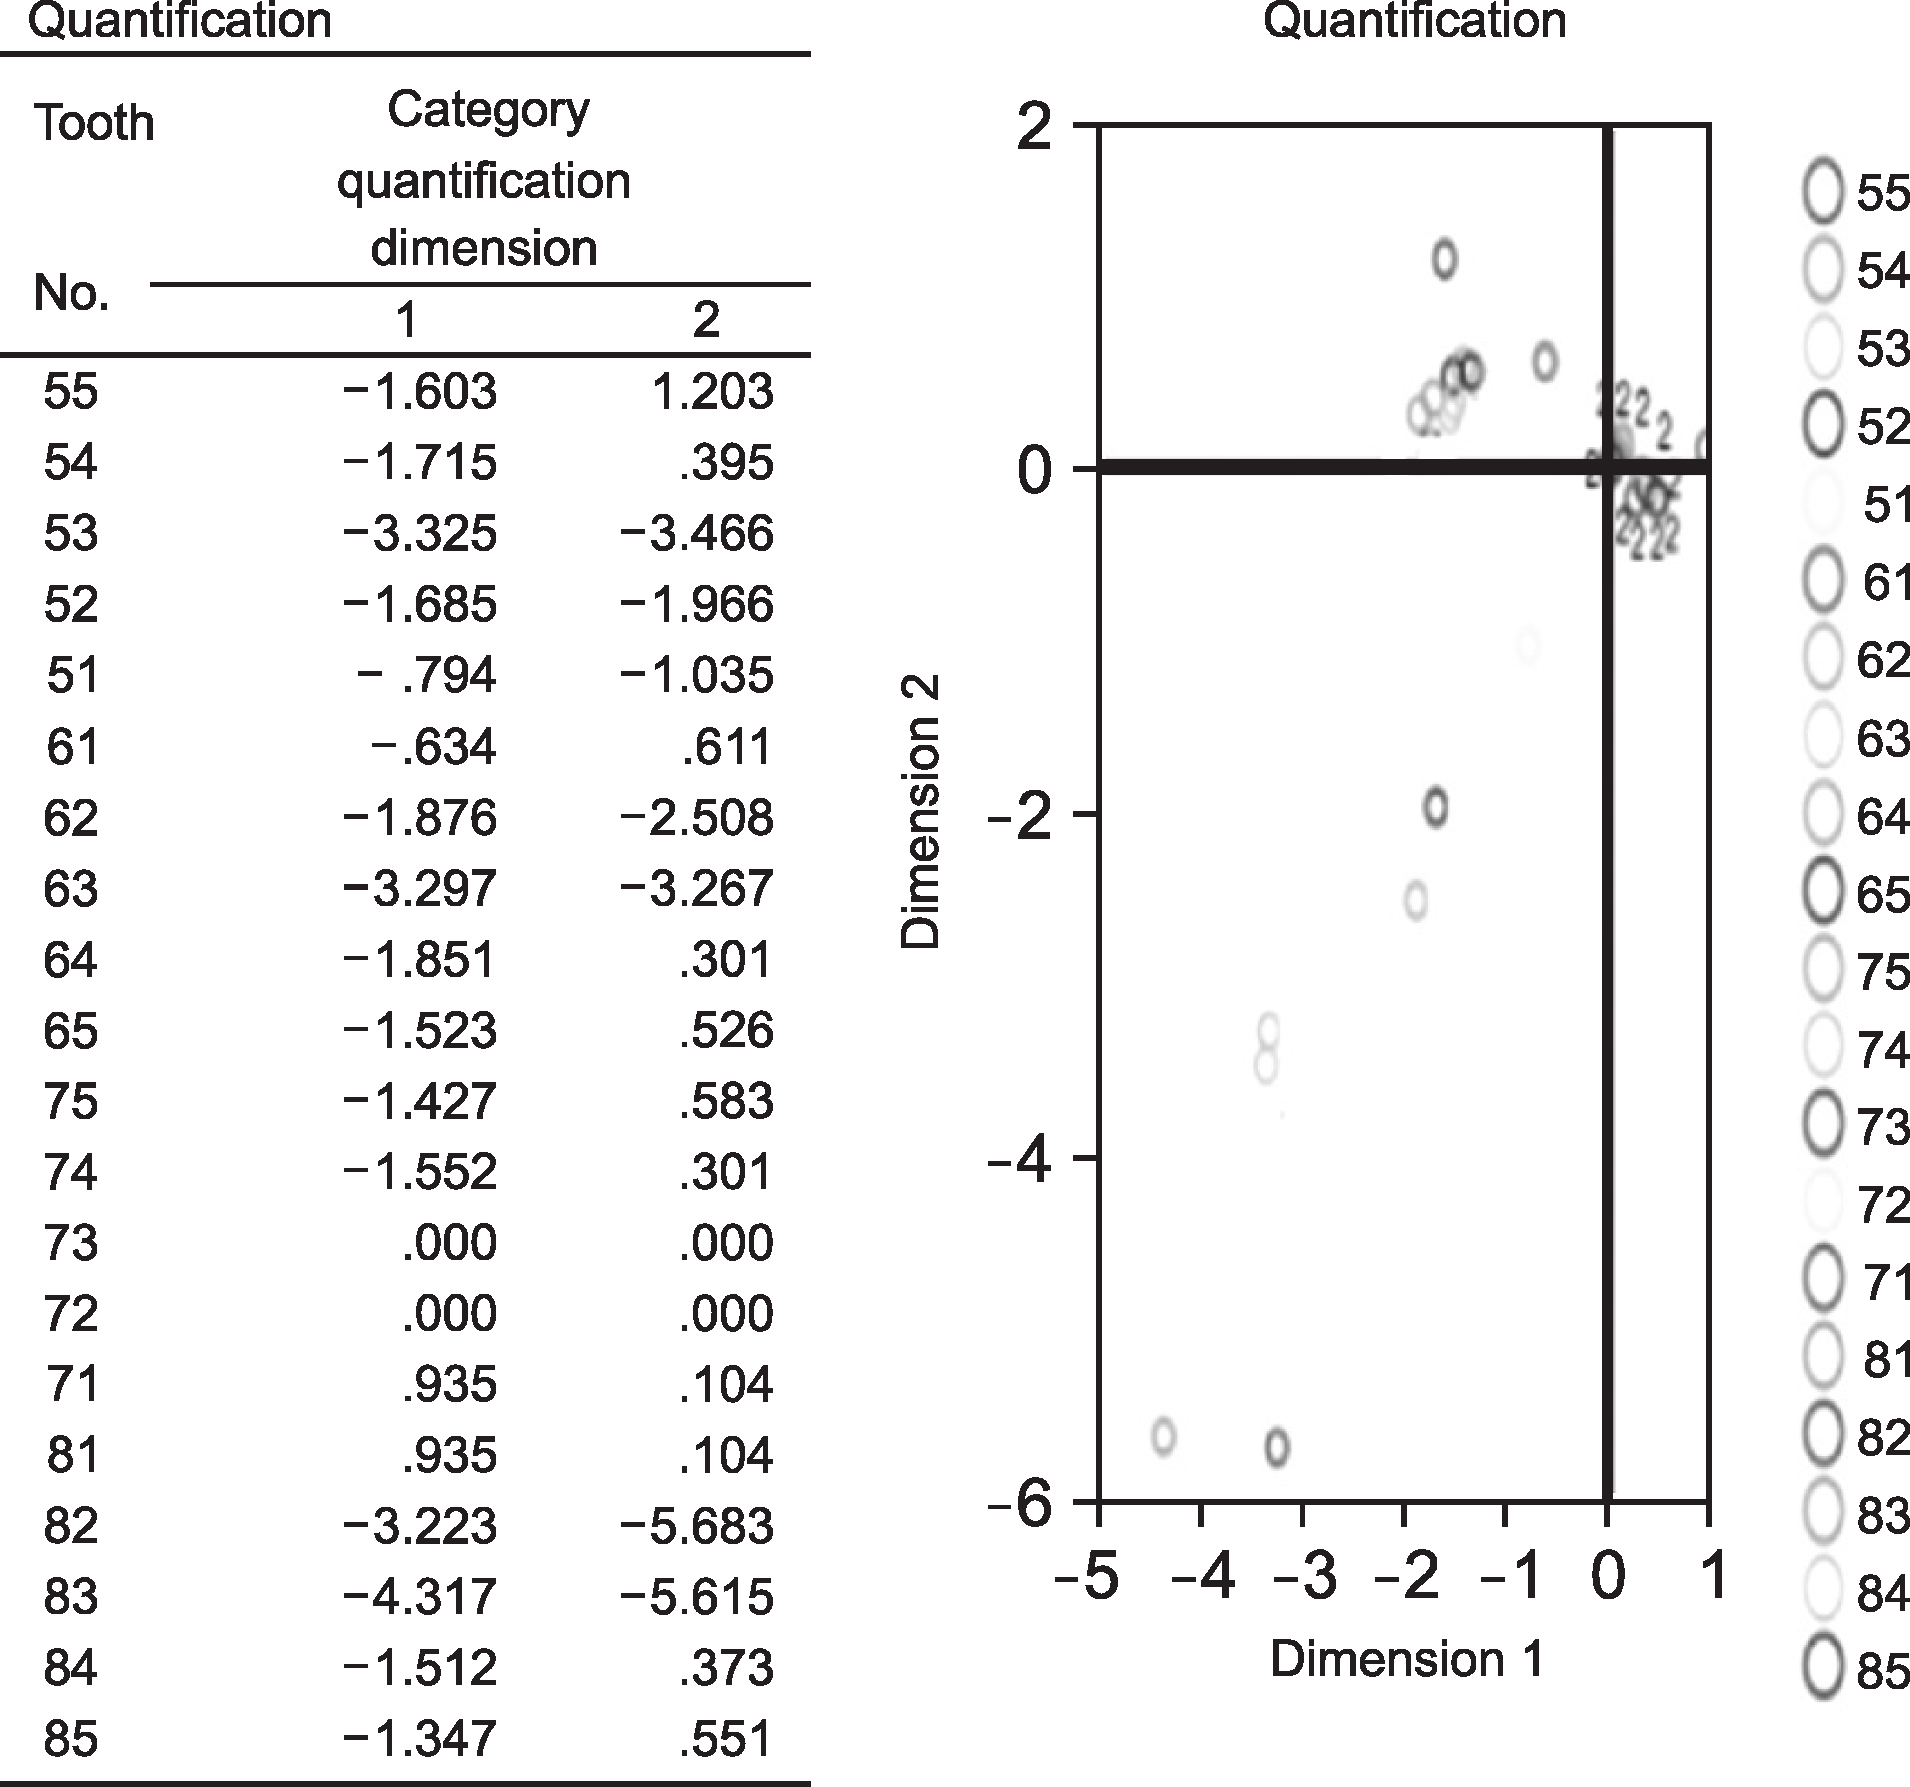
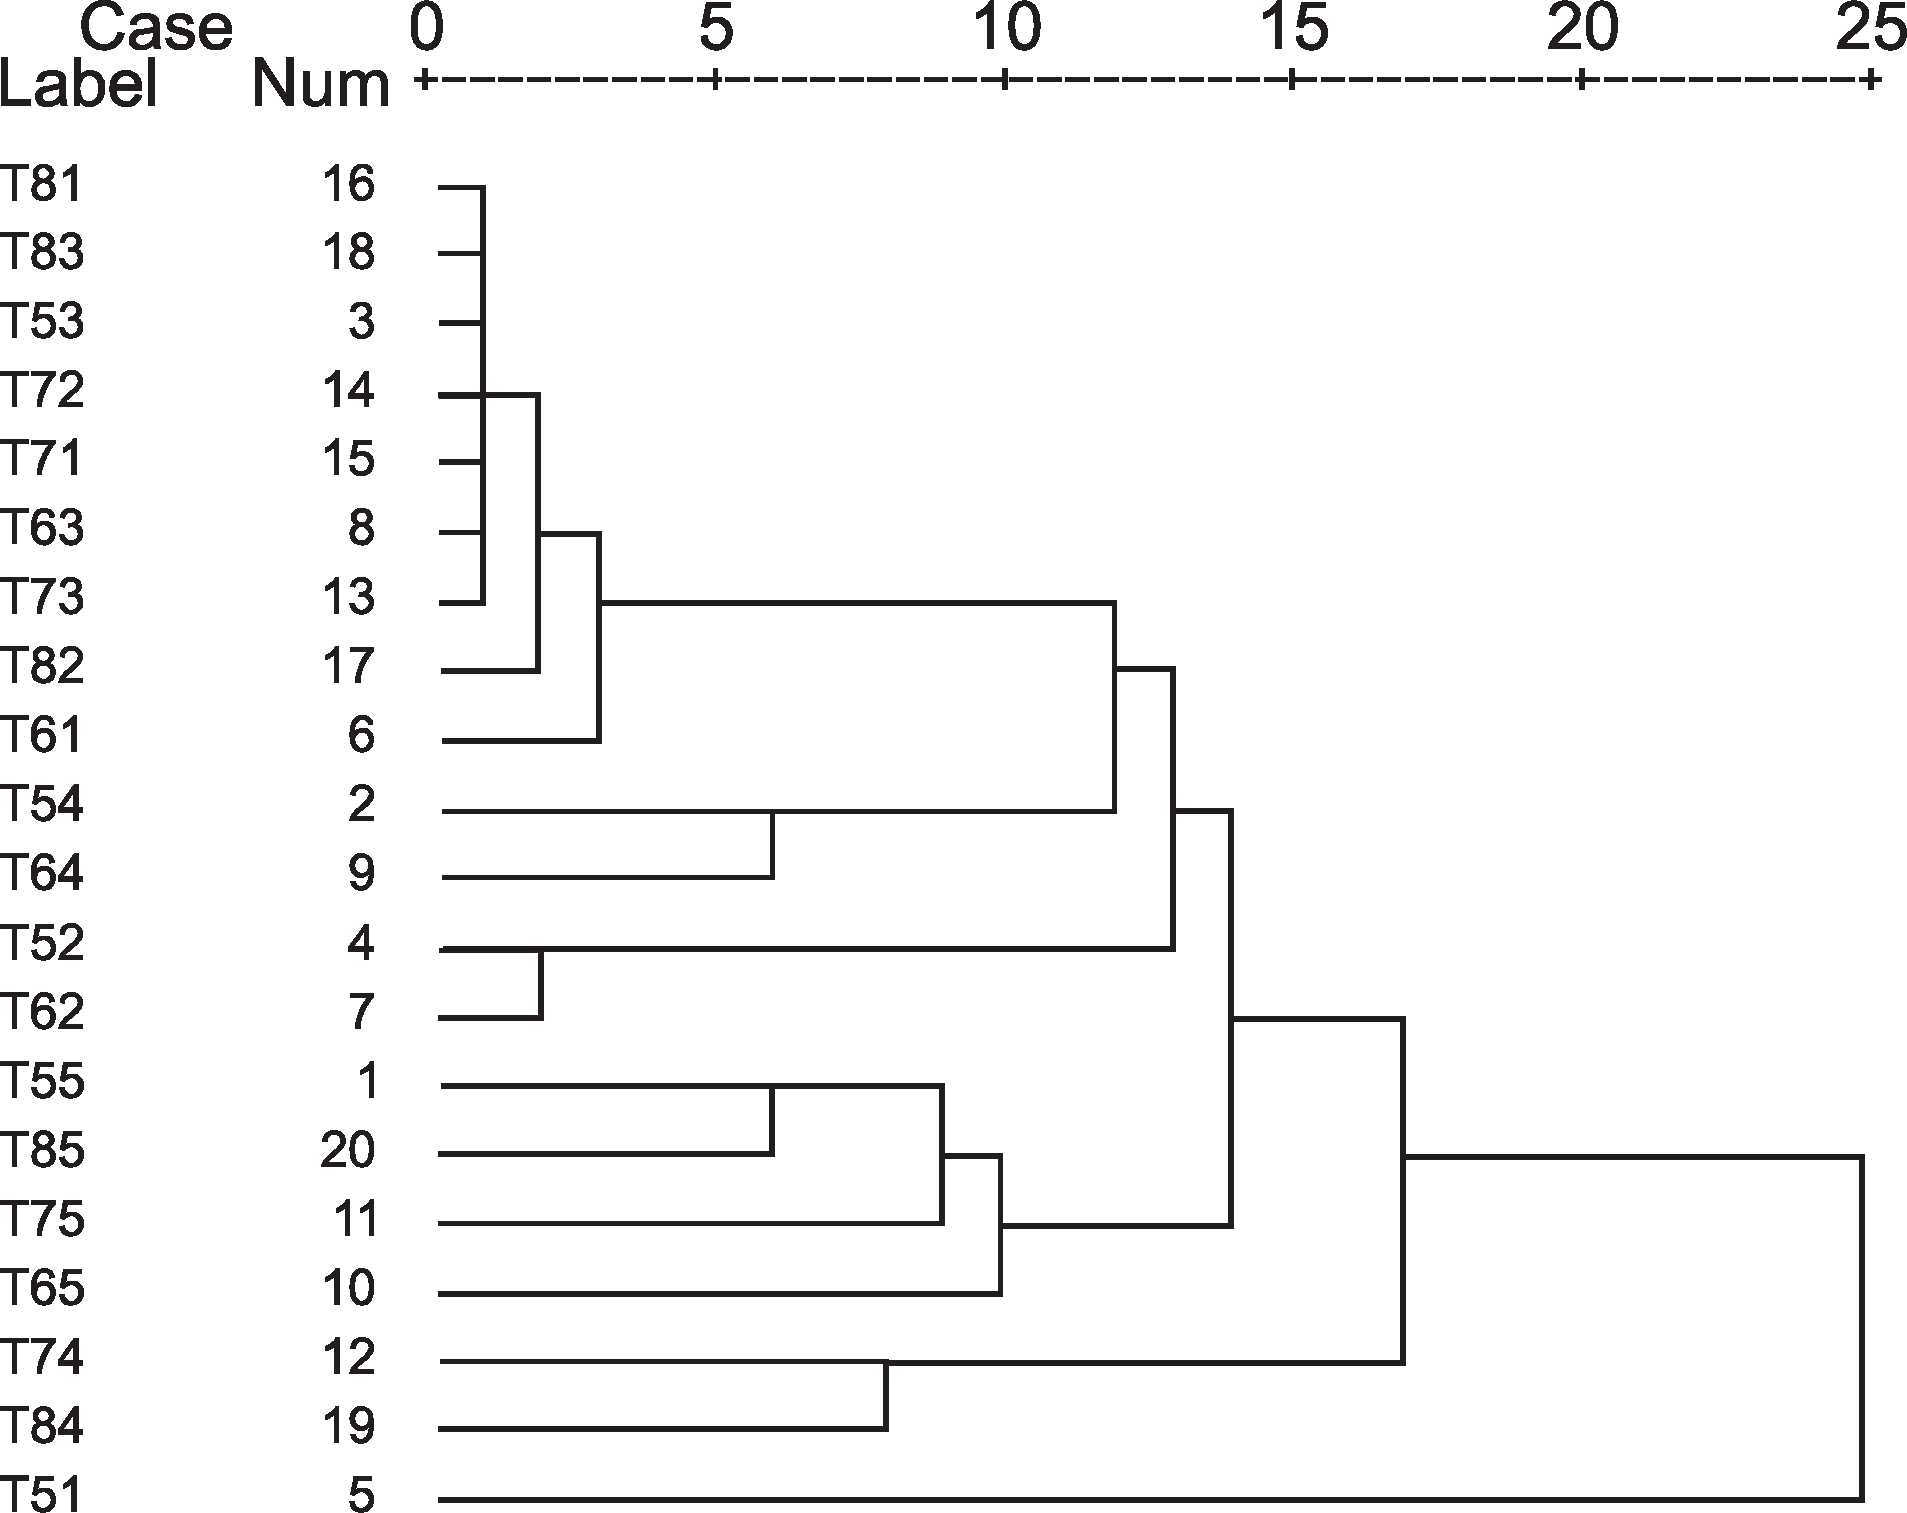
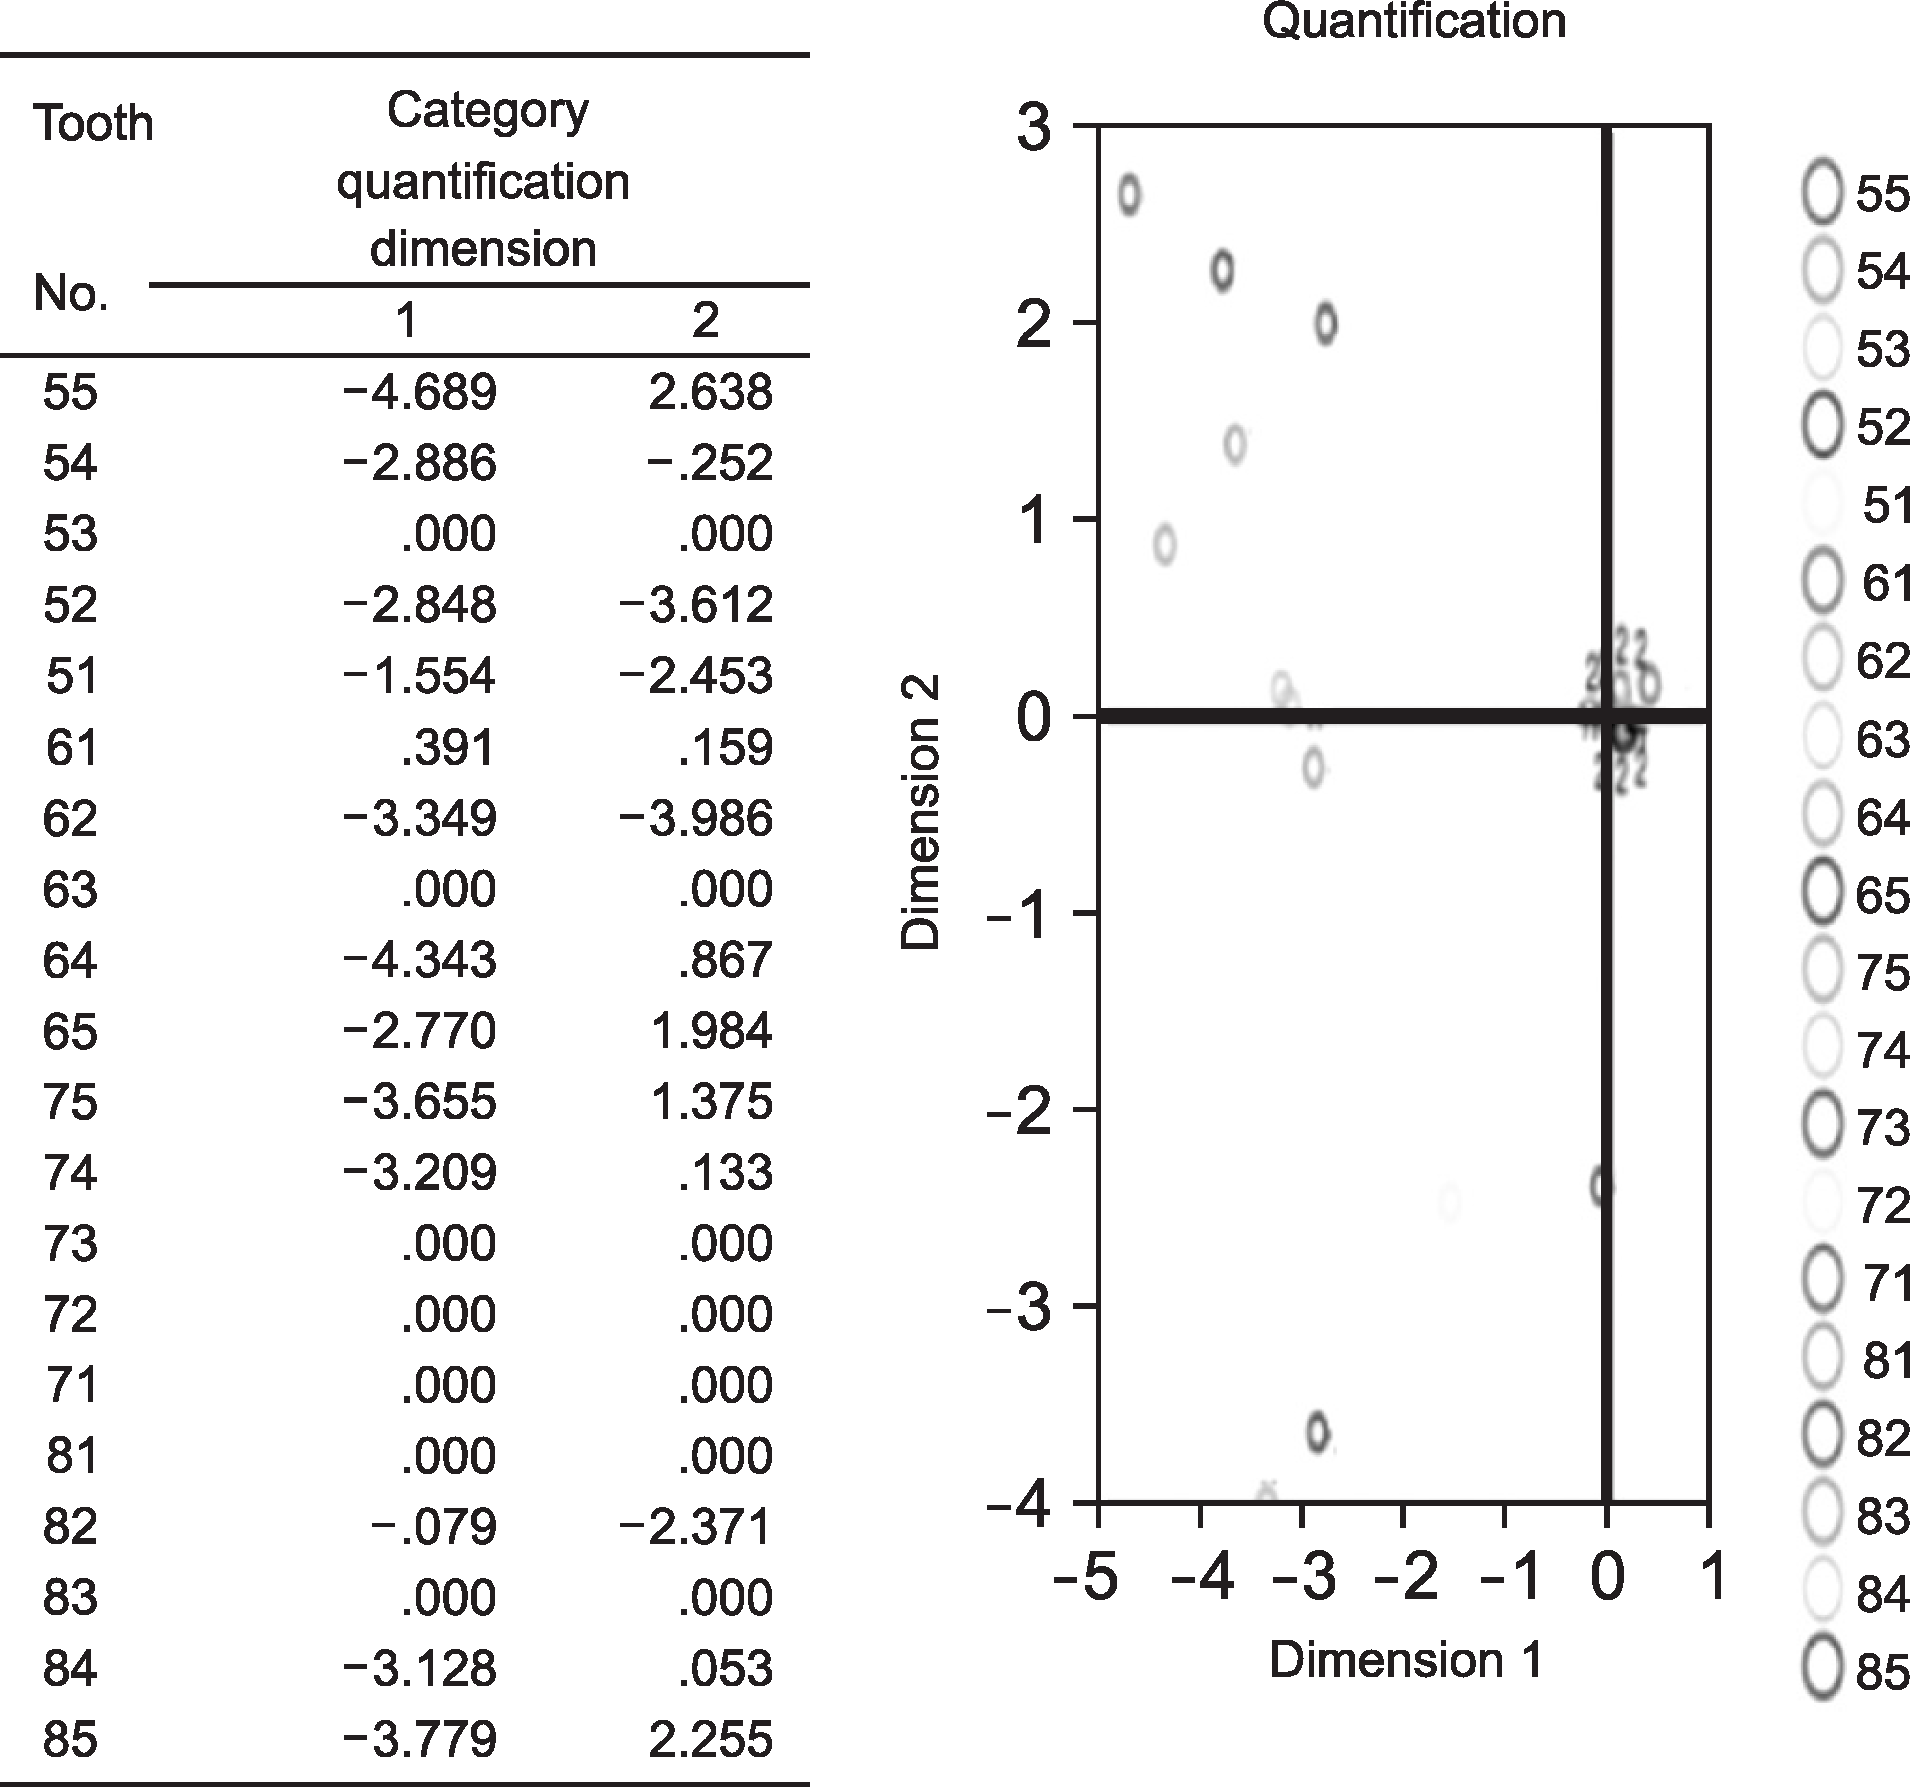
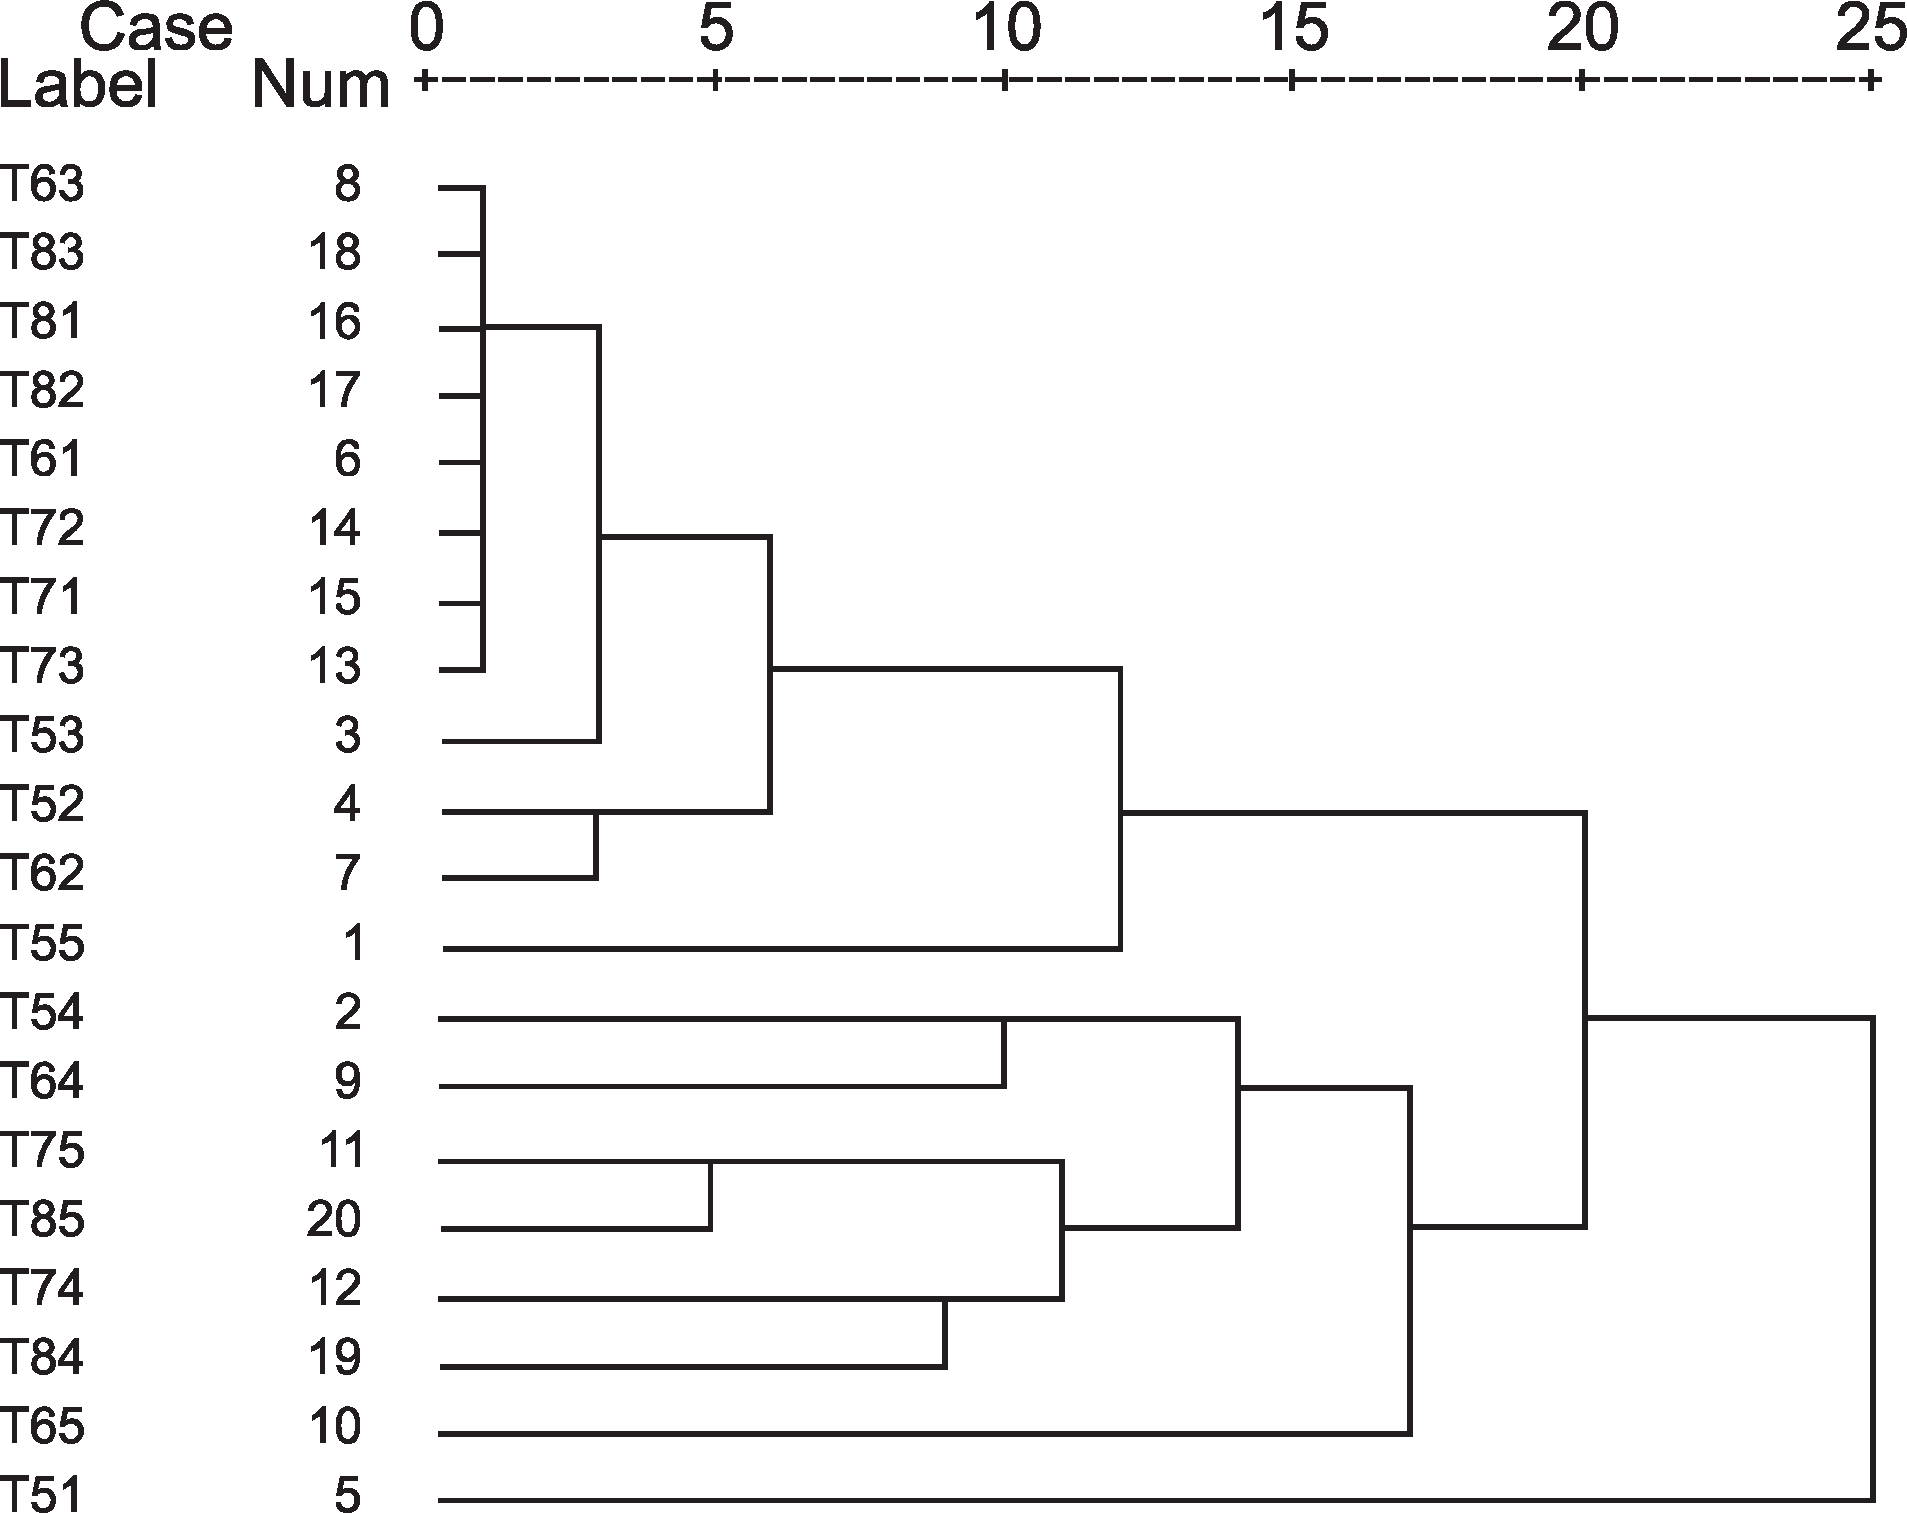
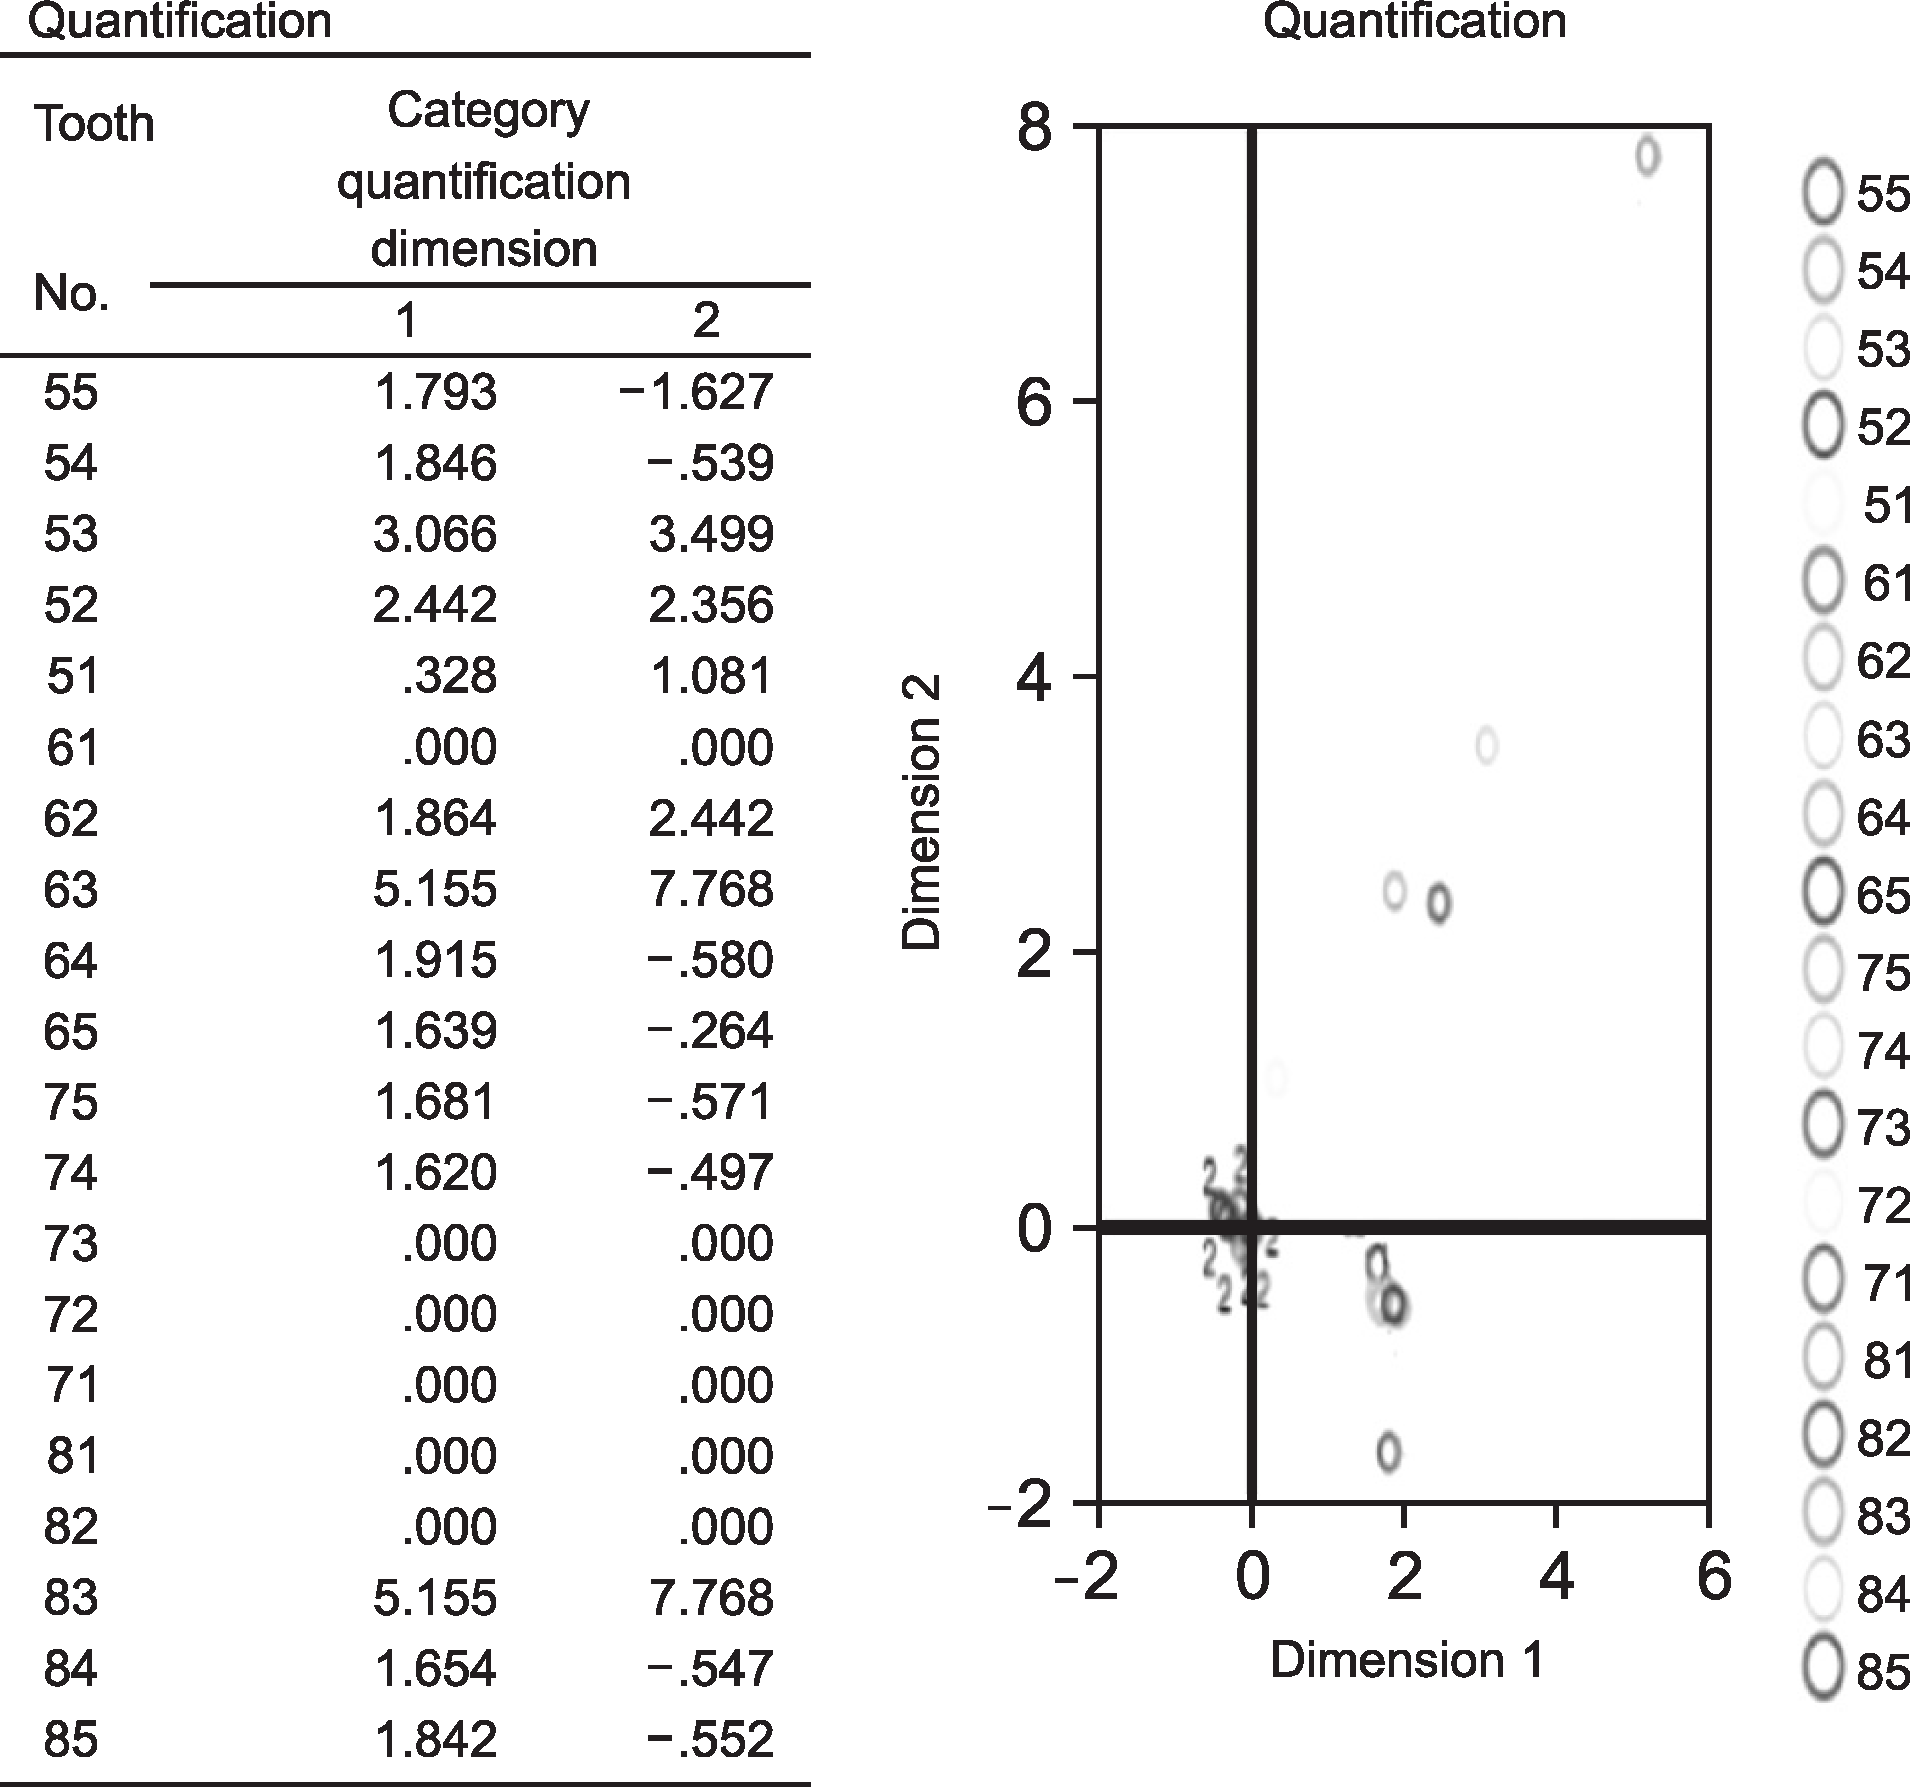
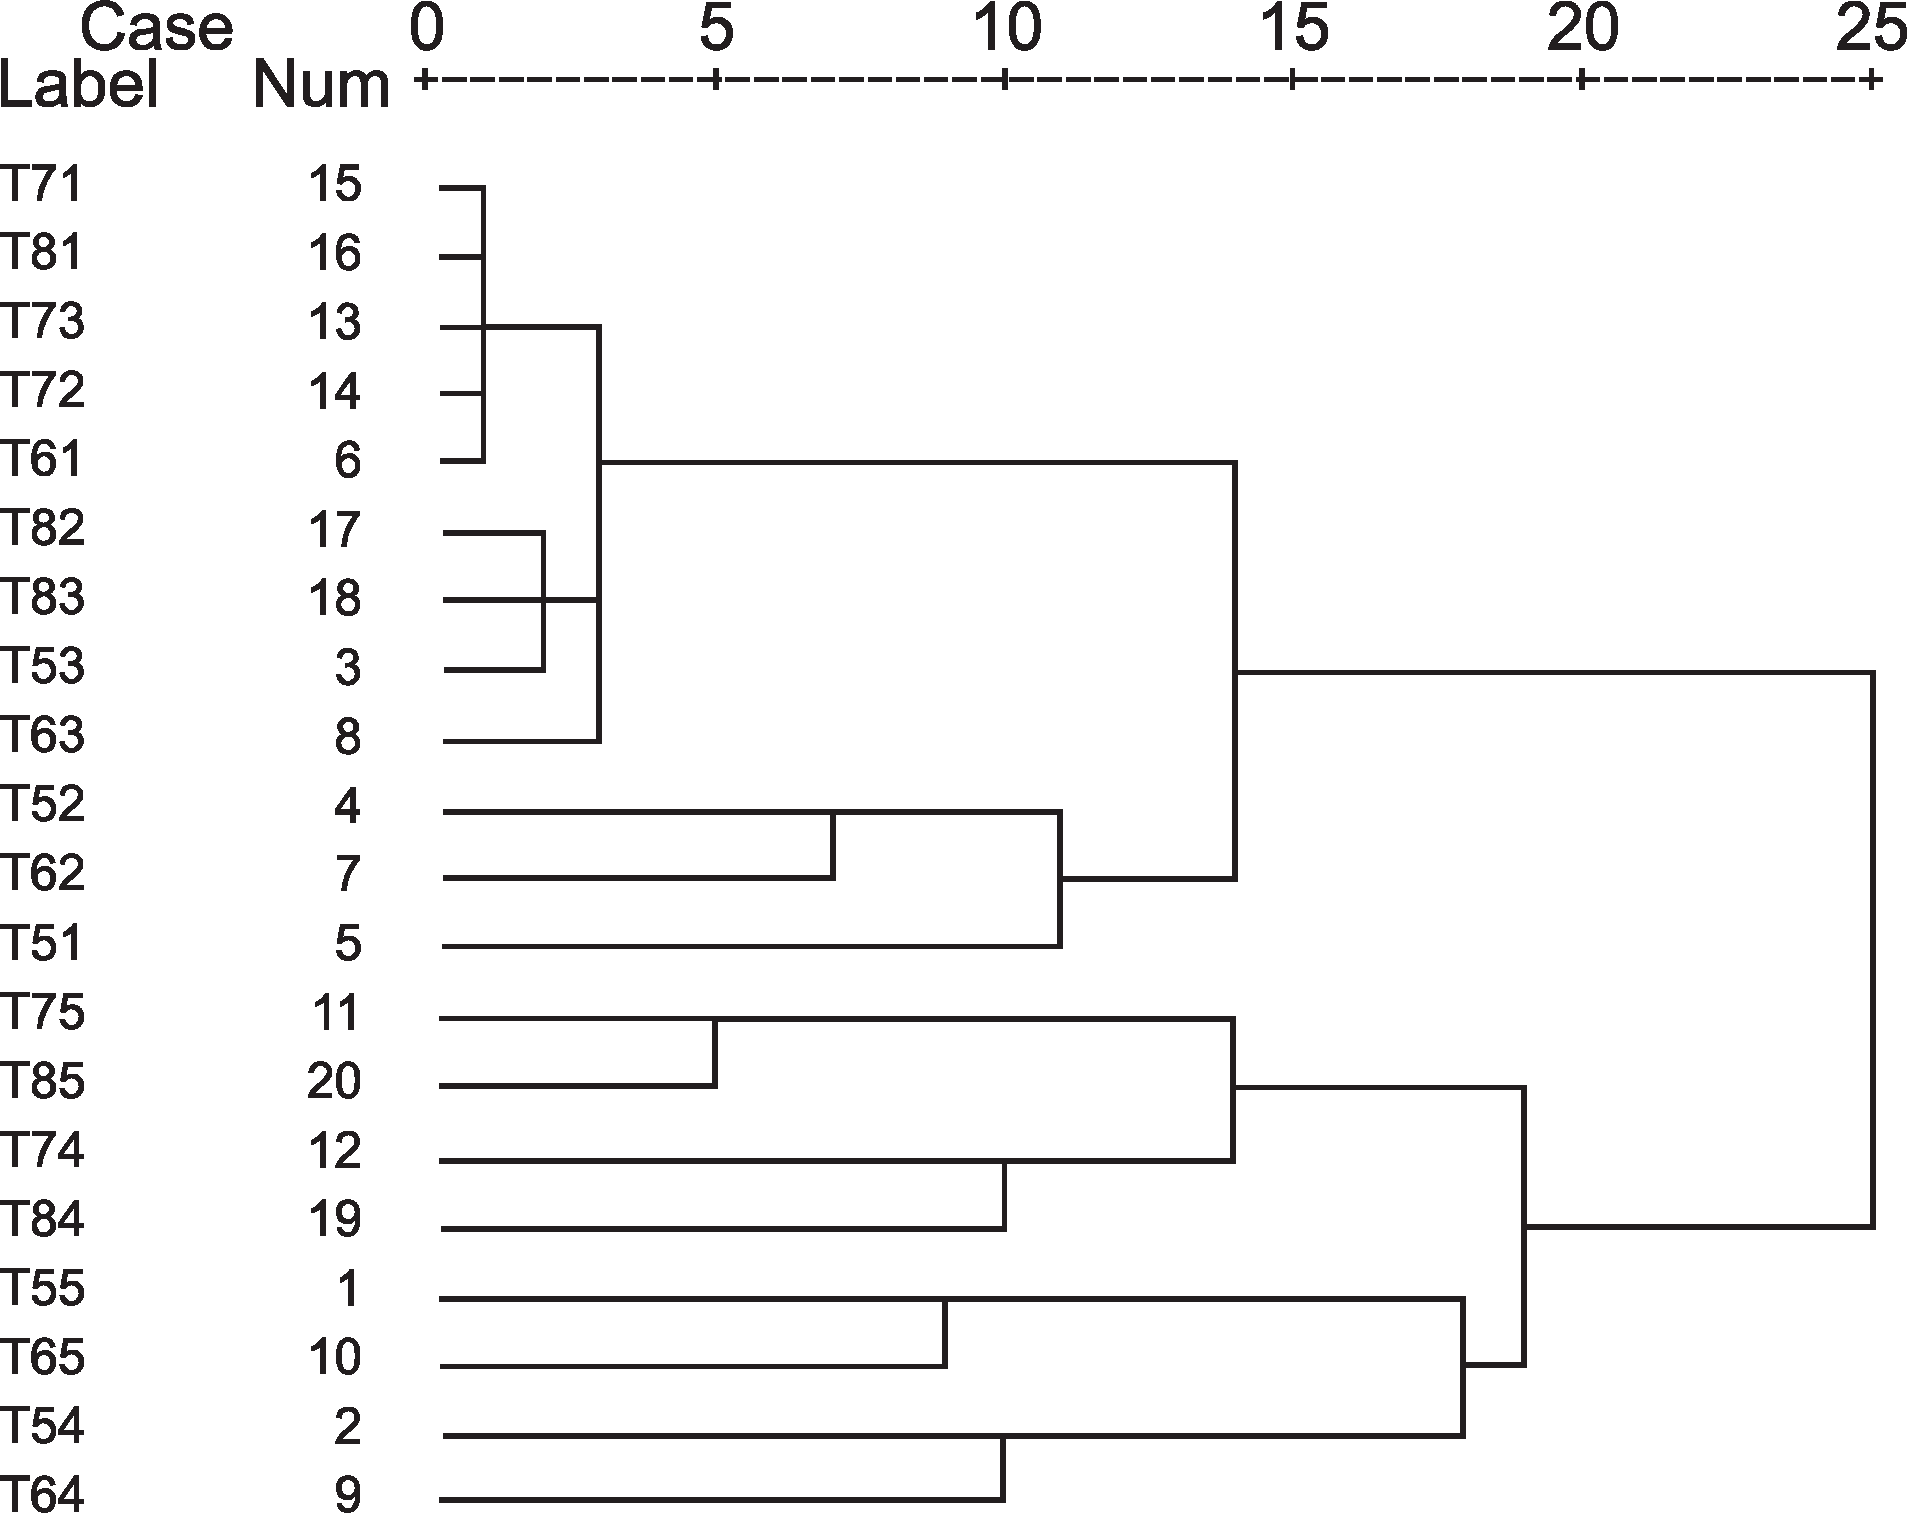
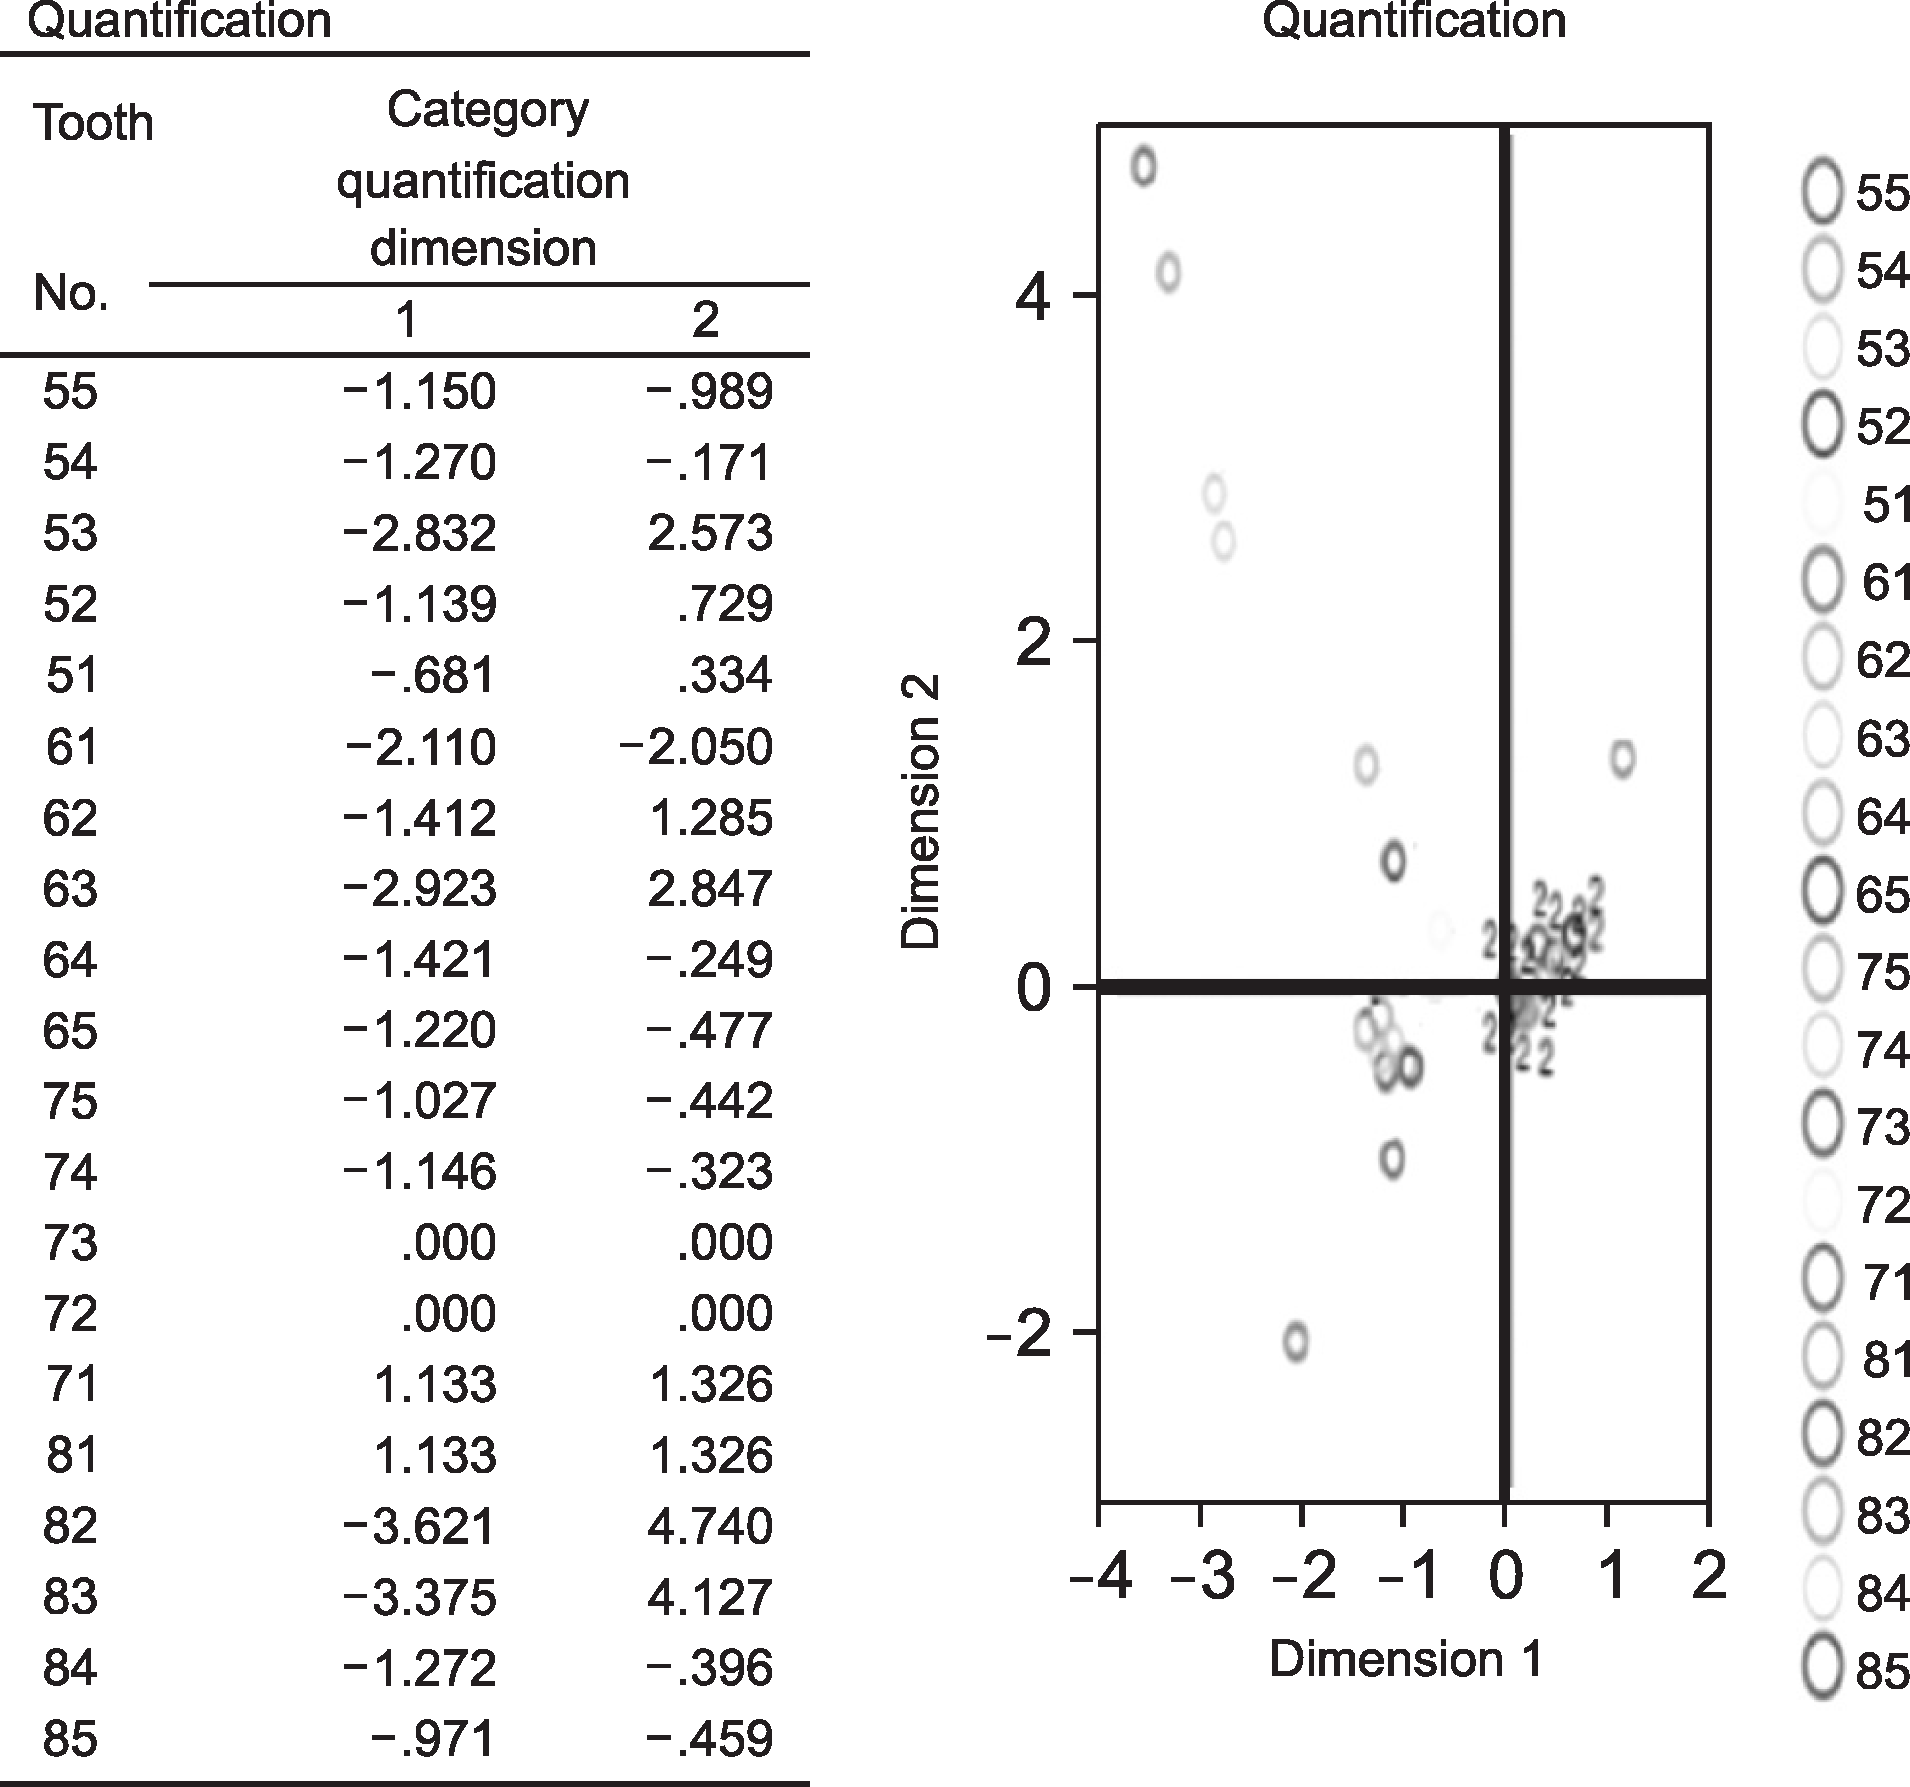
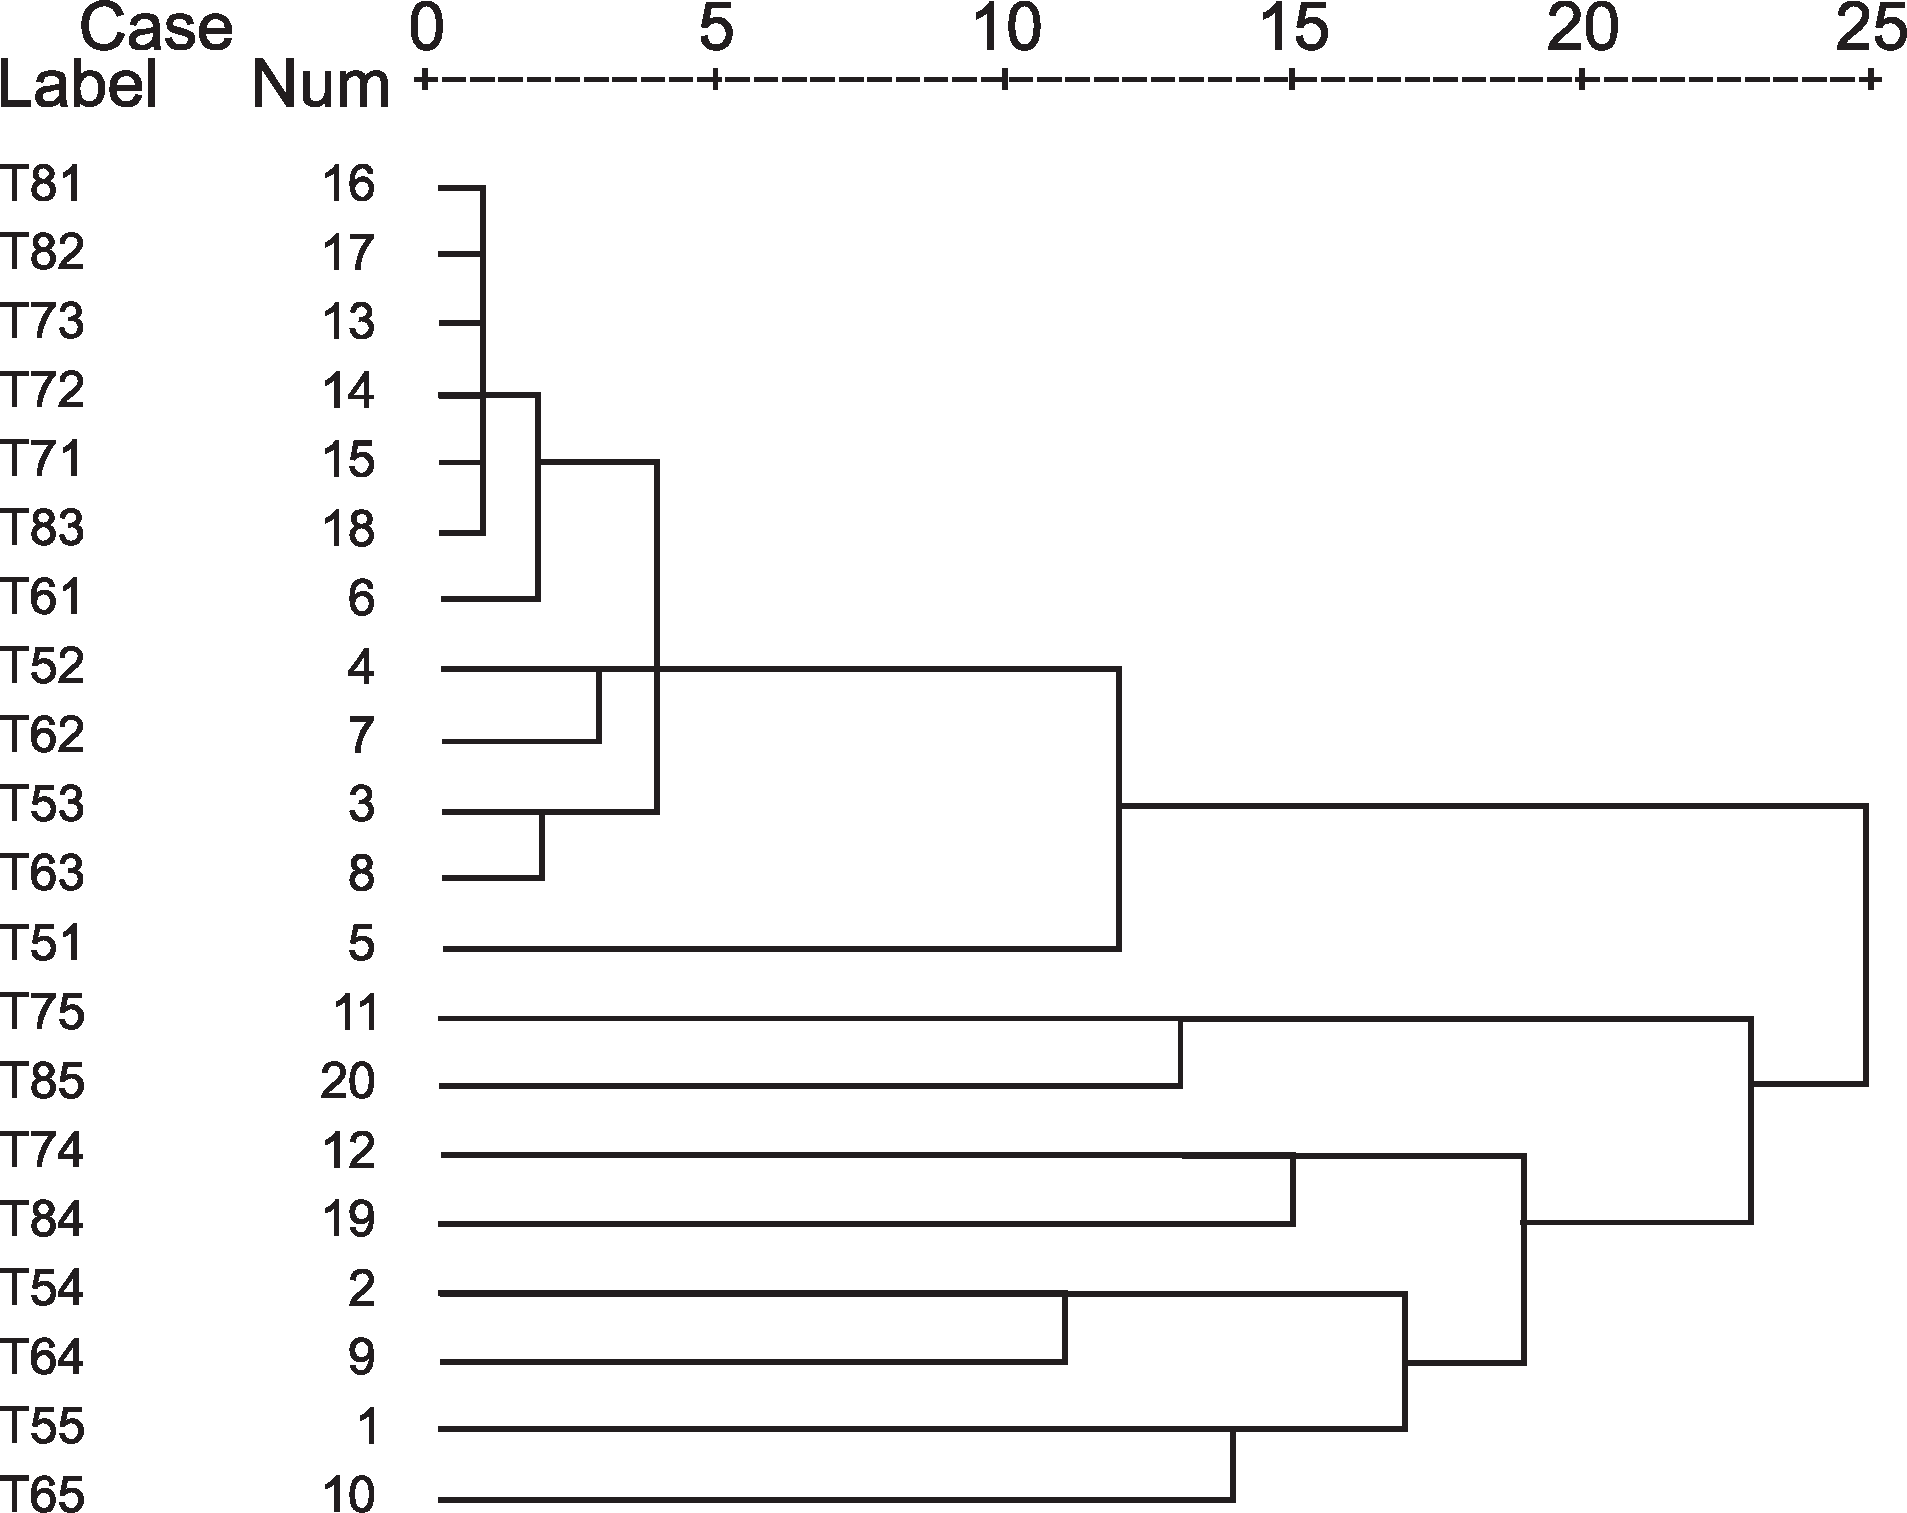
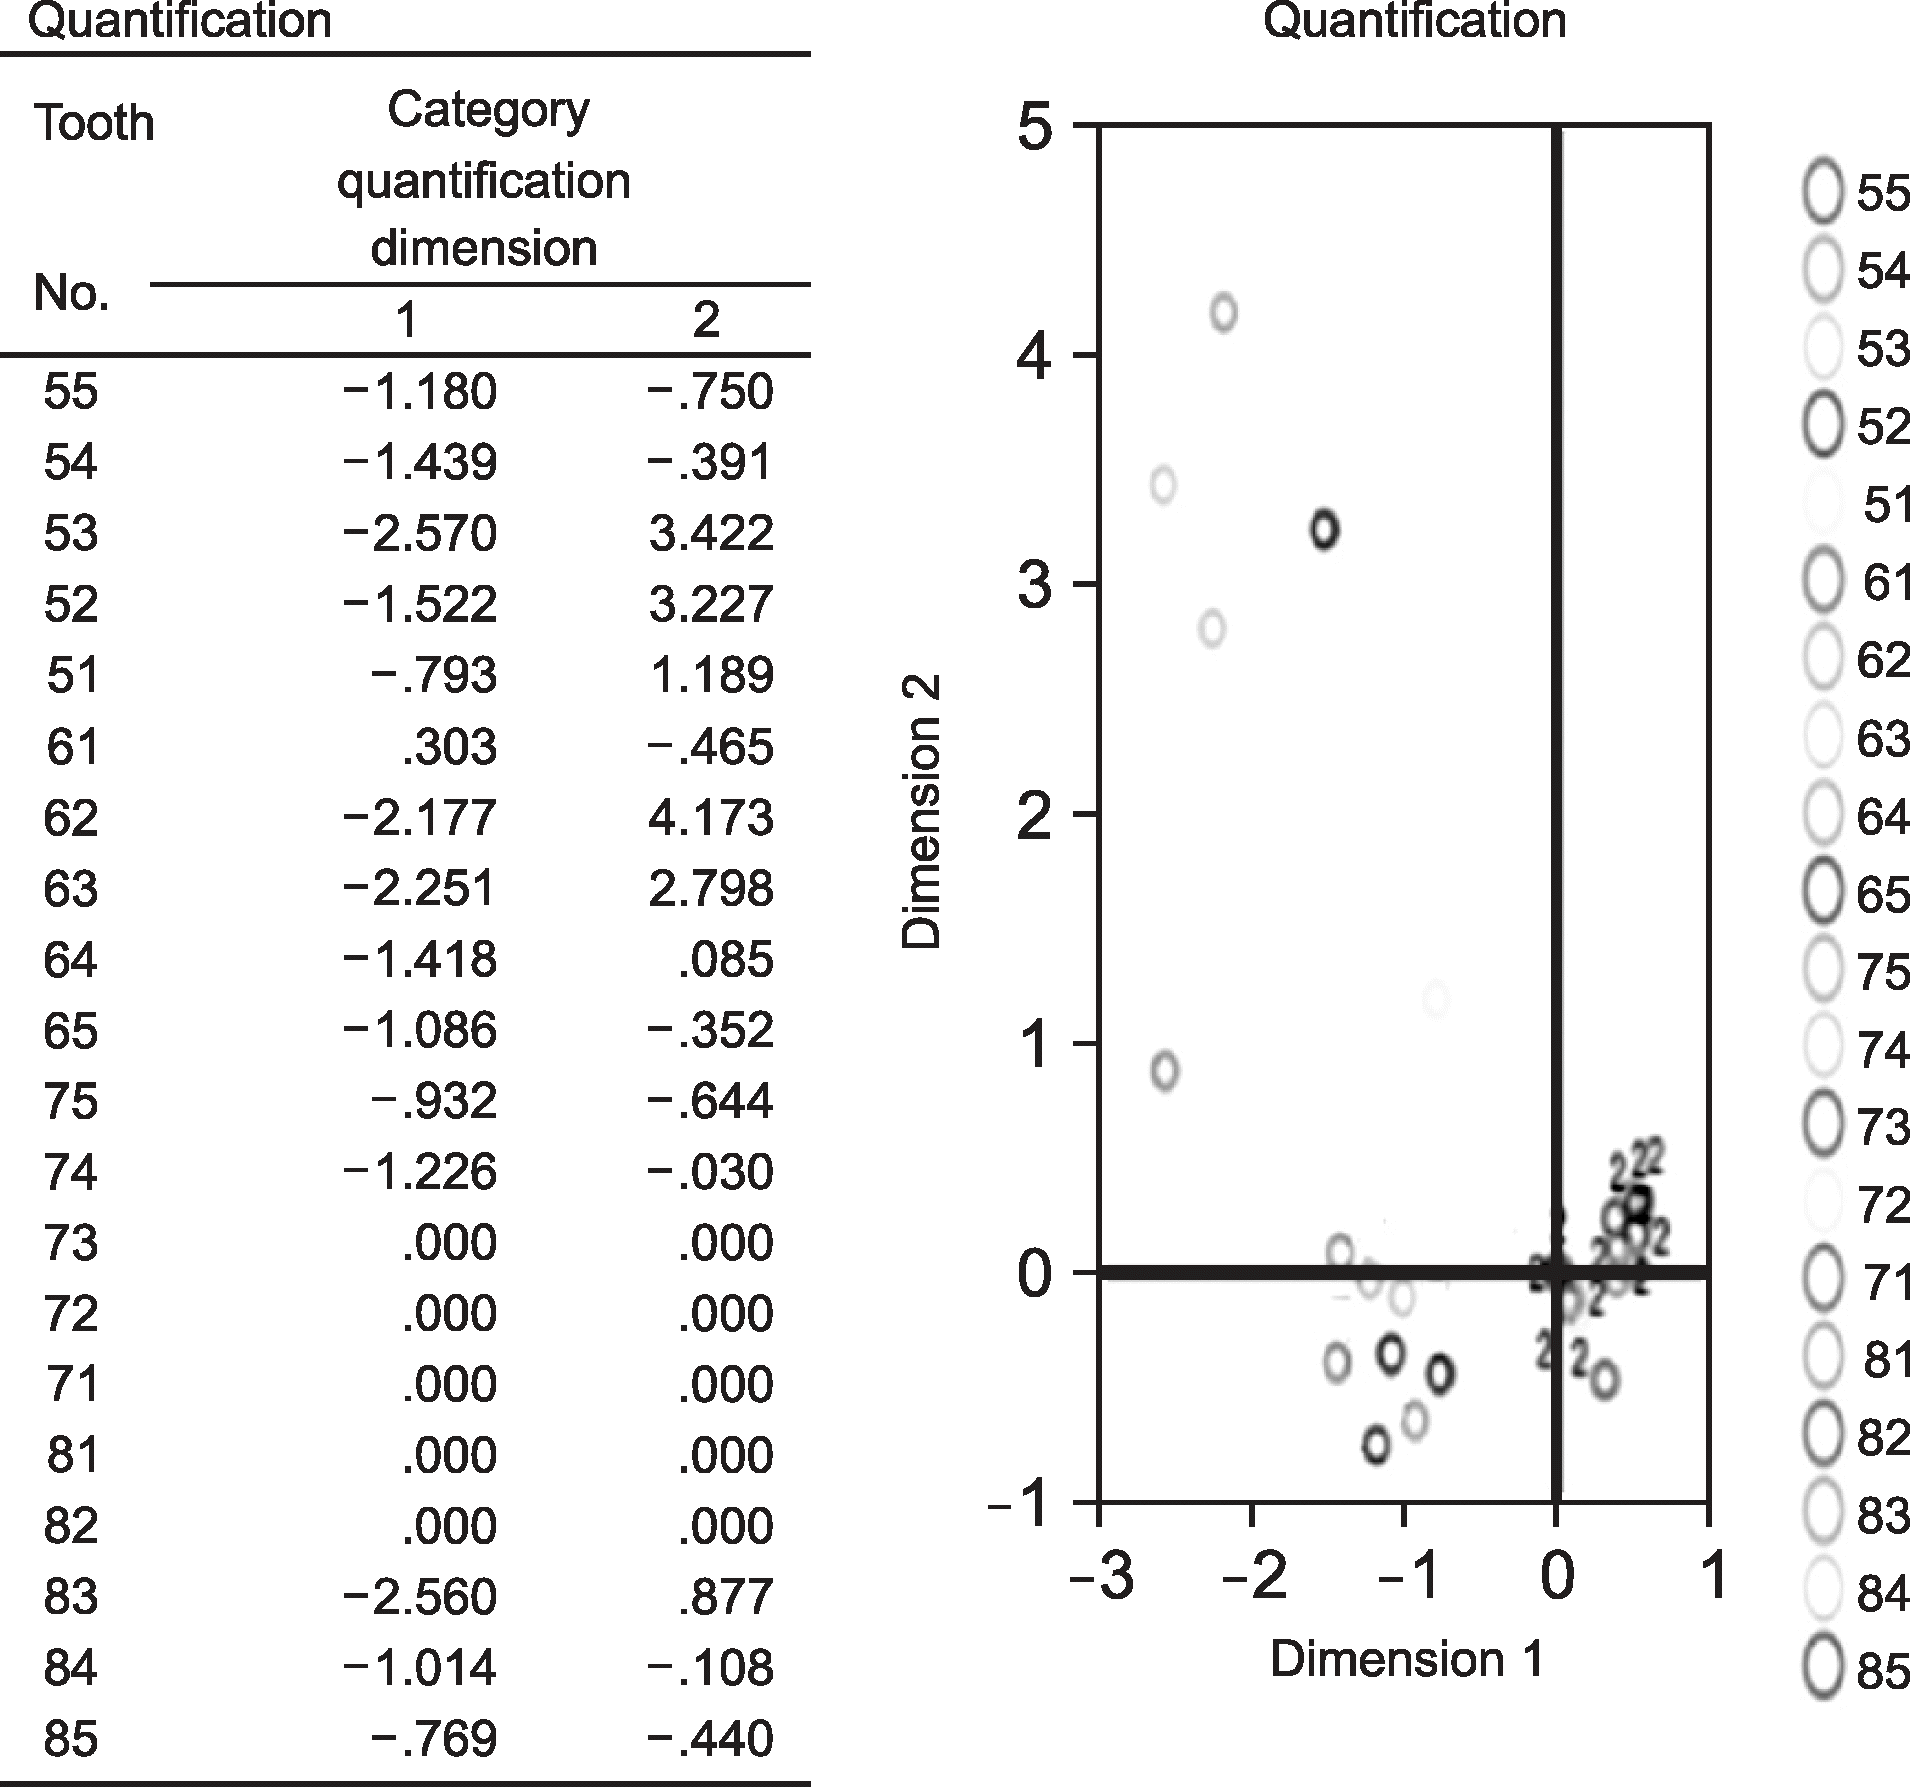
The tooth with highest prevalence of caries experience at 5 years old was the tooth 85 and the tooth 75 was followed. When dentition was divided on the basis of quadrants, the correlation of caries occurrence was more related to the relationship between the left and right teeth rather than the upper and lower teeth. In particular, the correlation of left and right caries occurrence was high in the mandible. In order to analyze the dental caries pattern under the age of 5 years, we divided the teeth into four clusters, i.e., deciduous incisors, first deciduous molars, mandibular second deciduous molars, and maxillary second deciduous molars. In children aged 2 and 3 years, severe early childhood caries pattern (ECC pattern) was observed. If it was divided into two clusters at age 4, the pattern was visible in which teeth were divided into anterior and posterior caries. Our multiple correspondence analysis results did not perfectly match those of the cluster analysis, but it was helpful to visually identify the teeth showing a similar caries pattern.
Go to : 
References
1. Psoter WJ, Morse DE, Pendrys DG, Zhang H, Mayne ST. Historical evolution of primary dentition caries pattern definitions. Pediatr Dent. 2004; 26:508–511.
2. Johnsen DC, Schubot D, Bhat M, Jones PK. Caries pattern identification in primary dentition: a comparison of clinician assignment and clinical analysis groupings. Pediatr Dent. 1993; 15:113–115.
3. Psoter WJ, Zhang H, Pendrys DG, Morse DE, Mayne ST. Classification of dental caries patterns tn the primary dentition: a multidimensional scaling analysis. Community Dent Oral Epidemiol. 2003; 31:231–238.
4. Powell LV. Caries prediction: a review of the literature. Community Dent Oral Epidemiol. 1998; 26:361–371.

5. Demers M, Brodeur JM, Simard PL, Mouton C, Veilleux G, Fréchette S. Caries predictors suitable for mass-screenings in children: a literature review. Community Dent Health. 1990; 7:11–21.
6. Druy TF, Horrowitz AM, Ismail AI, Maertens MP, Rozier RG, Selwitz RH. Diagnosing and reporting early childhood caries for research purpose:A report of a workshop sponsored by the National Institute of Dental and Craniofacial Research, the Health Resources and Services Administration, and the Health Care Financing Administration. J Public Health Dent. 1999; 59:192–197.
7. Vanobbergen J, Lesaffre E, Garcia-Zattera MJ, Jara A, Martens L, Declerck D. Caries patterns in primary dentition in 3-, 5- and 7-year-old children: spatial correlation and preventive consequences. Caries Res. 2007; 41:16–25.

8. Lee JS, Lee KH, Kim DE. Caries patterns in primary dentition by caries experience of individual teeth. J Korean Acad Pediatr Dent. 1999; 26:1–13.
9. Jeong SY, Lee KH, Ra JY, An SY, Kim YH. Dental caries patterns in the primary dentition : a cluster analysis and a multidimensional scaling analysis. J Korean Acad Pediatr Dent. 2010; 37:159–167.
10. Ministry of Health and Welfare. Korean national oral health survey 2006: III. Summary. Seoul: Ministry of Health and Welfare;2006. p. 3–10.
11. Noh HJ. Multivariate statistical analysis by Hangeul SPSSWIN. Seoul: Sukjungbooks;1999. p. 559–590. 621-637.
12. Lee HS, Im JH. SPSS 14.0 manual. Seoul: Bobmunsa;2008. p. 452–471.
13. Ferro R, Besostri A, Olivieri A. Caries prevalence and tooth surface distribution in a group of 5-year-old Italian children. Eur Arch Paediatr Dent. 2009; 10:33–37.

14. Elfrink ME, Veerkamp JS, Kalsbeek H. Caries pattern in primary molars in Dutch 5-year-old children. Eur Arch Paediatr Dent. 2006; 7:236–240.

15. Skeie MS, Raadal M, Strand GV, Espelid I. The relationship between caries in the primary dentition at 5 years of age and permanent dentition at 10 years of age - a longitudinal study. Int J Paediatr Dent. 2006; 16:152–160.

16. Lucas JR, Largaespada LL. Explaining sex differences in dental caries prevalence: saliva, hormones, and “life-history” etiologies. Am J Hum Biol. 2006; 18:540–555.
17. Lukacs JR. Gender differences in oral health in South Asia: meta data imply multifactorial biological and cultural causes. Am J Hum Biol. 2011; 23:398–411.
18. Ismail AI, Sohn W, Lim S, Willem JM. Predictors of dental caries progression in primary teeth. J Dent Res. 2009; 88:270–275.

19. Declerck D, Leroy R, Martens L, Lesaffre E, Garcia-Zattera MJ, Vanden Broucke S, et al. Factors associated with prevalence and severity of caries experience in preschool children. Community Dent Oral Epidemiol. 2008; 36:168–178.

20. Greenwell AL, Johnsen D, DiSantis TA, DiSantis TA, Gerstenma-ier J, Limbert N. Longitudinal evaluation of caries patterns from the primary to the mixed dentition. Pediatr Dent. 1990; 12:278–282.
21. Douglass JM, O’Sullivan DM, Tinanoff N. Temporal changes in dental caries levels and patterns in a Native American preschool population. J Public Health Dent. 1996; 56:171–175.

22. O’Sullivan DM, Tinanoff N. Social and biological factors contributing to caries of the maxillary anterior teeth. Pediatr Dent. 1993; 15:41–44.
23. Douglass JM, Wei Y, Zhang BX, Tinanoff N. Caries prevalence and patterns in 3-6-year-old Beijing children. Community Dent Oral Epidemiol. 1995; 23:340–343.

24. Douglass JM, Tinanoff N, Tnag JMW, Altman DS. Dental caries patterns and oral health behaviors in Arizona infants and toddlers. Community Dent Oral Epidemiol. 2001; 29:14–22.

25. Im KW, Lee KH, Ra JY, An SY, Kim YH. Tooth surface caries patterns in the primary dentition according to breast or bottle feeding. J Korean Acad Pediatr Dent. 2010; 37:151–157.
26. Korean Academy of Pediatric Dentistry. Dentistry for the child and adolescent. Seoul: Shinhung International;2007. p. 154.
27. Psoter WJ, Pendrys DG, Morse DE, Zhang H, Mayne ST. Associa-tions of ethnicity/race and socioeconomic status with early childhood caries patterns. J Public Health Dent. 2006; 66:23–29.

28. Kiwanuka SN, Astrøm AN, Trovik TA. Dental caries experience and its relationship to social and behavioural factors among 3-5-year-old children in Uganda. Int J Paediatr Dent. 2004; 14:336–46.

29. Al-Malik MI, Holt RD, Bedi R. Prevalence and patterns of caries, rampant caries, and oral health in two- to five-year-old children in Saudi Arabia. J Dent Child. 2003; 70:235–242.
Go to : 
Table 1.
Distribution of sample by age and gender unit: N (%)
Table 2.
Clustering coefficient of cluster analysis according to age
Table 3.
Caries experience in the primary dentition by age
Table 4.
Caries experience by tooth type (n=582) unit: N (%)
Table 5.
Correlation of DMFT indexes among the quadrant in primary dentition†
| Side | Upper right | Upper left | Lower left | Lower | Left |
|---|---|---|---|---|---|
| Upper left | 0.774* | ||||
| Lower left | 0.695* | 0.698* | |||
| Lower right | 0.698* | 0.688* | 0.830* | ||
| Upper | 0.728* | ||||
| Right | 0.871* |


 PDF
PDF ePub
ePub Citation
 Print
Print


 XML Download