Abstract
Objectives
The aim of this study was to compare the tooth bleaching effect of two whitening materials in toothpaste i.e., hydroxyapatite and hydrogen peroxide on. In a randomized, double blinded controlled clinical trial, 85 participants with tooth colorations were assigned to use one of three toothpastes containing either hydroxyapatite (0.25%), hydrogen peroxide (0.75%), or no active ingredient (placebo). The patients were examined at baseline and 1, 2, and 3 months after usage.
Methods
The patients underwent an oral examination, tooth shade measurement, and a subjective evaluation. During the oral examination, the patient’s oral health status was determined. ShadeEye NCC and Vita classical shade guide were used to determine the tooth color. Further, the patients were asked to assess the color of their own teeth using a visual analog scale (VAS) scale (range, 1-5).
Results
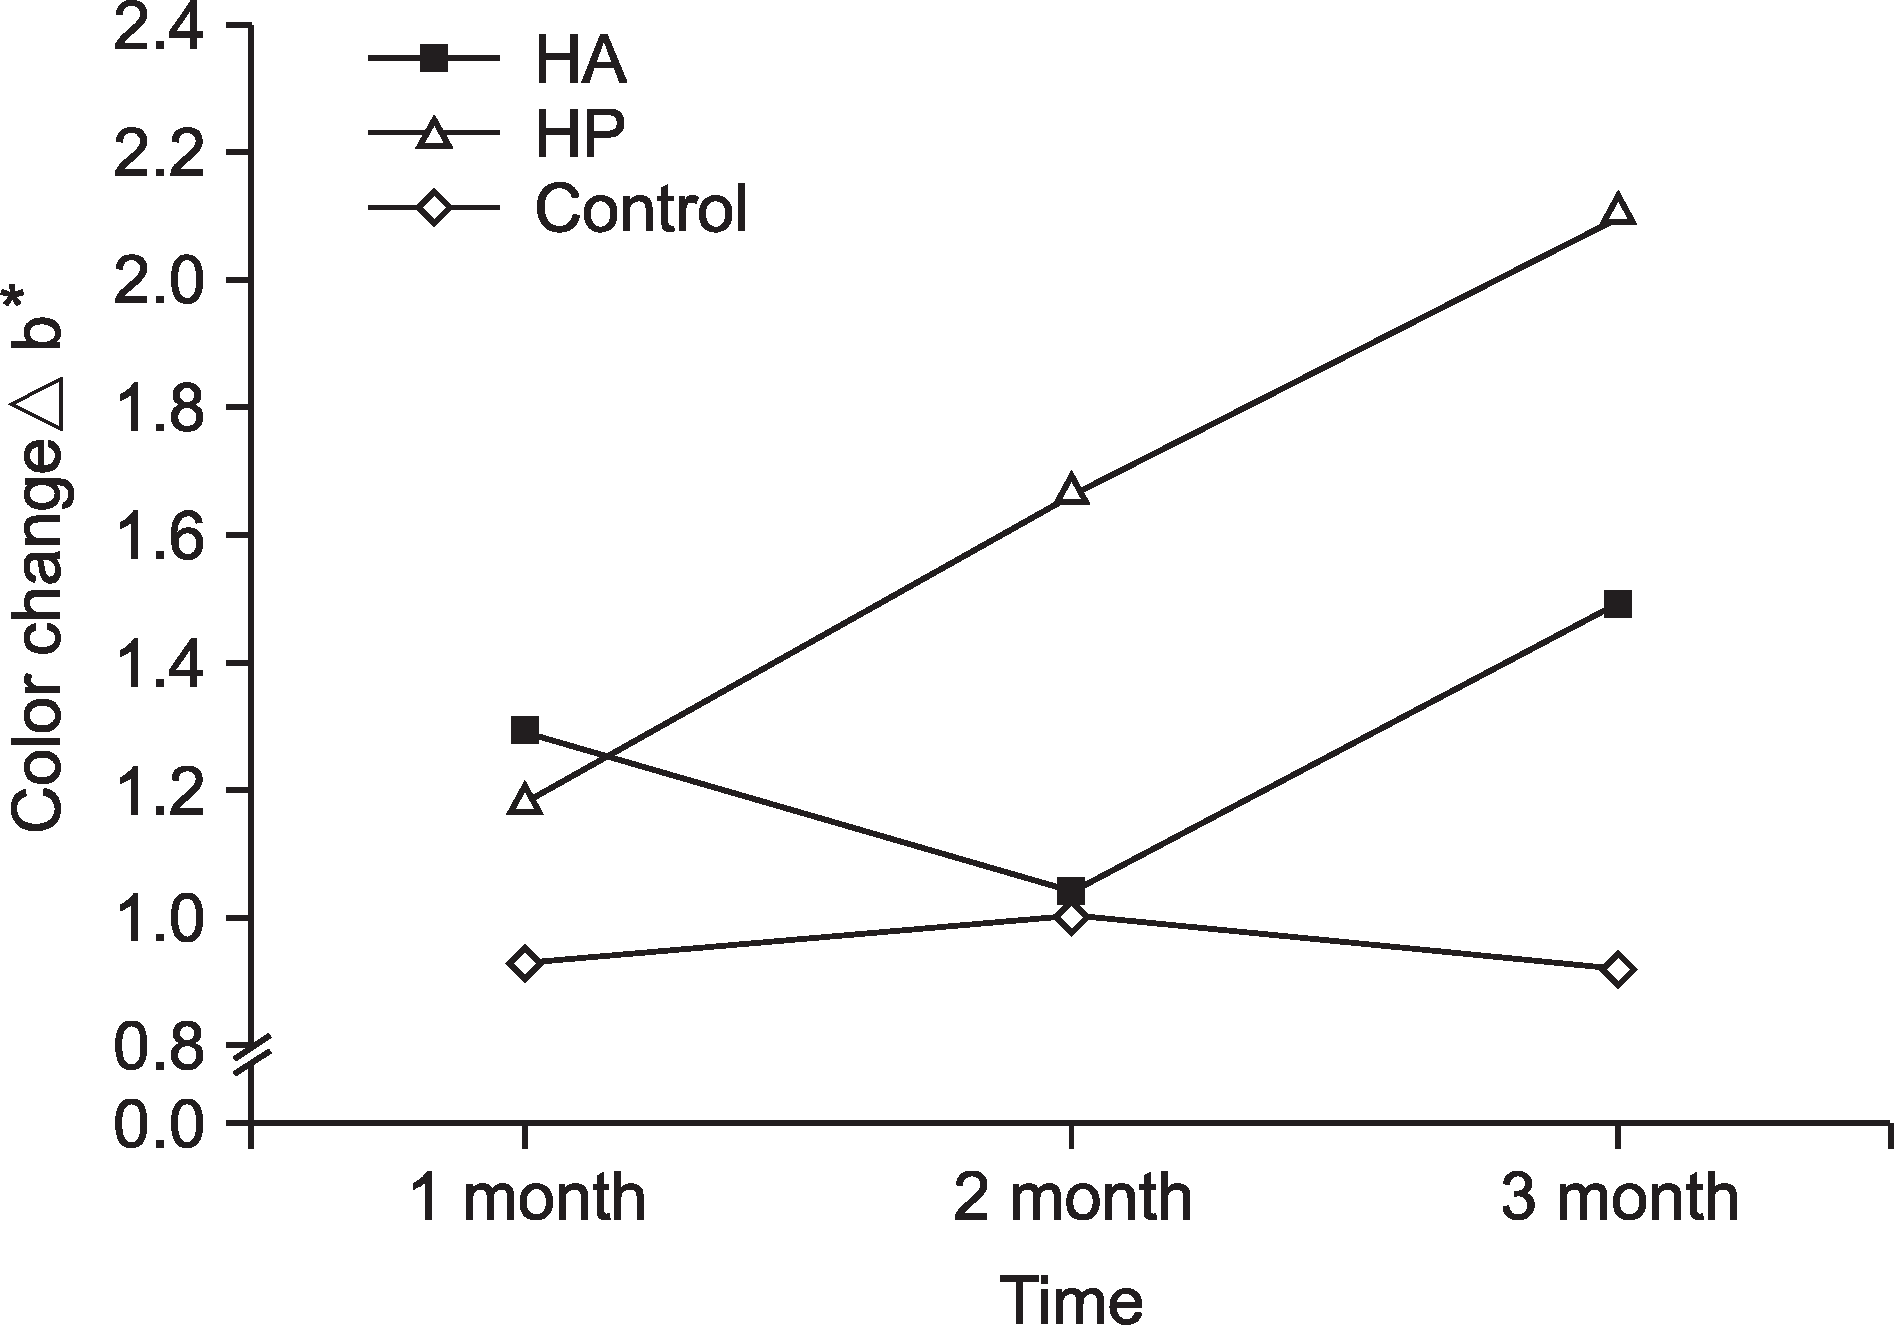
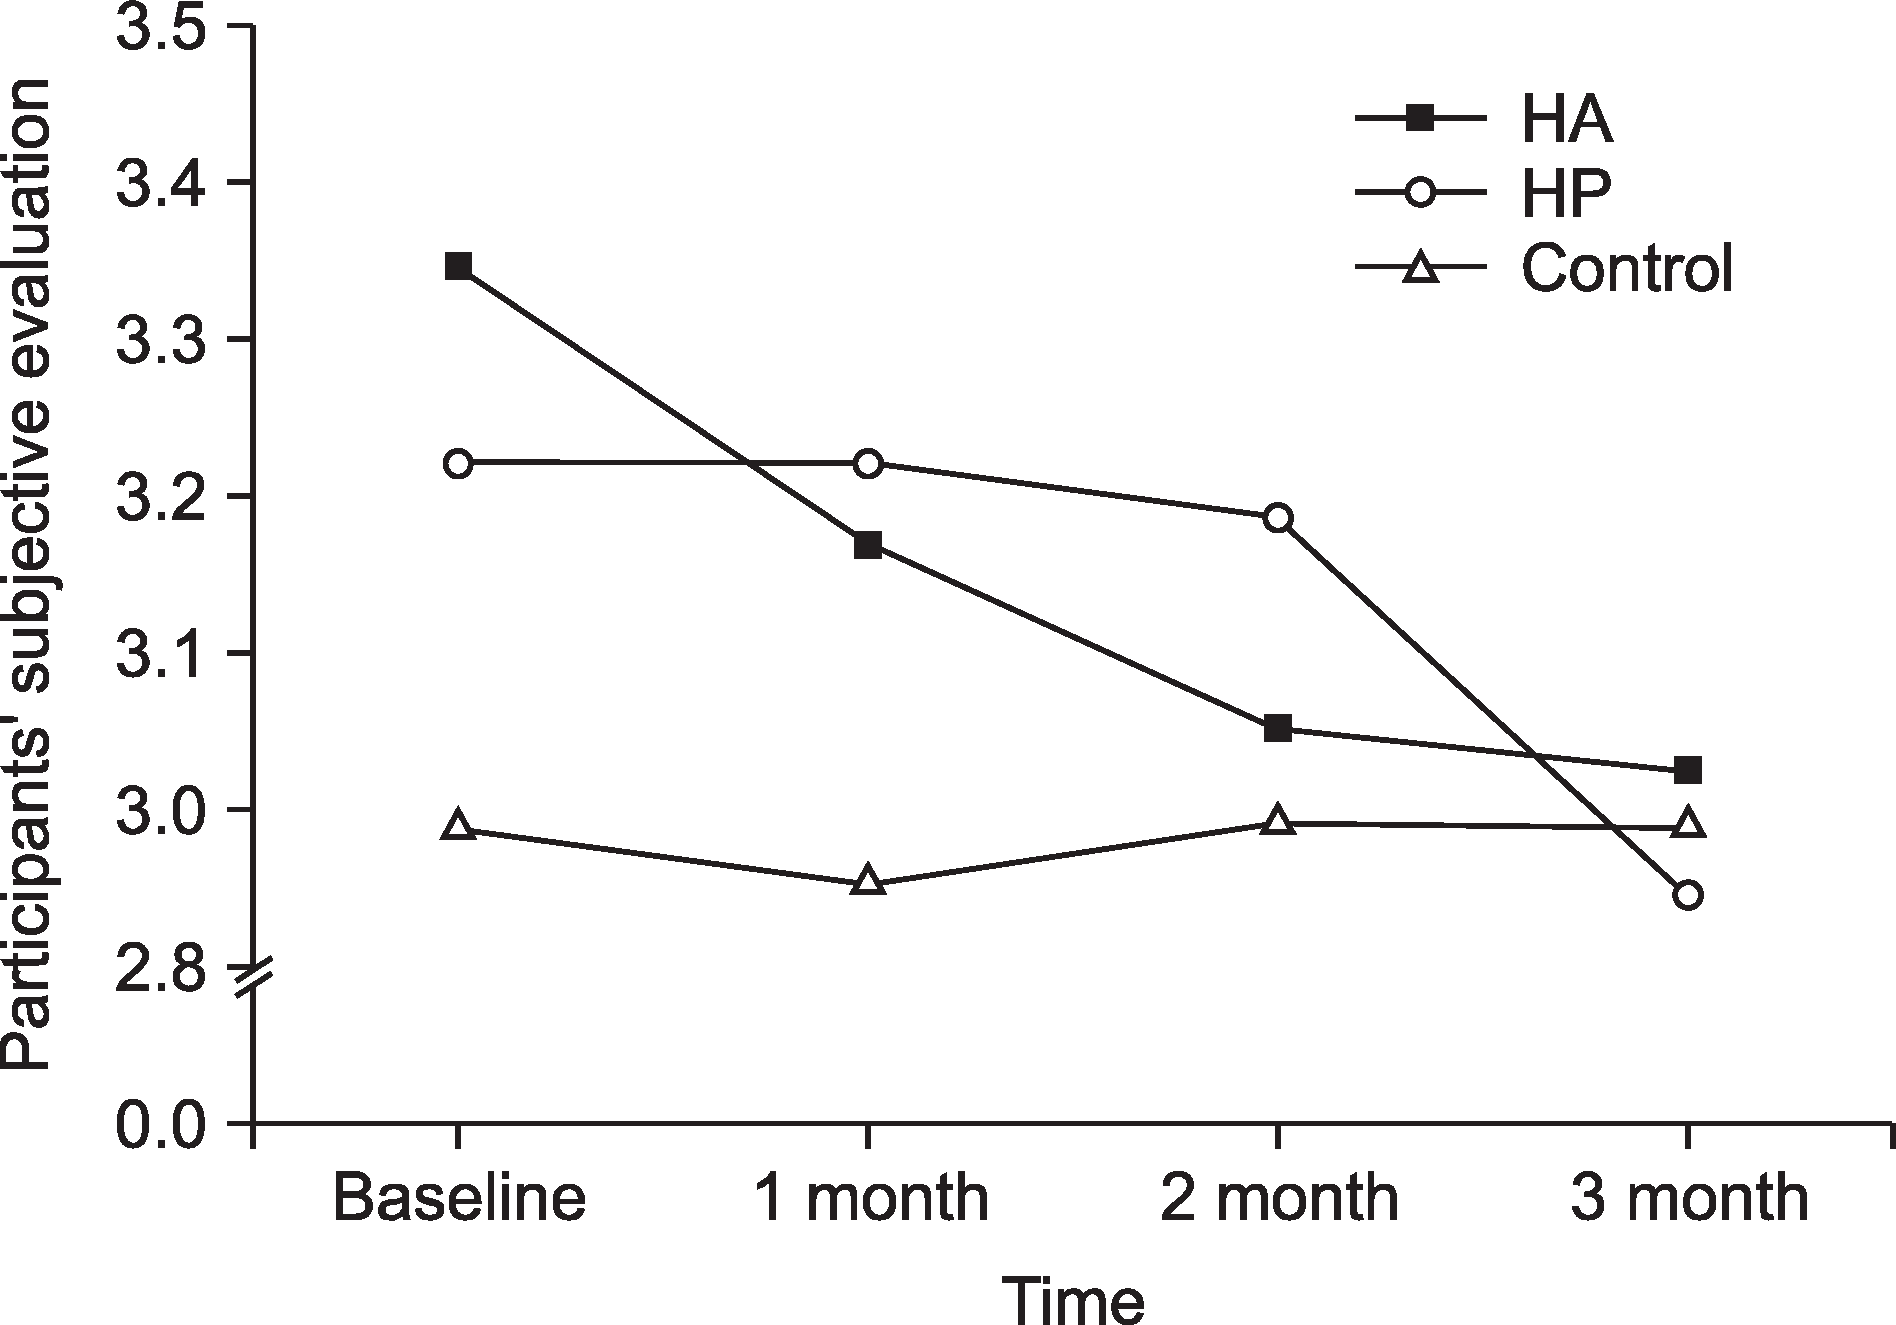
According to the CIELAB system, a significantly greater color change (Δb*) was observed in the hydrogen peroxide group (2.10±1.54) than in the hydroxyapatite (1.50±1.09) and control (0.94± 0.75) groups after 3 months of toothpaste usage (P<0.002). The ΔE*color change was not statistically significant among the 3 groups at each time point (P>0.05). The subjective evaluation results of the hydroxyapatite (P=0.023) and hydrogen peroxide (P=0.047) groups were statistically significant at each time point.
Go to : 
References
1. Kwon SR, Ko SH, Goldstein RE. Color atlas of tooth whitening. Seoul: DaehanNarae Publishing;2006. p. 195–202.
2. Snow SR. Esthetic smile analysis of maxillary anterior tooth width: The golden percentage. J Esthet Dent. 1999; 11:177–184.

3. Haywood VB, Robinson FG. Vital tooth bleaching with nightguard vital bleaching. Curr Opin Cosmet Dent. 1997; 4:45–52.
4. Yoon HY, Goo HJ, Kim KH, Song KB. Comparison of tooth bleaching effect between low concentration hydrogen peroxide with plasma arc and only high concentration hydrogen peroxide. J Korea Res Soc Dent Mater. 2010; 37:21–28.
6. Kang SJ, Kwon YH, Park JB, Herr Y, Chung JH. The effects of hydroxyapatite toothpaste on tooth hypersensitivity. J Korean Acad Periodontol. 2009; 39:9–16.

7. Hing KA, Best SM, Tanner KE, Bonfield W, Revell PA. Mediation of bone ingrowth in porous hydroxyapatite bone graft substitutes. J Biomed Mater Res A. 2004; 68:187–200.

8. Tredwin C, Naik S, Lewis NJ, Scully C. Hydrogen peroxide tooth-whitening (bleaching) products: review of adverse effects and safety issues. Br Dent J. 2006; 200:371–376.

9. Choi CH, Kim KN, Kwon HK. Effect of whitening dentifrice containing calcium peroxide on oral environmental change: a clinical trial. J Korea Res Soc Dent Mater. 2002; 29:243–251.
10. Dias Ribeiro AP, Sacono NT, Lessa FCR, Nogueira I, Coldebella CR, Hebling J, et al. Cytotoxic effect of a 35% hydrogen peroxide bleaching gel on odontoblast-like MDPC-23 cells. Oral Surg Oral Med Oral Pathol Oral Radiol Endod. 2009; 108:458–464.

11. Williams DF, Schmitt W. Chemistry and technology of the cosmetics and toiletries industry. New York: Springer;1996. p. 235–361.
12. Raoufi S, Birkhed D. Effect of whitening toothpastes on tooth staining using two different colour measuring devices-a 12 week clinical trial. Int Dent J. 2010; 60:419–423.
13. White DJ. Development of an improved whitening dentifrice based upon “stain-specific soft silica” technology. J Clin Dent. 2001; 12:25–29.
14. Ministry of Health and Welfare. 2012 Korean National Oral Health Survey. Seoul: Ministry of Health and Welfare;2013. p. 204–229.
15. Pease PL, Allen J. A new test for screening color vision: concur- rent validity and utility. Am J Optom Physiol Opt. 1988; 65:729–738.
16. Yoon YS. Oral health and eating habit attributes relating to the maxillary anterior teeth color by using the ShadeEye NCC. J Dent Hyg Sci. 2012; 12:348–358.
17. Lenhard M. Assessing tooth color change after repeated bleaching in vitro with a 10 percent carbamide peroxide gel. J Am Dent Assoc. 1996; 127:1618–1624.
18. Sproull RC. Color matching in dentistry. part II. practical applications of the organization of color. J Prosthet Dent. 1973; 29:556–566.

19. Reinhardt JW, Eivins SE, Swift EJ, Denehy GE. A clinical study of nightguard vital bleaching. Quintessence Int. 1993; 24:379–384.
20. Wewers ME, Lowe NK. A critical review of visual analogue scales in the measurement of clinical phenomena. Res Nurs Health. 1990; 13:227–236.

21. Jung HJ. The association of smoking and fat distribution among Korean male adults [master’s thesis]. Seoul: Ewha Womans Uni-versity;2006. [Korean].
22. Moraes RR, Marimon JLM, Schneider LFJ, Sobrinho LC, Cama-cho GB, Bueno M. Carbamide peroxide bleaching agents: effects on surface roughness of enamel, composite and porcelain. Clin Oral Investig. 2006; 10:23–28.

23. Ahn KS. In vivo test of tooth whitening toothpastes including 0.375%, 0.75% H2O2 [master’s thesis]. Seoul: Kyunghee Univer-sity;2008. [Korean].
24. Nam SH, Choi JO. Efficacy and evaluation of tooth stain with various pH beverages following whitening dentifrice. J Dent Hyg Sci. 2013; 13:191–196.
25. Ghavamnasiri M, Bidar M, Habibi A, Sadegh M. The effect of 16 percent carbamide peroxide on enamel staining susceptibility. J Calif Dent Assoc. 2006; 34:873–876.
26. Kim EH, Lee DH, Oh HS. Effects of the repetitive tasting of different blending types of coffee on teeth stain during home bleaching. J Dent Hyg Sci. 2010; 10:955–954.
27. Gross MD, Moser JB. A colorimetric study of coffee and tea staining of four composite resins. J Oral Rehabil. 1977; 4:311–322.

28. Gerlach RW, Barker ML, Tucker HL. Clinical response of three whitening products having different peroxide delivery: comparison of tray, paint-on gel, and dentifrice. J Clin Dent. 2003; 15:112–117.
29. Yudhira R, Peumans M, Barker ML, Gerlach RW. Clinical trial of tooth whitening with 6% hydrogen peroxide whitening strips and two whitening dentifrices. Am J Dent. 2007; 20:32A–36A.
30. Kleber CJ, Putt MS, Nelson BJ. In vitro tooth whitening by a sodium bicarbonate/peroxide dentifrice. J Clin Dent. 1998; 9:16–21.
Go to : 
Table 1.
Toothpaste primary ingredients
Table 2.
Examinator's Cohen's Kappa index
| Examinator | Cohen’s Kappa index |
|---|---|
| A | 0.879 |
| B | 0.909 |
| C | 0.748 |
| D | 0.894 |
| E | 0.814 |
| F | 0.829 |
| G | 0.854 |
Table 3.
Participants' demographic characteristics and dietary habit (N (%))
Table 4.
Color changes ΔE* of total tooth among the group at each time
| After 1 mon | After 2 mon | After 3 mon | P-value* | |
|---|---|---|---|---|
| #13 | ||||
| HA | 1.97±1.43 | 3.62±2.44 | 2.00±1.26 | <0.001 |
| HP | 1.56±1.06 | 3.19±2.24 | 2.01±1.46 | |
| Control | 1.80±1.55 | 3.05±2.66 | 2.01±1.71 | |
| P-value† | 0.535 | 0.652 | 0.999 | |
| #12 | ||||
| HA | 2.15±1.39 | 2.86±1.82 | 2.47±2.01 | 0.085 |
| HP | 1.85±1.53 | 2.72±1.73 | 2.16±1.60 | |
| Control | 2.04±3.55 | 2.65±2.07 | 2.02±1.30 | |
| P-value† | 0.895 | 0.912 | 0.569 | |
| #11 | ||||
| HA | 2.04±1.19 | 2.41±1.66 | 1.96±1.59 | 0.009 |
| HP | 1.74±1.14 | 2.58±1.76 | 2.20±1.43 | |
| Control | 1.47±1.26 | 2.46±1.85 | 1.88±1.05 | |
| P-value† | 0.201 | 0.935 | 0.680 | |
| #21 | ||||
| HA | 1.75±1.13 | 2.12±1.61 | 1.86±1.32 | 0.037 |
| HP | 1.47±1.08 | 2.45±1.95 | 2.00±1.78 | |
| Control | 1.58±1.17 | 2.06±1.55 | 1.79±1.00 | |
| P-value† | 0.651 | 0.661 | 0.843 | |
| #22 | ||||
| HA | 1.64±1.24 | 2.02±1.53 | 1.70±1.22 | 0.045 |
| HP | 1.51±1.24 | 2.11±1.78 | 1.92±1.21 | |
| Control | 1.21±1.01 | 1.79±1.57 | 1.68±1.28 | |
| P-value† | 0.359 | 0.757 | 0.730 | |
| #23 | ||||
| HA | 1.38±1.07 | 1.78±1.63 | 1.71±1.40 | 0.053 |
| HP | 1.35±0.98 | 2.27±1.80 | 1.75±1.08 | |
| Control | 1.62±1.23 | 1.84±1.56 | 1.78±1.01 | |
| P-value† | 0.606 | 0.503 | 0.978 | |
| Total | ||||
| HA | 1.66±0.92 | 2.31±1.50 | 1.72±1.31 | 0.006 |
| HP | 1.32±0.99 | 2.10±1.86 | 1.78±1.17 | |
| Control | 1.29±1.12 | 1.89±1.56 | 1.53±0.93 | |
| P-value† | 0.304 | 0.608 | 0.712 |
Table 5.
Total tooth of Vita classical shade guide
| Baseline | After 1 mon | After 2 mon | After 3 mon | P-value* | |
|---|---|---|---|---|---|
| HA | 8.06±1.39 | 8.04±1.39 | 7.89±1.16 | 7.87±1.33 | 0.097 |
| HP | 6.98±2.10 | 7.38±1.79 | 7.20±1.85 | 7.21±1.86 | |
| Control | 7.93±2.11 | 7.83±1.96 | 7.92±2.04 | 7.86±1.96 | |
| P-value† | 0.110 | 0.464 | 0.403 | 0.622 |


 PDF
PDF ePub
ePub Citation
 Print
Print


 XML Download