Abstract
Objectives
This study aims to investigate the trends and progress in oral health status, dental service items, and fees among children receiving community-based registered dental care over a three-year period.
Methods
The study subjects were selected from nine community children centers in J district of S city, in the Korean province of Gyeonggi-do. The sample included 222 children who had received care in 2011 and 2012, and 205 children, in 2013. The dependent variables were oral health status (df index and decayed-missing-filled teeth index), dental service items (total number of visits and dental fillings by type), and dental fees (total fees, National Health Insurance [NHI] coverage, and NHI non-coverage), analyzed by year. The percentages of dental caries and dental service items were tested using chi-square analysis, and the mean of each variable, including dental fees, was tested using the Kruskal-Wallis method, owing to non-parametric distribution.
Results
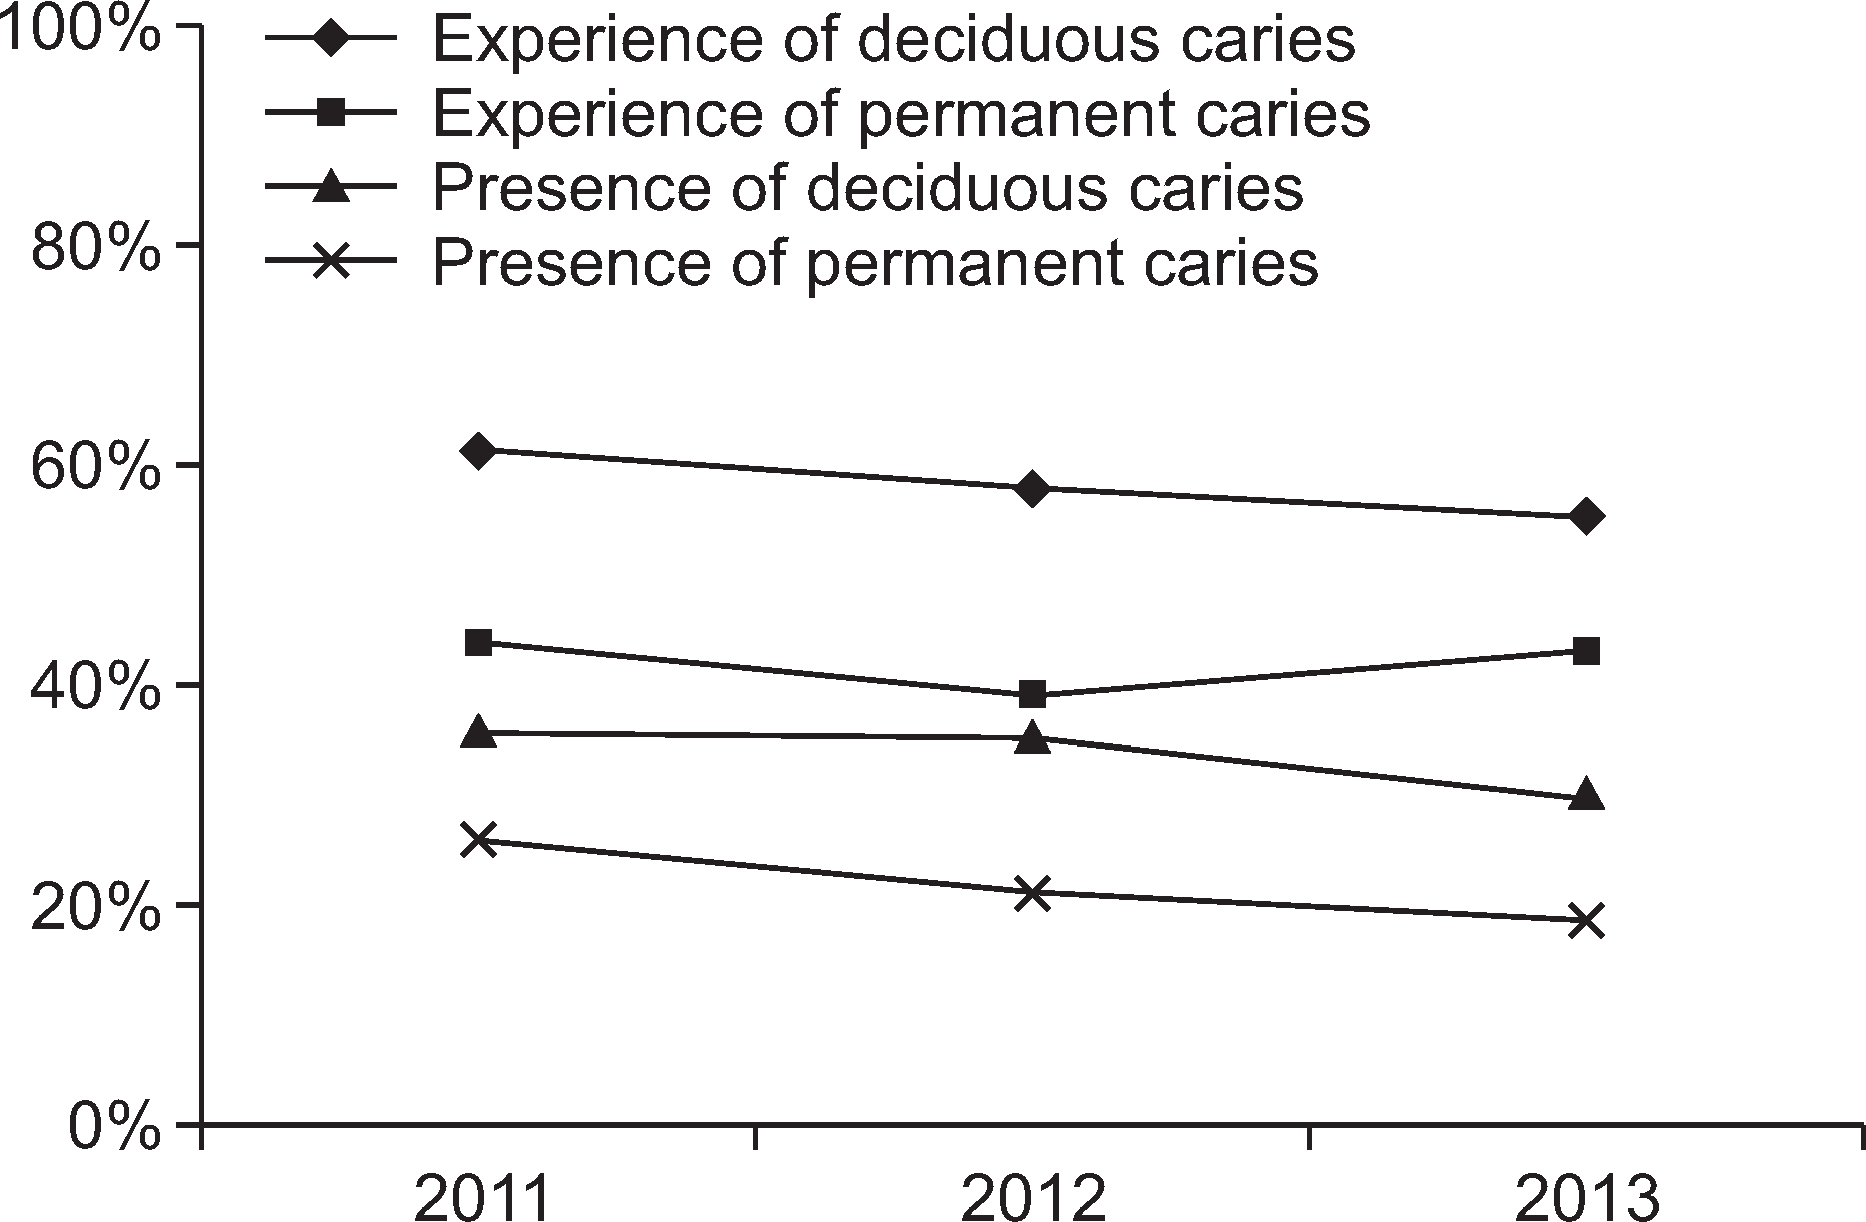
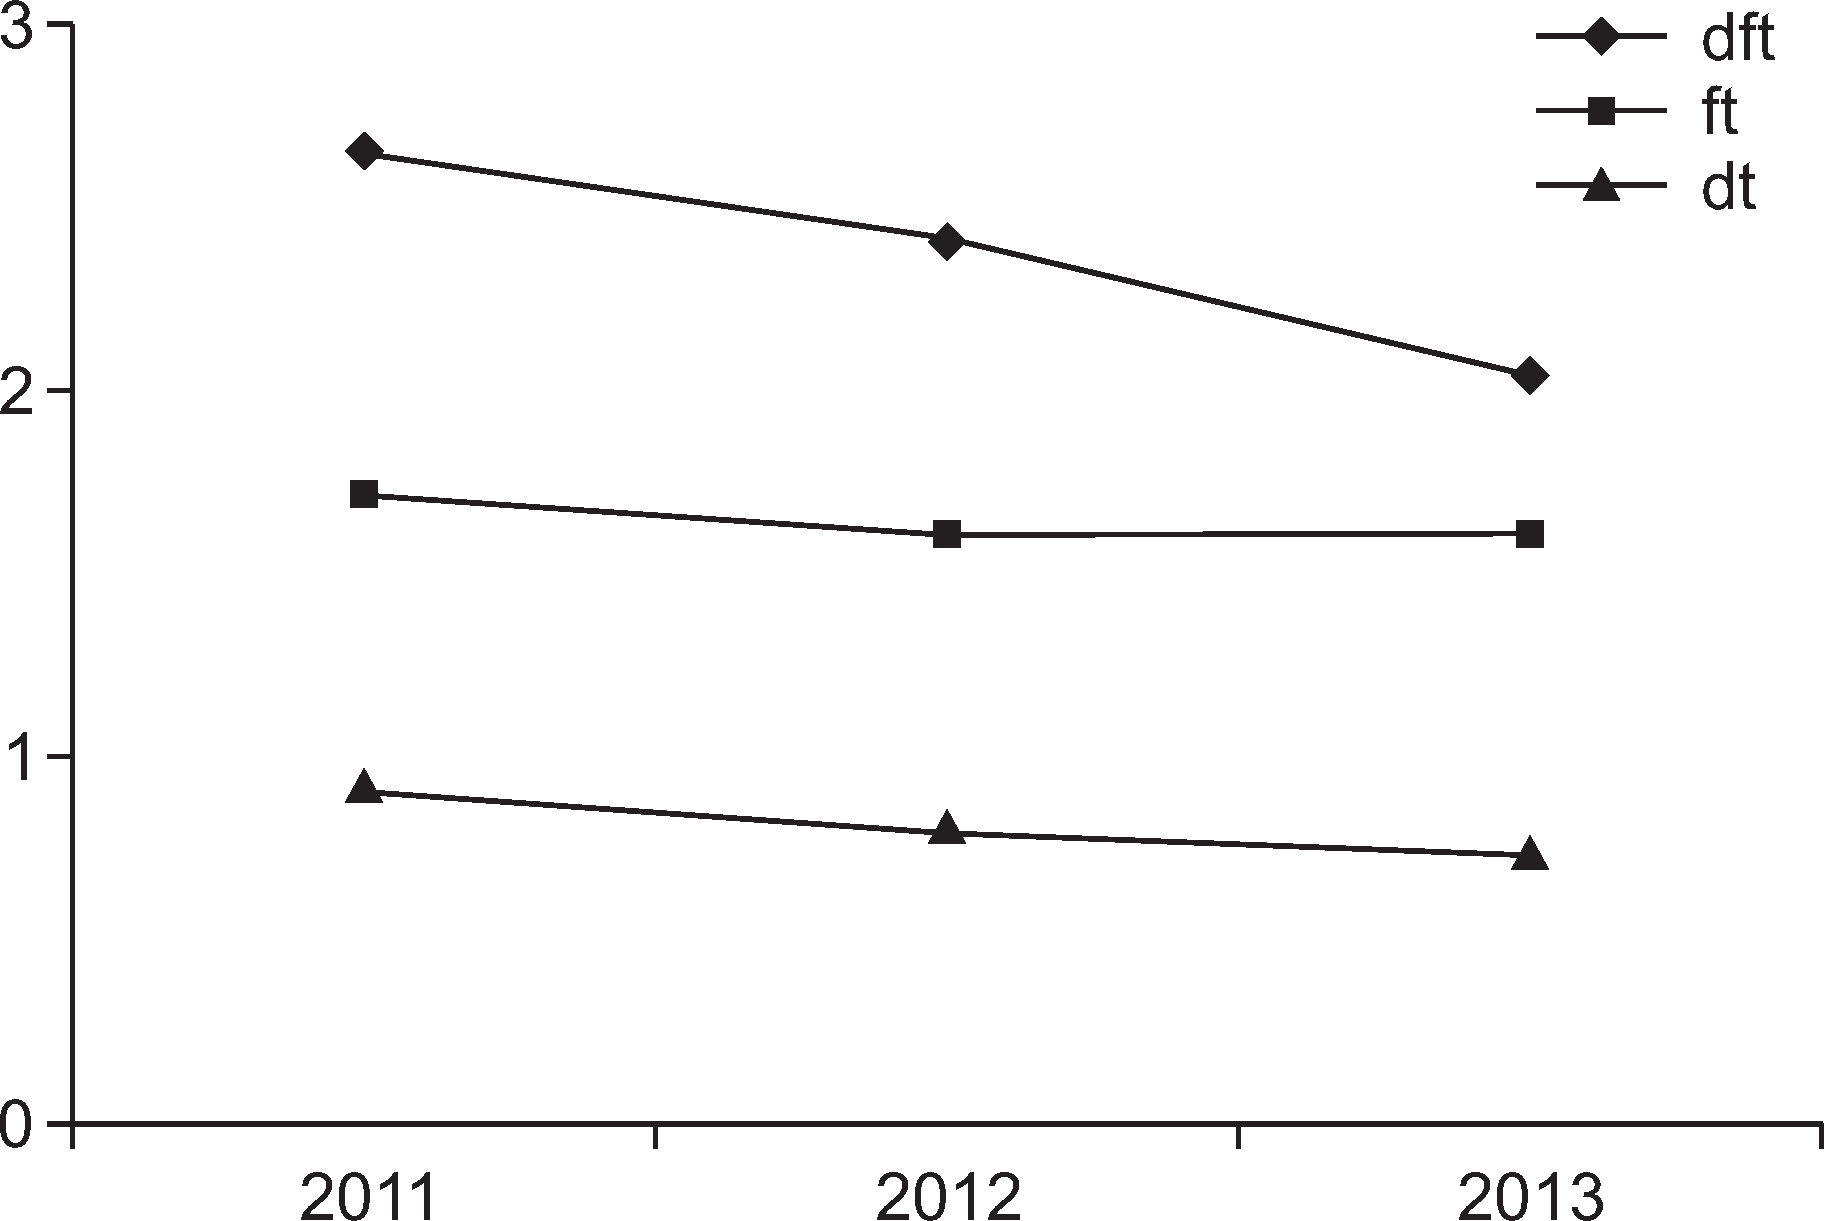
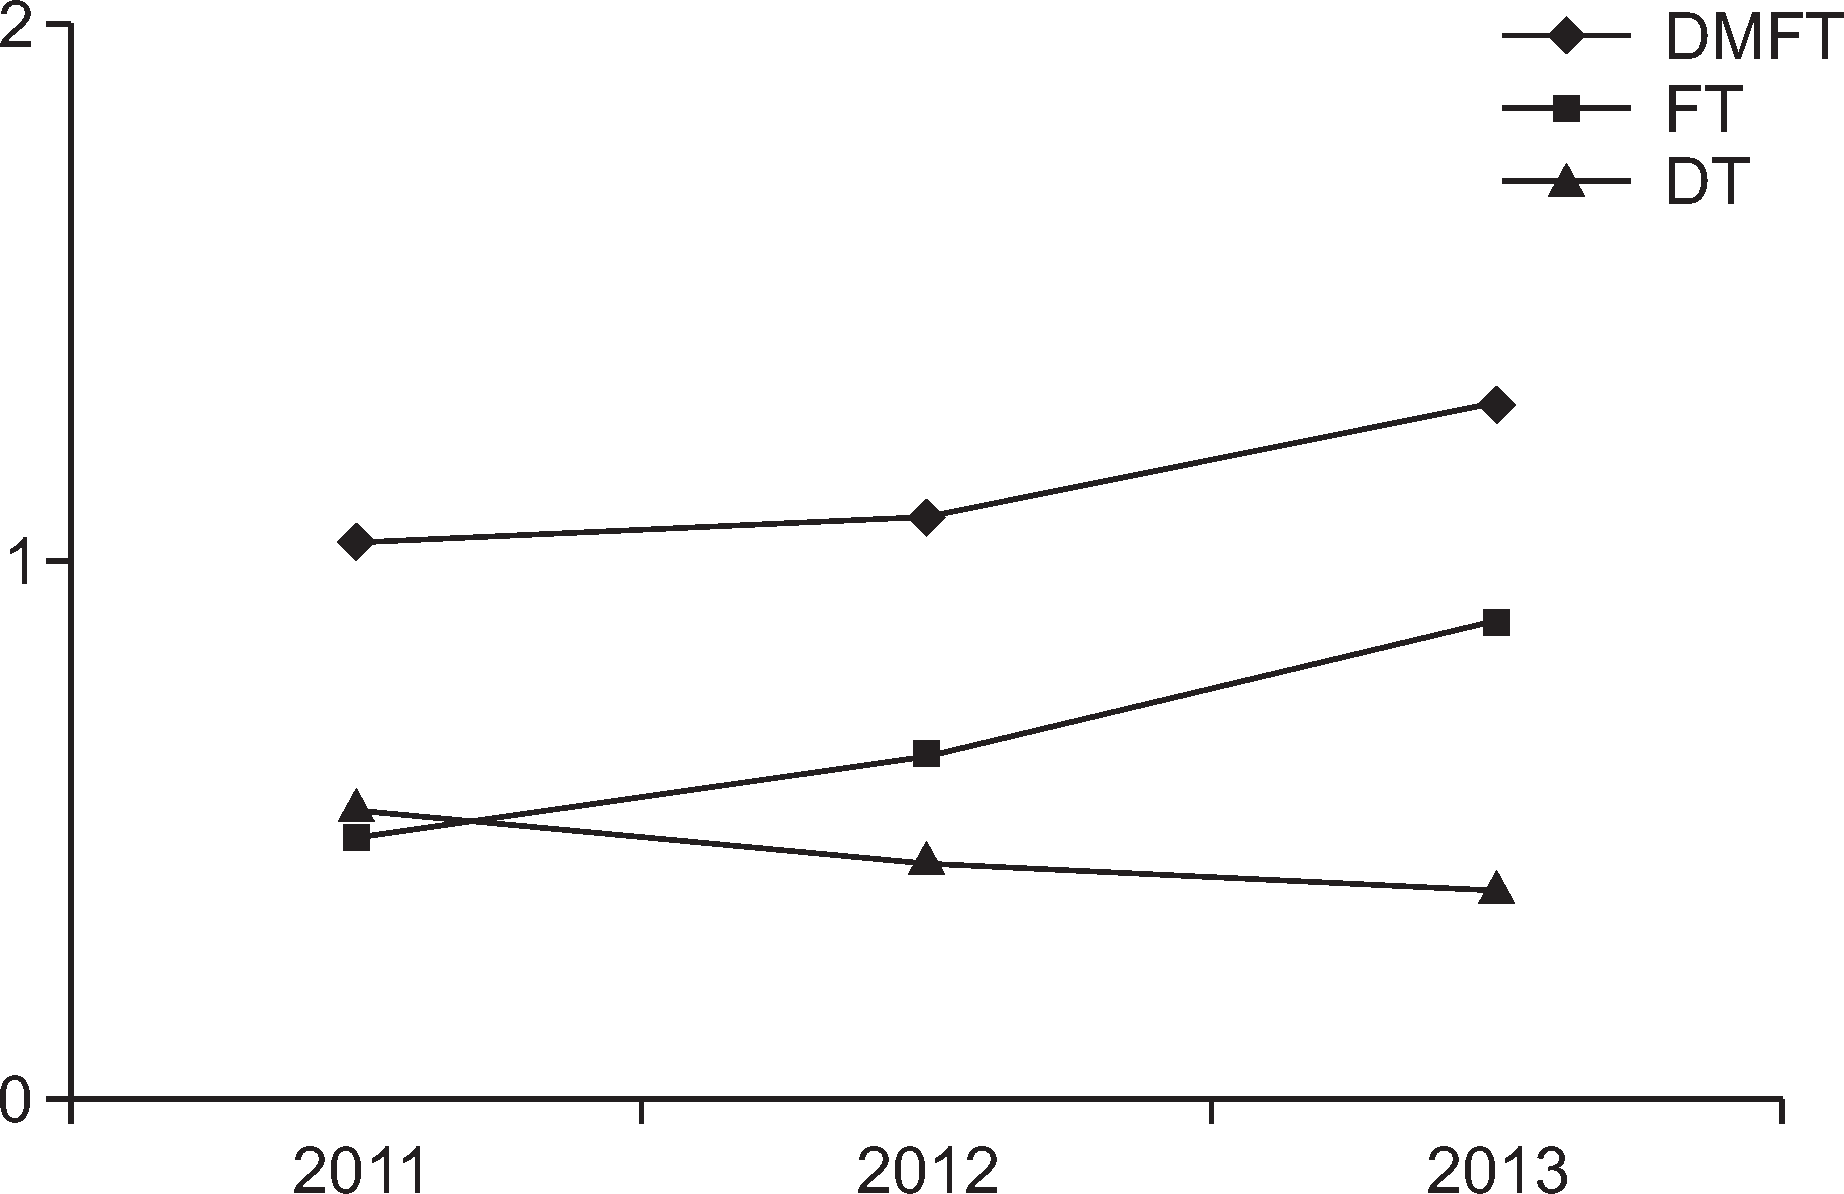
There was a statistically significant decrease in the rate of dental clinic visits for treatment, and an increase in the mean numbers of filled teeth and sealants performed per year. The rate and number of dental fillings increased steadily, whereas the services for oral health promotion and prevention were decreased. The number of dental visits and the total fees decreased steeply, especially within the second half of the last measured year: around 90,000 earned within that time, compared to 170,000 earned during the first year.
Conclusions
Dental clinic visits should be encouraged on a regular basis for oral health promotion and prevention by both patients and providers using capitation payment systems, for example. It is necessary to monitor and provide training for all related staff by developing a manual for oral health examination and treatment, adjusted for the registered dental system. Policy measures addressing the needs of vulnerable social groups are needed more than ever. Therefore, it is important to provide as much targeted support and training to the registered dental system as possible.
Go to : 
References
1. Yonhapnews. The negotiation almost reach a batch settlement in U. S. Congress just before the fiscal cliff [Internet]. [cited 2014 Oct 01]. Avaiable from:. http://news.naver.com/main/read.nhn?mode=LSD&mid=sec&sid1=104&oid=001&aid=0005996966.
2. The Hankyoreh. Urging the government to spend the plus for the essential health coverage [Internet]. [cited 2014 Oct 01]. Avaiable from:. http://www.hani.co.kr/arti/opinion/because/316169.html.
3. The Hankyoreh. The government cut down the ’cancer support budget’ even though they ensured that 4 severe disease support would be extended [Internet]. [cited 2014 Oct 01]. Avaiable from:. http://www.hani.co.kr/arti/society/health/657740.html.
4. Jung H-S. Korean National Health Accounts and Total Health Expenditure in 2012. Seoul: Ministry of Health and Wel-fare;2014. p. 294–295.
5. Organisation for Economic Co-operation and Development. Health at a glance 2013: OECD Indicators. Paris: OECD Publish-ing;2013. p. 146–147.
6. Kim C-S, Ryu J-I, Shin B-M, Jun J-E, Choi Y-K, Choi Y-C, et al. The baseline study for private dental insurance in several countries. Seoul: Research Institute for Dental Care Policy;2013. p. 37–41.
7. Seoul Metropolitan Government. The guide for registered dentists of students and vulerable children. Seoul: Seoul Metropolitan Government;2012. p. 1–47.
8. Seoul Metropolitan Government. The guide for registered dentists of students and vulerable children. Seoul: Seoul Metropolitan Government;2013. p. 1–70.
9. Seoul Metropolitan Government. The guide for registered dentists of students and vulerable children. Seoul: Seoul Metropolitan Government;2014. p. 1–76.
10. Ryu J-I, Jung S-H, Bae S-M, Kim A-H, Kim Y-J, Jun Y-H, et al. The current status and developmental plan for registered dentists of students and vulerable children. Seoul: Seoul Metropolitan Government;2014. p. 76–77.
11. Jung S-H, Shin B-M, Park D-Y, Ma D-S. One-year outcomes and reasons for dropout in participants of the continuous dental care program of the Community Child Center in Gangnueng city. J Korean Acad Oral Health. 2013; 37:110–116.

12. Shin S-J, Jang J-Y, Kim C-H. The Oral Health Behaviors for Children and Teachers by Teacher-Supervised Toothbrushing in Community Child Center. J Dent Hyg Sci. 2012; 12:572–582.
13. Shin S-J, Ryu D-Y, Bae S-M, Choi Y-K. Evaluation on the Oral Health Promotion Program Effect from some Part of Community Child Center. J Dent Hyg Sci. 2011; 11:163–171.
14. Yum J-H, Kim H-J, Kwon M-H, Shin S-J. The Effect in Oral Health Promotion Program Based on Community Networking for Elementary School Students from Community Child Center. J Dent Hyg Sci. 2014; 14:214–222.
15. Kim J-H, Kim H-J, Kim H-J, Park J-H, Bang W-R, Shin H-J, et al. A Study on Needs of Teachers in Community Children’s Centers for Oral Health Education in Incheon. J Dent Hyg Sci. 2011; 11:505–514.
16. Ryu J-I, Kim Y-J, Park J-H, Kim H-J, Kim J-A, Jung J-I, et al. An analysis of dental service items and dental fees in registered dentists. J Korean Acad Oral Health. 2013; 37:31–40.

17. Ryu J-I, Kim Y-J, Park J-H, Kim H-J, Kim J-A, Jung J-I, et al. Evaluation of the validity of the oral health risk assessment model based on the care pathway to children. J Korean Acad Oral Health. 2011; 35:206–215.
18. Jung S-H, Kim Y-N, Kim Y-J, Kim C-S, Ryu J-I, Jun Y-H. A study for registered dentist of Child and Adolescent (I). Seoul: Association of Dentists for Healthy Society;2010. p. 1–71.
19. Ettelt S, Nolte E, Mays N. Coverage of publicly-funded dental services-an international perspective. London: Department of Health, London School of Hygiene and Tropical Medi-cine;2009. p. 1–44.
20. Green A. Option appraisal and evaluation. In: Green A. An introduction to health planning for developing health systems. 3rd ed. Oxford; New York: Oxford University Press;2007. p. 247–276.
21. The Health Communication Unit. Evaluating Health Promotion Programs. Toronto: The Health Communication Unit;2007. p. 35.
22. Brocklehurst P, Price J, Glenny AM, Tickle M, Birch S, Mertz E, et al. The effect of different methods of remuneration on the behaviour of primary care dentists. Cochrane Database Syst Rev. 2013; 11:CD009853.

23. Hollingsworth B. The measurement of efficiency and productivity of health care delivery. Health Econ. 2008; 17:1107–1128.

24. An Office of the administration for Children and Families. Office of Head Start [Internet]. [cited 2014 Aug 04]. Available from:. http://www.acf.hhs.gov/programs/ohs.
25. The Centers for Medicare and Medicaid Services. Dental Care for Medicaid and CHIP Enrollees [Internet]. [cited 2014 Aug 04]. Available from:. http://www.medicaid.gov/Medicaid-CHIP-Program-Information/By-Topics/Benefits/Dental-Care.html.
26. UK government. Sure Start Services [Internet]. [cited 2014 Aug 04]. Available from:. http://www.nidirect.gov.uk/sure-start-services.
27. Department of Health. Healthy Child Programme: Pregnancy and the First 5 Years of Life. 2009.
28. UK government. NHS dental services [Internet]. [cited 2014 Aug 04]. Available from:. http://www.nhs.uk/NHSEngland/AboutNHSservices/dentists/Pages/find-an-NHS-dentist.aspx.
29. Department of health. Declaration on child oral health [Internet]. 2009. [cited 2014 Aug 04]. Available from:. http://webarchive.na-tionalarchives.gov.uk/+/www.dh.gov.uk/en/Aboutus/Chiefprofes-sionalofficers/Chiefdentalofficer/DH_4110049.
30. Department of Human Services, Australian Government. Child Dental Benefit Schedule [Internet]. [cited 2014 Aug 04]. Available from:. http://www.medicareaustralia.gov.au/forms/114631.pdf.
Go to : 
Table 1.
Distribution of total study sample by demographic information
Table 2.
The percentage of the children with the following oral health status and behavior
Table 3.
The mean comparison of the oral health status and behavior by year
Table 4.
The percentage of children with oral health service by types
Table 5.
Mean comparison of total visit and oral health service by year
Table 6.
Mean comparison of dental treatment fees (unit=won) by year


 PDF
PDF ePub
ePub Citation
 Print
Print


 XML Download