Journal List > J Korean Acad Oral Health > v.37(2) > 1057593

Woo, You, Kim, Kim, Kim, and Jeong: Risk indicators of periodontal disease in Korean adults

Abstract

Objectives

The purpose of this study was to evaluate the risk indicators of periodontal disease in a representative sample of Korean adults aged between 18 and 44 years.

Methods

Data of 6,485 adults were derived from the Fourth Korean National Health and Nutrition Examination Survey, which was conducted from 2007 to 2009. Demographic, socioeconomic, and oral health-related behavioral data were collected as independent variables. The Community Periodontal Index (CPI) was used as a dependent variable. The chi-square test and logistic regression analysis were performed to identify the relationship between the CPI and the other variables.

Results

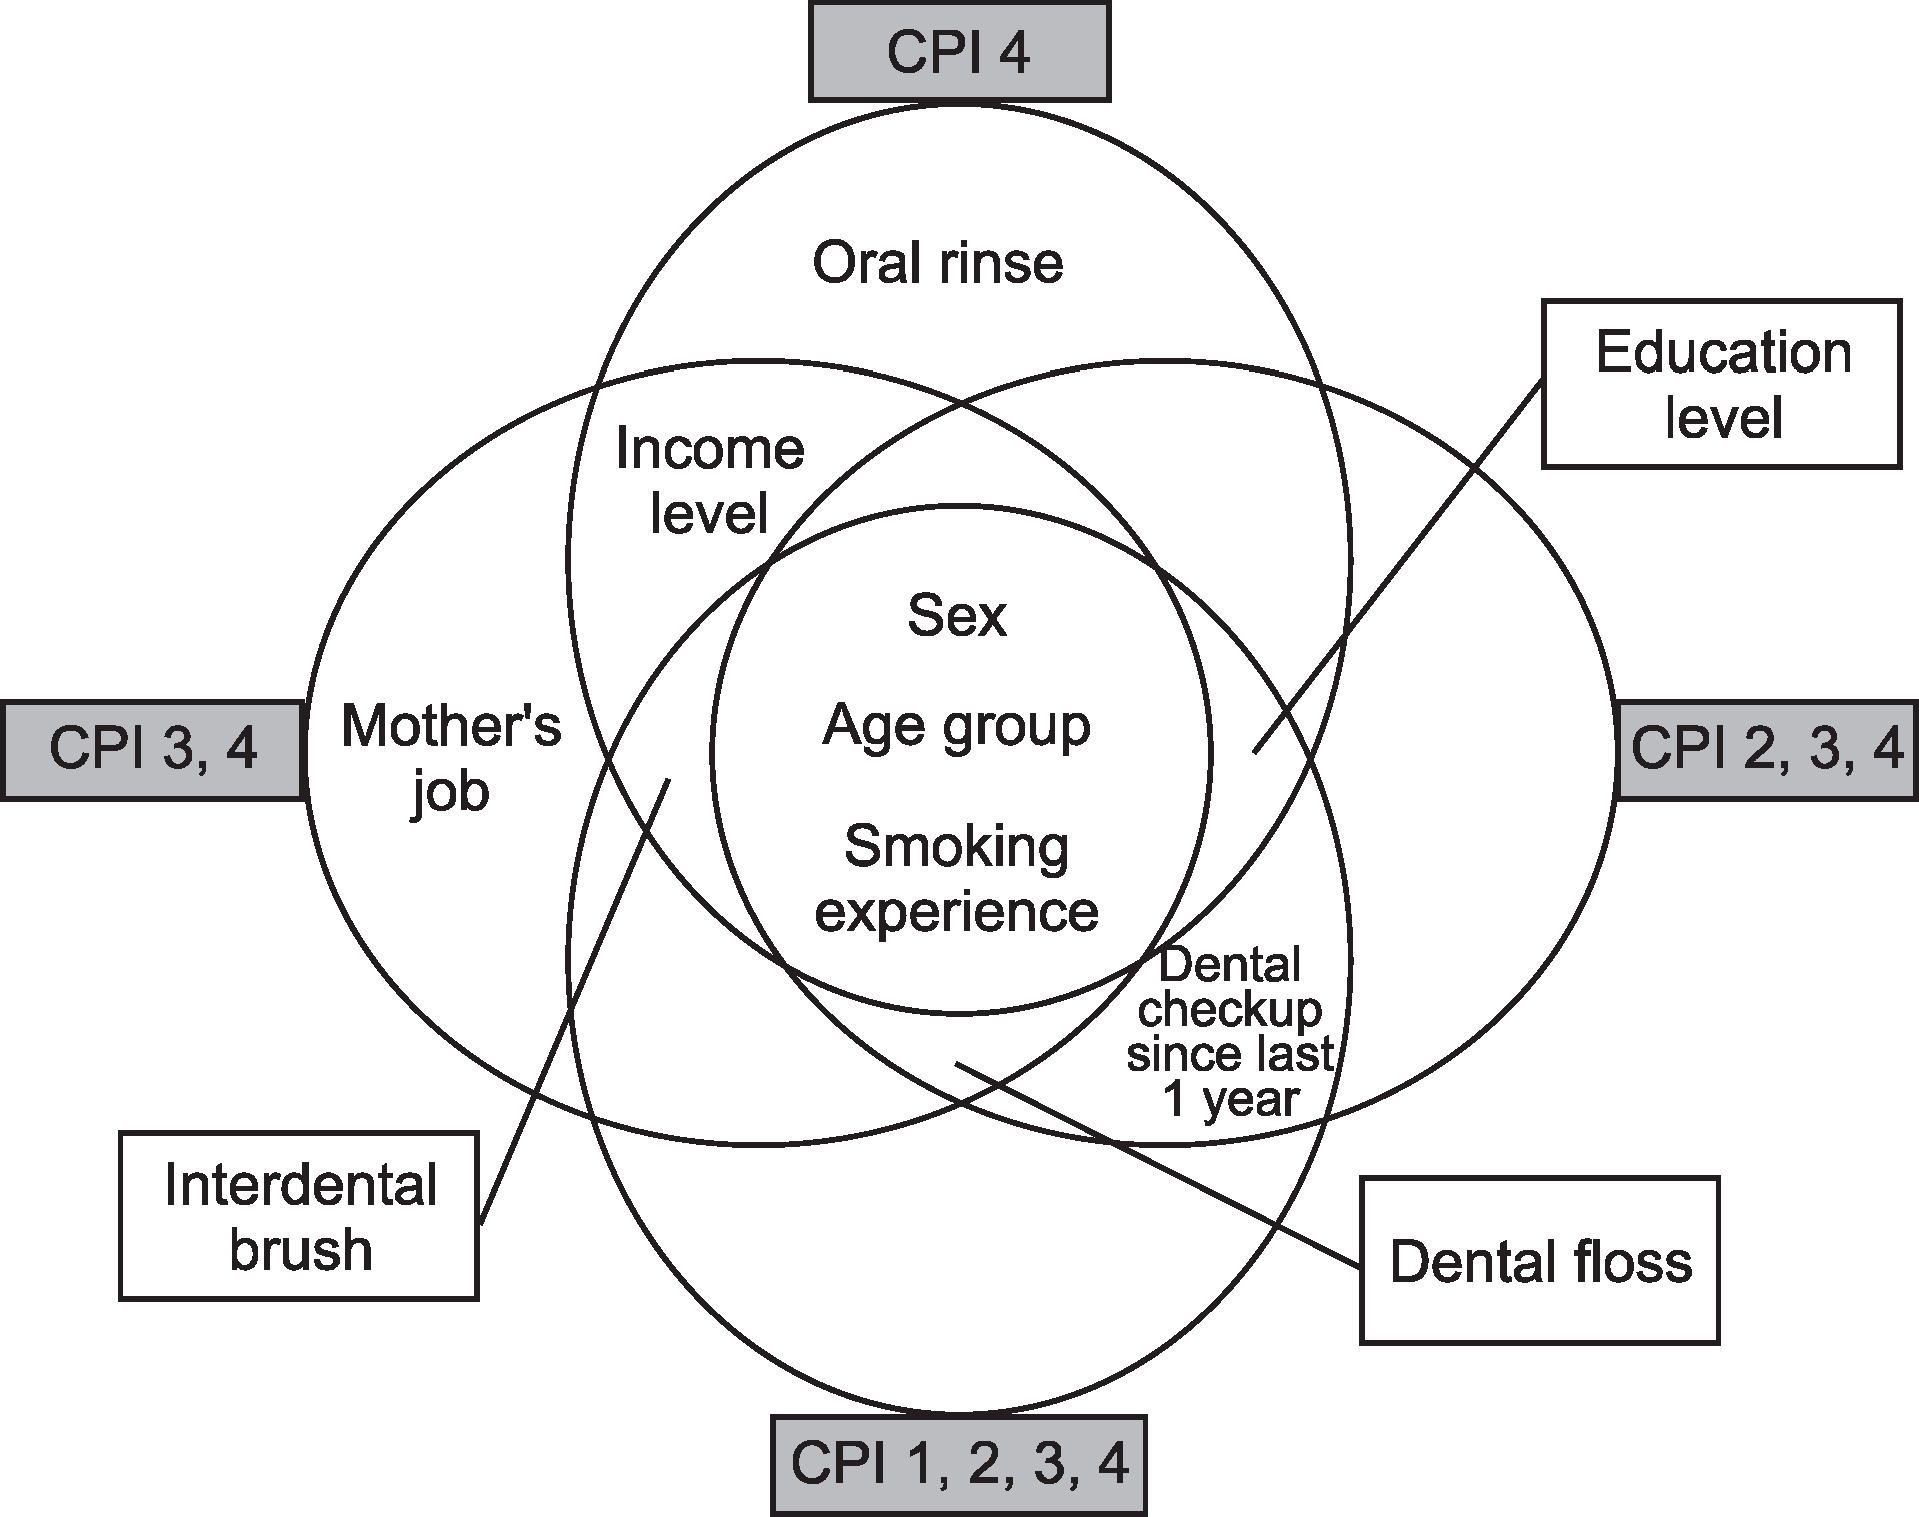
Multiple logistic regression analysis revealed that periodontal pocket formation (4 mm or more) was related with sex, age, and income level, irrespective of whether the mother engaged in economic activities in childhood, smoking experience, dental flossing, and use of interdental brushes. The subjects in the lowest-income quartile and those who were current smokers had a higher risk of pocket formation (odds ratios, 1.43 and 1.74, respectively) than those in the highest-income quartile and those who had no smoking experience, respectively.

Conclusions

This study confirmed various risk indicators of periodontal disease in Korean adults, using Korean national survey data. Smoking cessation, dental flossing, and efforts to decrease socioeconomic inequality should be encouraged to decrease the risk of periodontal disease.

References

1. Burt B. Position paper: epidemiology of periodontal diseases. J Periodontol. 2005; 76:1406–1419.
2. Ministry of Health and Welfare. 2000 Korean National Oral Health Survey Report. Seoul: Ministry of Health & Welfare;2000. p. 270.
3. Ministry of Health and Welfare. 2010 Korean National Oral Health Survey: III Summary Report. Seoul: Ministry of Health & Welfare;2010. p. 475.
4. US Centers for Disease Control and Prevention. The Third National Health and Nutrition Examination Survey, 1988-94 (NHANES III). Hyattsville: US Centers for Disease Control and Prevention;1997.
5. Health Insurance Review and Assessment Service, Nation Helath Insurance Corporation. 2010 National Health Insurance Statistical Yearbook. Seoul: Health Insurance Review & Assessment Service, Nation Health Insurance Corporation;2011. p. 556.
6. Jung SH. New Dental Public Health. 1st ed.Seoul: Komoonsa;2012. p. 132.
7. Ng SK, Leung WK. Oral health-related quality of life and periodontal status. Community Dent Oral Epidemiol. 2006; 34:114–122.
crossref
8. Saintrain MV, de Souza EH. Impact of tooth loss on the quality of life. Gerodontology. 2012; 29:632–636.
crossref
9. Greenstein G. Nonsurgical periodontal therapy in 2000: a literature review. J Am Dent Assoc. 2000; 131:1580–1592.
crossref
10. Sheiham A, Nicolau B. Evaluation of social and psychological factors in periodontal disease. Periodontol 2000. 2005; 39:118–131.
crossref
11. Petersen PE, Ogawa H. Strengthening the prevention of periodontal disease: the WHO approach. J Periodontol. 2005; 76:2187–2193.
crossref
12. Shin DK, Jeong SH, Park JH, Choi YH, Song KB. A study of oral health status and it’s related factors among disabled people in Korea. J Korean Acad Oral Health. 2007; 31:248–262.
13. Ha JE, Yeo BM, Roh HY, Paik DI, Bae KH. Periodontal condition and pathogens distribution of pregnant women. J Korean Acad Oral Health. 2010; 34:587–594.
14. Kim HD, Paik DM, Kho DH, Paik DI. Influence of cardiovascular related disease on periodontitis. J Korean Acad Oral Health. 2006; 30:46–55.
15. Lee SJ, Hong YM, Back JH, Nam YS. The relationship between metabolic syndrome and periodontal disease except patients with hypertension and type 2 diabetes mellitus in Korea. J Korean Acad Oral Health. 2009; 33:451–460.
16. Baek HJ, Choi YH, Lee SG, Song KB, Kwon HJ. The association of metabolic syndrome and periodontitis in Korean adult population. J Korean Acad Oral Health. 2010; 34:338–345.
17. Kim JW, Kwon HJ, Lee SG, Choi YH. The relationship between periodontal disease and the prevalence of cardiovascular diseases. J Korean Acad Oral Health. 2007; 31:387–395.
18. Han DH, Kim JB. The association between smoking and periodontitis: findings from The Korean National Oral Health Survey 2006. J Korean Acad Oral Health. 2009; 33:634–643.
19. Offenbacher S. Periodontal diseases: pathogenesis. Ann Periodon-tol. 1996; 1:821–878.
crossref
20. Sheiham A, Nicolau B. Evaluation of social and psychological factors in periodontal disease. Periodontol 2000. 2005; 39:118–131.
crossref
21. Petersen PE. The World Oral Health Report 2003: continuous improvement of oral health in the 21st century-the approach of the WHO Global Oral Health Programme. Community Dent Oral Epidemiol. 2003; 31(Suppl 1):S3–23.
22. World Health Organization. Oral Health Surveys: Basic Methods. 4th ed. Geneva: World Health Organization;1997. p. 36–39.
23. Chung SY, Jeong SH, Bin SO, Choi YH, Song KB. Comparison of periodontal condition by residential areas in Korean adult population: KNOHS 2000. J Korean Acad Oral Health. 2010; 34:516–524.
24. Choi YH, Lee JH, Lee SG. Geographical disparities for oral health status in Korean adults. J Korean Acad Oral Health. 2009; 33:243–253.
25. Mattila ML, Rautava P, Sillanpaa M, Paunio P. Caries in five-year-old children and associations with family-related factors. J Dent Res. 2000; 79:875–881.
crossref
26. Saied-Moallemi Z, Vehkalahti MM, Virtanen JI, Tehranchi A, Murtomaa H. Mothers as facilitators of preadolescents’ oral self-care and oral health. Oral Health Prev Dent. 2008; 6:271–277.
27. U.S.news & world report. 11 Health Habits That Will Help You Live to 100 [Internet]. [cited 2012 Dec 18]. Available from:. http://health.usnews.com/health-news/family-health/living-well/articles/2009/02/20/10-health-habits-that-will-help-you-live-to-100.
28. Moore SL, Wilson K. Parasites as a viability cost of sexual selection in natural populations of mammals. Science. 2002; 297:2015–2018.
crossref
29. Brown LJ, Oliver RC, Loe H. Evaluating periodontal status of US employed adults. J Am Dent Assoc. 1990; 121:226–232.
30. Tomar SL, Asma S. Smoking-attributable periodontitis in the United States: Findings from NHANES III. National Health and Nutrition Examination Survey. J Periodontol. 2000; 71:743–751.

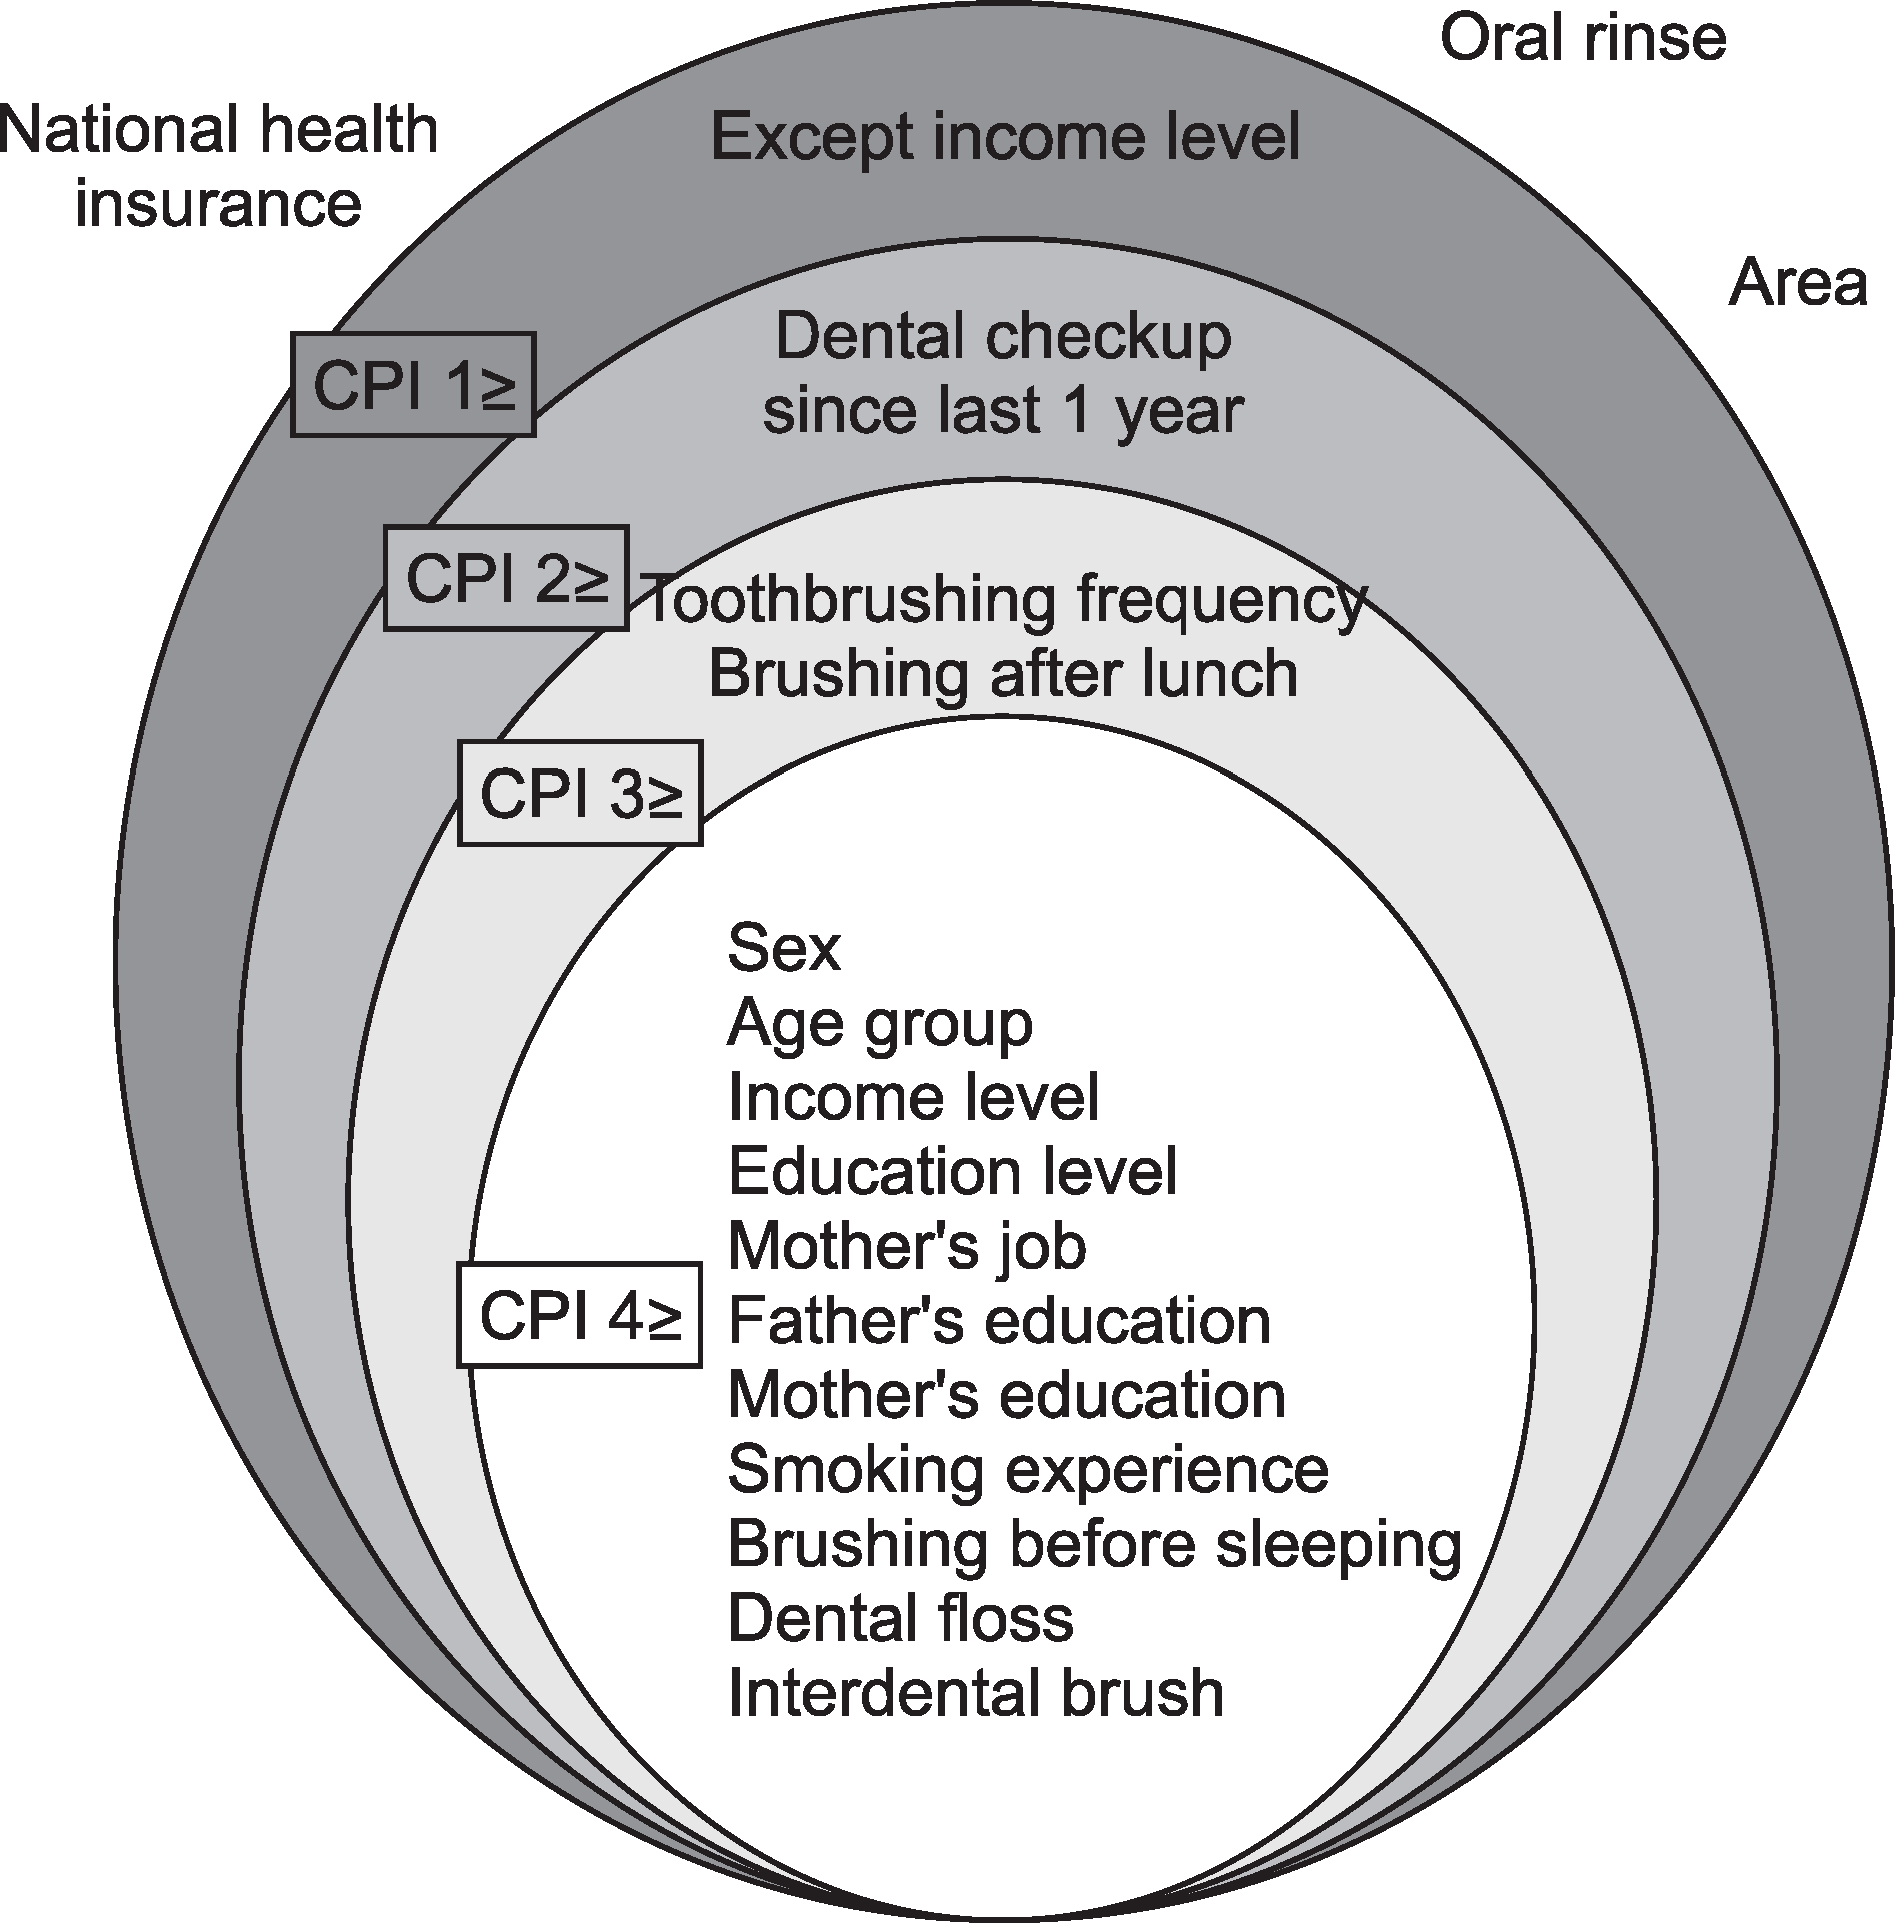
Fig. 1.
Summary of relationship between CPI and other variables determined by chi-square test.
jkaoh-37-95f1.tif
Fig. 2.
Summary of relationship between each variables and periodontal disease.
jkaoh-37-95f2.tif
Table 1.
Relationship between each community periodontal index and other variables analyzed from chi-square test and logistic regression analysis
Variables Level N (%) Community periodontal index Adjusted OR (CI)
CPI 4 CPI 3, 4 CPI 2, 3, 4 CPI 1, 2, 3, 4 CPI 4≤ vs 4> CPI 3≤ vs 3> CPI 2≤ vs 2> CPI 1≤ vs 0
Area Urban (dong) 5,476 (84.4) 159 (2.9) 977 (17.4) 3,452 (63.1) 3,870 (70.4) 1.06 (0.60-1.88) 1.01 (0.76-1.34) 0.93 (0.73-1.19) 0.80 (0.58-1.12)
Rural (eup, myeon) 1,009 (15.6) 37 (3.7) 206 (20.2) 661 (66.5) 767 (76.1) 1 1 1 1
Sex Male 2,767 (42.7) 127 (4.3) 673 (22.5) 1,984 (70.9) 2,157 (77.2) 1.96 (1.28-3.00)§ 1.44 (1.17-1.78)§ 1.42 (1.22-1.66)§ 1.39 (1.18-1.64)§
Female 3,718 (57.3) †69 (1.6) †510 (12.7) †2,129 (55.7) †2,480 (64.7) 1 1 1 1
Age group 18-24 899 (13.9) 1 (0.1) 35 (4.2) 480 (54.5) 562 (63.4) 0.03 (0.00-0.20)§ 0.11 (0.07-0.17)§ 0.41 (0.33-0.51)§ 0.50 (0.39-0.62)§
25-29 1,027 (15.8) 5 (0.4) 97 (9.6) 582 (57.8) 672 (66.5) 0.07 (0.03-0.17)§ 0.26 (0.2-0.34)§ 0.49 (0.40-0.61)§ 0.58 (0.46-0.72)§
30-34 1,373 (21.2) 27 (2.2)† 212 (16.0)† 855 (62.7)† 976 (70.4)† 0.36 (0.22-0.58)§ 0.42 (0.33-0.53§ 0.61 (0.50-0.74)§ 0.68 (0.56-0.84)§
35-39 1,706 (26.3) 63 (4.2) 377 (23.5) 1,131 (67.5) 1,278 (75.6) 0.61 (0.43-0.87)§ 0.66 (0.55-0.8)§ 0.76 (0.64-0.90)§ 0.89 (0.75-1.05)
40-44 1,480 (22.8) 100 (7.2) 462 (32.4) 1,065 (73.3) 1,149 (78.1) 1 1 1 1
Income level Quartile 1 (low) 479 (7.4) 17 (3.6) 95 (18.6) 313 (65.6) 350 (72.8) 2.08 (0.94-4.60) 1.43 (1.02-2.01) 1.14 (0.88-1.46) 1.09 (0.82-1.44)
Quartile 2 1,457 (22.5) 65 (4.2) 309 (19.8) 976 (66.5) 1,083 (72.8) 2.02 (1.24-3.27)§ 1.32 (1.05-1.66) 1.18 (0.99-1.40) 1.07 (0.88-1.29)
Quartile 3 2,247 (34.6) *64 (2.8) *417 (18.4) †1,437 (64.5) 1,610 (71.7) 1.20 (0.83-1.75) 1.13 (0.92-1.37) 1.11 (0.96-1.28) 1.04 (0.89-1.21)
Quartile 4 (high) 2,302 (35.5) 50 (2.2) 362 (15.6) 1,387 (60.3) 1,594 (69.2) 1 1 1 1
Education level Elementary 49 (0.8) 7 (15.1) 17 (36.2) 42 (85.9) 45 (92.1) 3.88 (1.18-12.74) 1.47 (0.73-2.94) 2.61 (1.08-6.28) 3.56 (1.19-10.67)
Middle 188 (2.9) 17 (9.3) 56 (30.3) 142 (76.5) 152 (81.0) 1.89 (0.96-3.73) 1.15 (0.77-1.71) 1.34 (0.88-2.02) 1.23 (0.78-1.94)
High 3,203 (49.4) †98 (2.8) †597 (17.3) †2,073 (64.5) †2,320 (71.7) 0.96 (0.64-1.44) 0.97 (0.81-1.16) 1.02 (0.89-1.18) 0.98 (0.85-1.14)
University 3,045 (47.0) 74 (2.7) 513 (17.2) 1,856 (61.4) 2,120 (69.7) 1 1 1 1
Nationalhealth insuranceMother's job Non-medical aid 6,375 (98.3) 191 (3.0) 1,154 (17.7) 4,037 (63.5) 4,558 (71.2) 2.27 (0.59-8.69) 0.91 (0.52-1.58) 0.89 (0.55-1.44) 1.20 (0.74-1.94)
Medical aid 110 (1.7) 5 (3.5) 29 (24.2) 76 (68.9) 79 (70.3) 1 1 1 1
Yes 3,687 (56.9) 133 (3.7) 761 (20.6) 2,414 (65.9) 2,697 (73.3) 1.23 (0.84-1.80) 1.21 (1.03-1.43) 1.12 (0.99-1.26) 1.11 (0.98-1.27)
No 2,798 (43.1) †63 (2.1) †422 (14.4) †1,699 (60.8) †1,940 (68.6) 1 1 1 1
Father's education Elementary 2,149 (33.1) 107 (5.4) 526 (25.3) 1,452 (68.7) 1,623 (76.1) 0.92 (0.43-1.97) 1.22 (0.82-1.8) 1.11 (0.87-1.43) 1.16 (0.90-1.50)
Middle 1,402 (21.6) 39 (2.6) 266 (18.3) 900 (63.9) 1,020 (71.6) 0.62 (0.29-1.43) 1.09 (0.75-1.58) 1.05 (0.83-1.34) 1.05 (0.82-1.36)
High 1,943 (30.0) †33 (1.6) †282 (13.8) †1,190 (61.6) †1,347 (69.3) 0.62 (0.31-1.22) 1.08 (0.78-1.51) 1.08 (0.87-1.33) 1.09 (0.87-1.36)
University 991 (15.3) 17 (1.6) 109 (10.5) 571 (57.2) 647 (64.8) 1 1 1 1
Mother's education Elementary 3,090 (47.6) 141 (4.9) 743 (24.7) 2,068 (67.9) 2,316 (75.3) 3.90 (0.71-21.42) 1.63 (0.92-2.91) 0.96 (0.71-1.31) 1.04 (0.75-1.46)
Middle 1,503 (23.2) 34 (2.1) 240 (15.4) 931 (61.7) 1,062 (70.1) 3.31 (0.60-18.31) 1.38 (0.78-2.42) 0.91 (0.68-1.22) 1.00 (0.73-1.38)
High 1,522 (23.5) †19 (1.1) †172 (10.9) †902 (59.8) †1,021 (67.2) 2.48 (0.47-13.17) 1.36 (0.81-2.28) 0.99 (0.77-1.27) 1.02 (0.77-1.34)
University 370 (5.7) 2 (0.5) 28 (7.3) 212 (56.0) 238 (63.4) 1 1 1 1
Smoking experience Present_smoke 1,722 (26.6) 77 (4.2) 449 (24.5) 1,318 (75.8) 1,407 (80.5) 1.61 (0.99-2.62) 1.74 (1.38-2.19)§ 1.86 (1.55-2.25)§ 1.68 (1.37-2.06)§
Quit 955 (14.7) 48 (4.8)† 222 (21.8)† 651 (64.7)† 729 (72.5)† 1.68 (1.03-2.73) 1.41 (1.11-1.79)§ 1.17 (0.98-1.41) 1.17 (0.97-1.42)
Never 3,768 (58.1) 71 (1.6) 512 (12.5) 2,144 (55.9) 2,501 (65.2) 1 1 1 1
Dental checkupsince last 1 year Yes 2,034 (31.4) 56 (3.0) 335 (17.0) 1,116 (54.8) 1,300 (63.3) 0.98 (0.67-1.43) 0.92 (0.77-1.1) 0.59 (0.51-0.67)§ 0.60 (0.52-0.69)§
No 4,451 (68.6) 140 (3.0) 848 (18.1) †2,997 (67.7) †3,337 (74.8) 1 1 1 1
Toothbrushingfrequency Below 1 592 (9.1) 24 (4.2) 138 (22.9) 395 (67.4) 439 (73.9) 1.17 (0.48-2.84) 1.00 (0.72-1.37) 0.80 (0.60-1.06) 0.78 (0.58-1.06)
2 2,364 (36.5) 78 (3.2) 461 (19.2)† 1,580 (66.8)† 1,757 (74.1)† 1.10 (0.65-1.87) 0.96 (0.76-1.21) 0.94 (0.77-1.14) 0.95 (0.79-1.16)
Above 3 3,529 (54.4) 94 (2.6) 584 (15.8) 2,138 (60.6) 2,441 (68.6) 1 1 1 1
Brushing after lunch No 3,222 (49.7) 107 (3.3) 655 (20.0) 2,155 (67.2) 2,397 (74.3) 0.91 (0.50-1.65) 1.21 (0.97-1.5) 1.20 (0.98-1.45) 1.20 (0.99-1.46)
Yes 3,263 (50.3) 89 (2.7) †528 (15.4) †1,958 (59.8) †2,240 (68.0) 1 1 1 1
Brushingbefore sleepingDental floss No 3,212 (49.5) 110 (3.6)* 648 (19.8)† 2,077 (65.1)* 2,343 (72.8)* 1.05 (0.72-1.53) 1.05 (0.9-1.23) 1.03 (0.91-1.17) 1.07 (0.94-1.22)
Yes 3,273 (50.5) *86 (2.4) †535 (15.9) *2,036 (62.1) *2,294 (69.6) 1 1 1 1
No use 5,257 (81.1) 176 (3.2) 1,031 (18.9) 3,452 (65.7) 3,859 (73.1) 1.47 (0.86-2.52) 1.49 (1.18-1.87)§ 1.42 (1.23-1.64)§ 1.42 (1.22-1.64)§
Use 1,228 (18.9) *20 (1.9) †152 (12.5) †661 (53.2) †778 (61.8) 1 1 1 1
Interdental brush No use 5,615 (86.6) 159 (2.7)† 981 (17.0)† 3,592 (64.1)* 4,051 (71.8)† 0.64 (0.43-0.95) 0.68 (0.55-0.84)§ 1.11 (0.94-1.32) 1.20 (1.00-1.44)§
Use 870 (13.4) †37 (4.6) †202 (23.3) *521 (59.8) †586 (66.3) 1 1 1 1
Oral rinse No use 5,741 (88.5) 171 (2.9) 1,058 (18.0) 3,652 (63.8) 4,113 (71.4) 0.48 (0.29-0.78)§ 0.88 (0.68-1.14) 0.92 (0.77-1.09) 0.94 (0.78-1.14)
Use 744 (11.5) 25 (3.9) 125 (16.3) 461 (61.7) 524 (69.0) 1 1 1 1
Total 6,485 (100) 196 1,183 4,113 4,637
Value in the bracket means rate of subjects who have the CPI code among subjects.The CI means 95% confidence interval.*P<0.05, P<0.01 by determined by chi-square test, P<0.05, §P<0.01 by determined by logistic regression analysis.
TOOLS
Similar articles