Abstract
Objectives
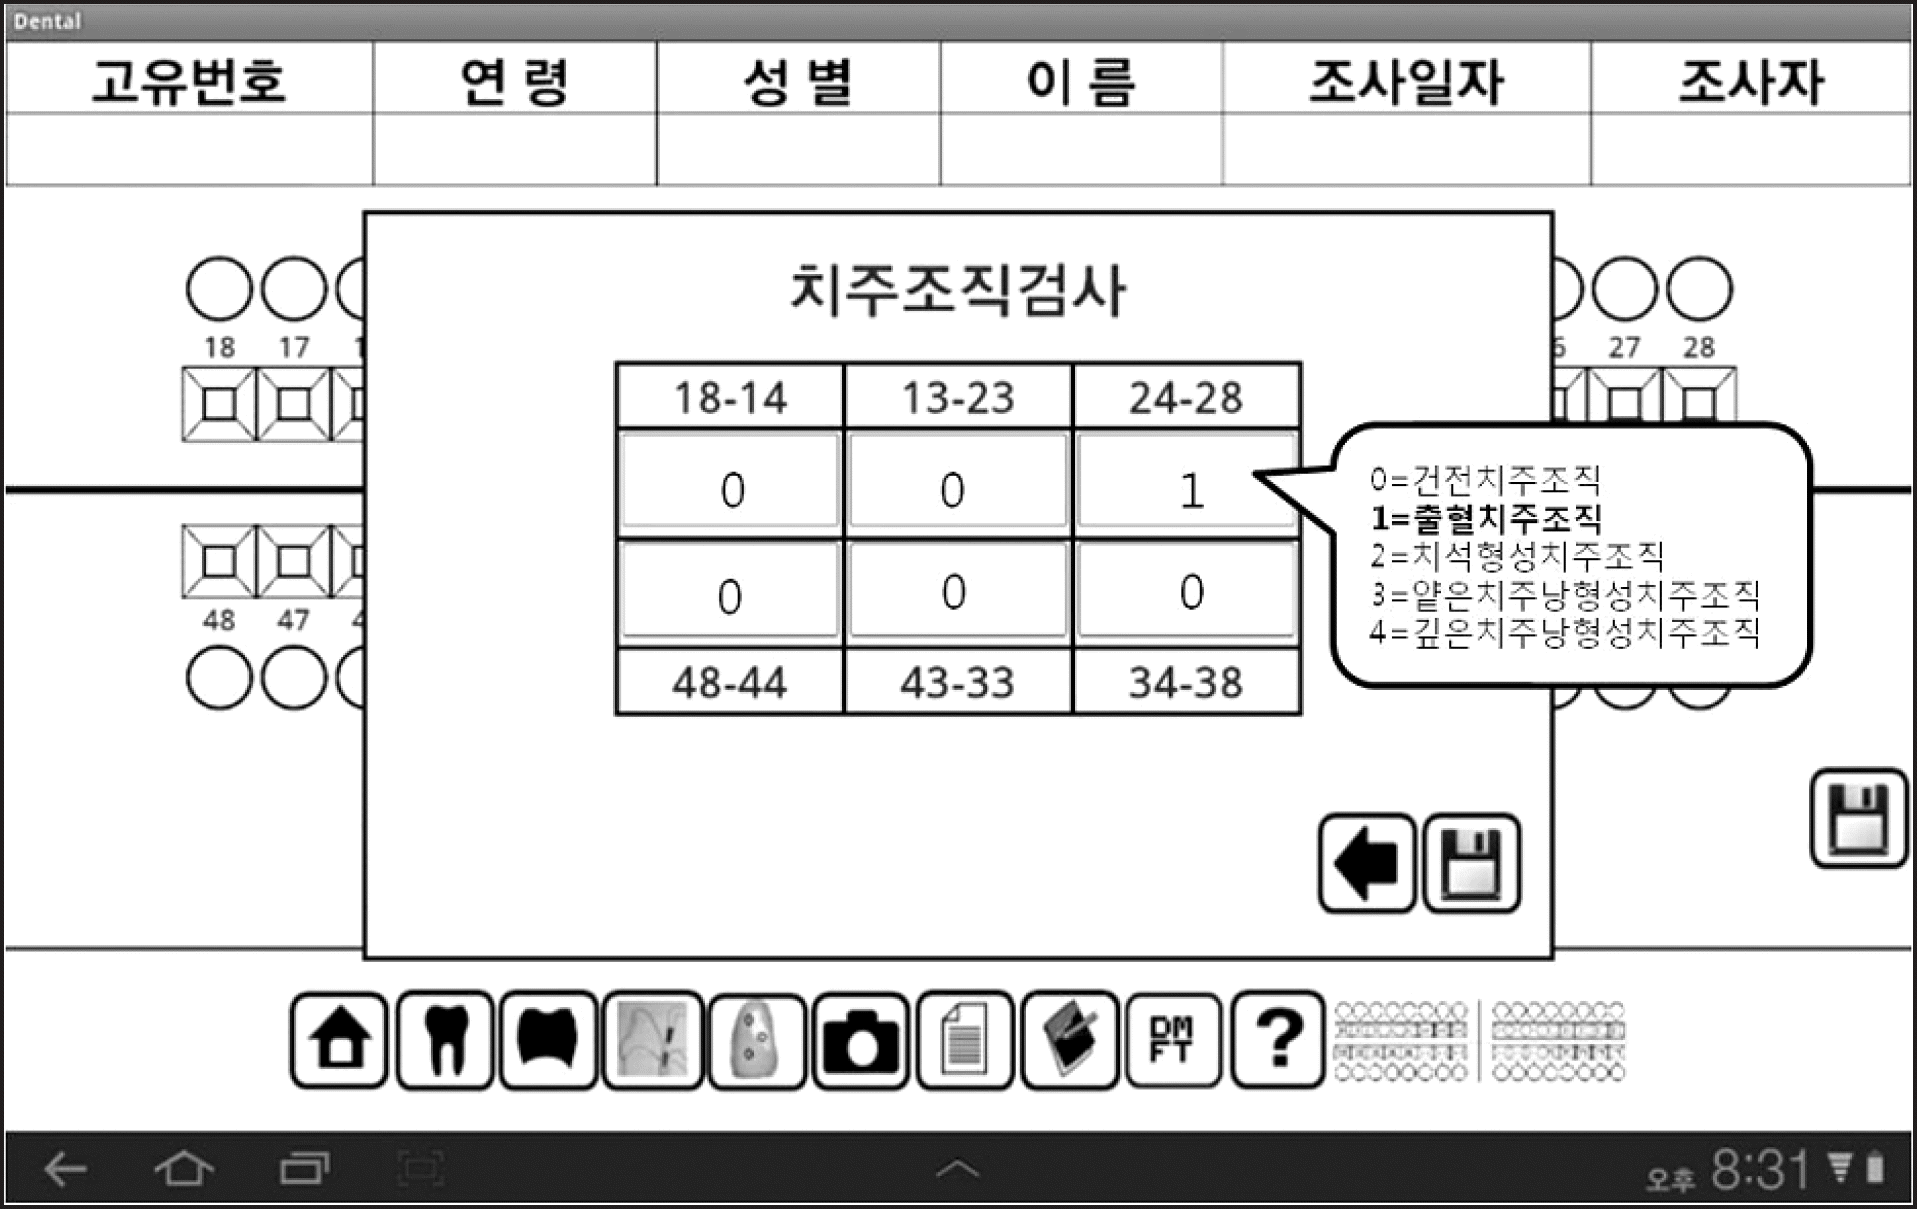
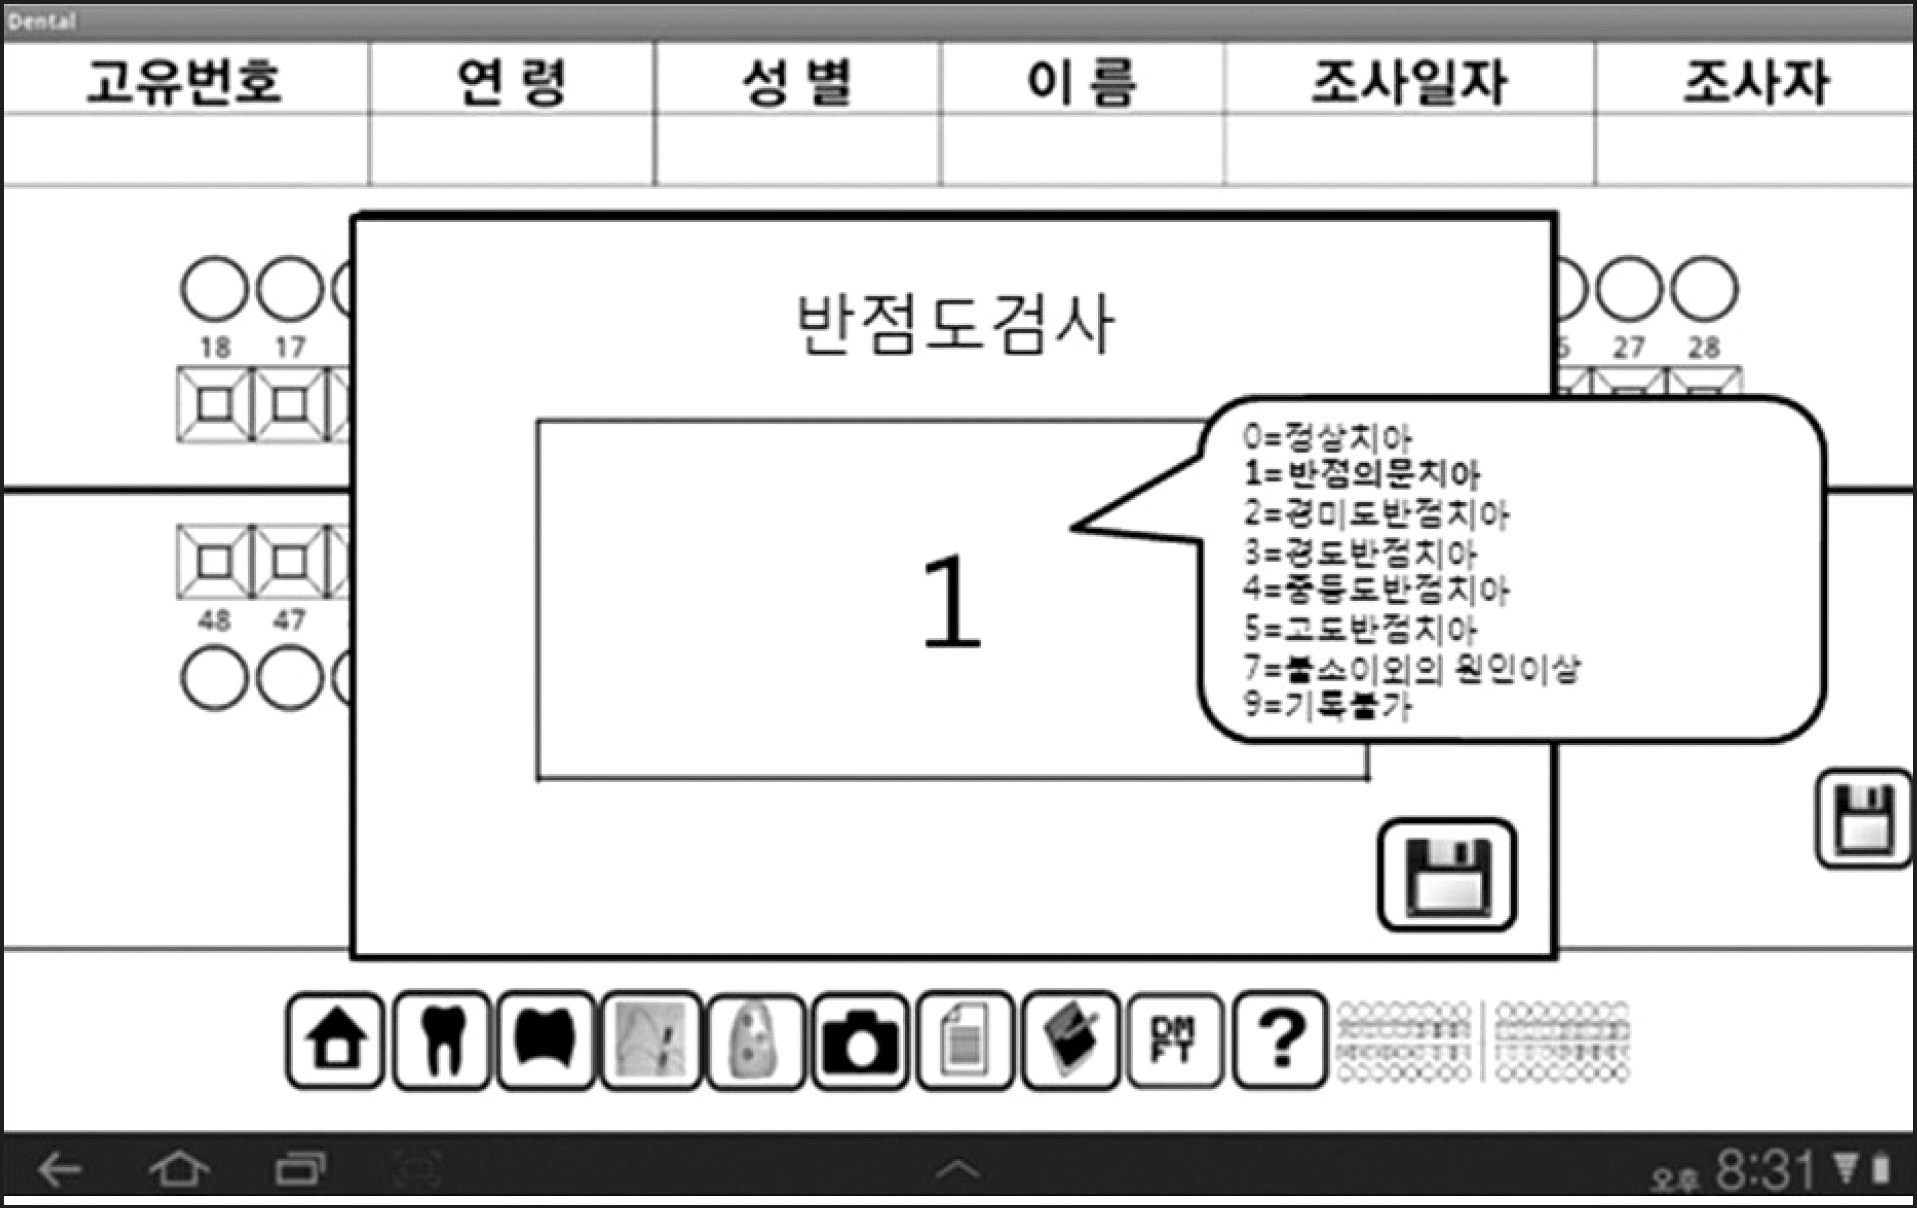
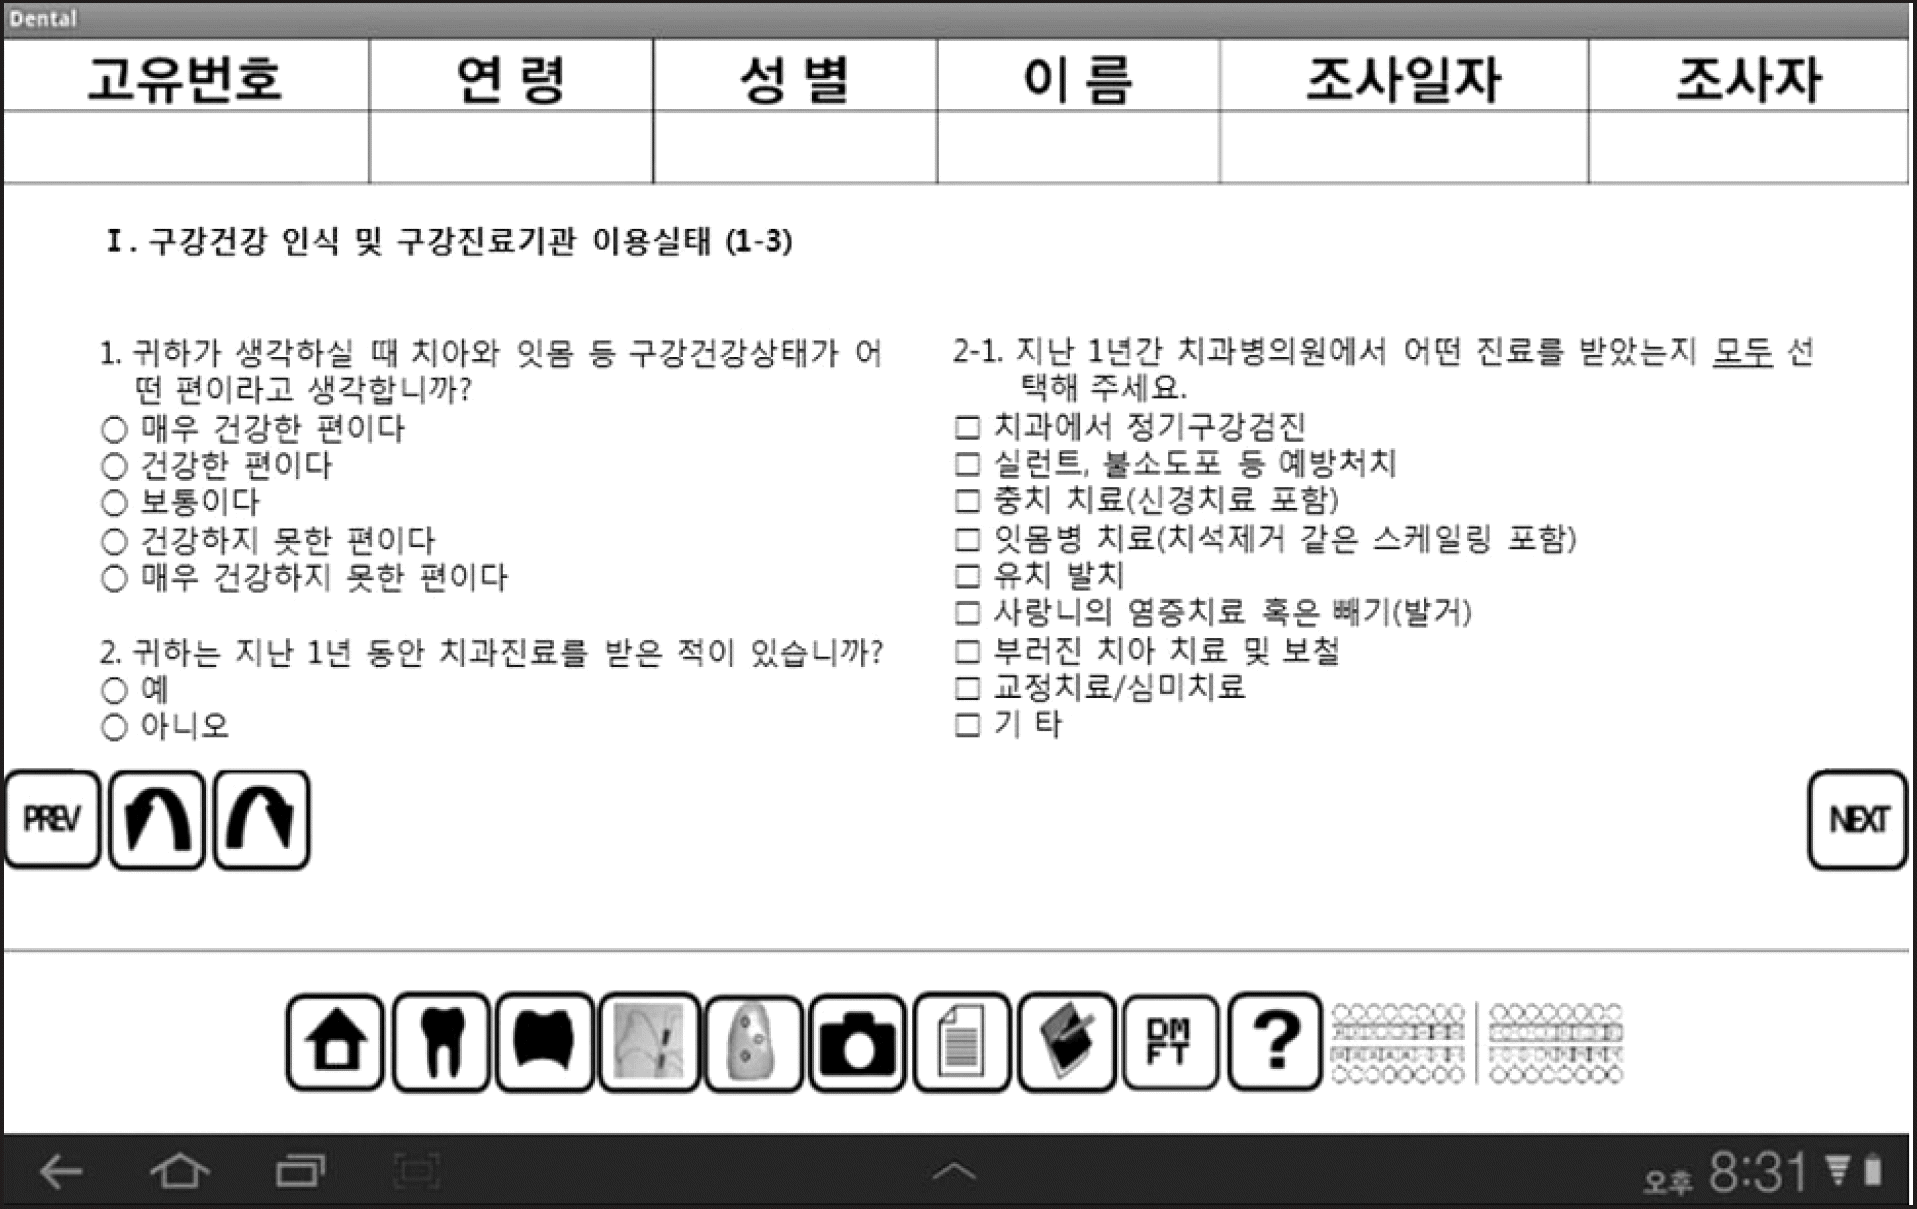
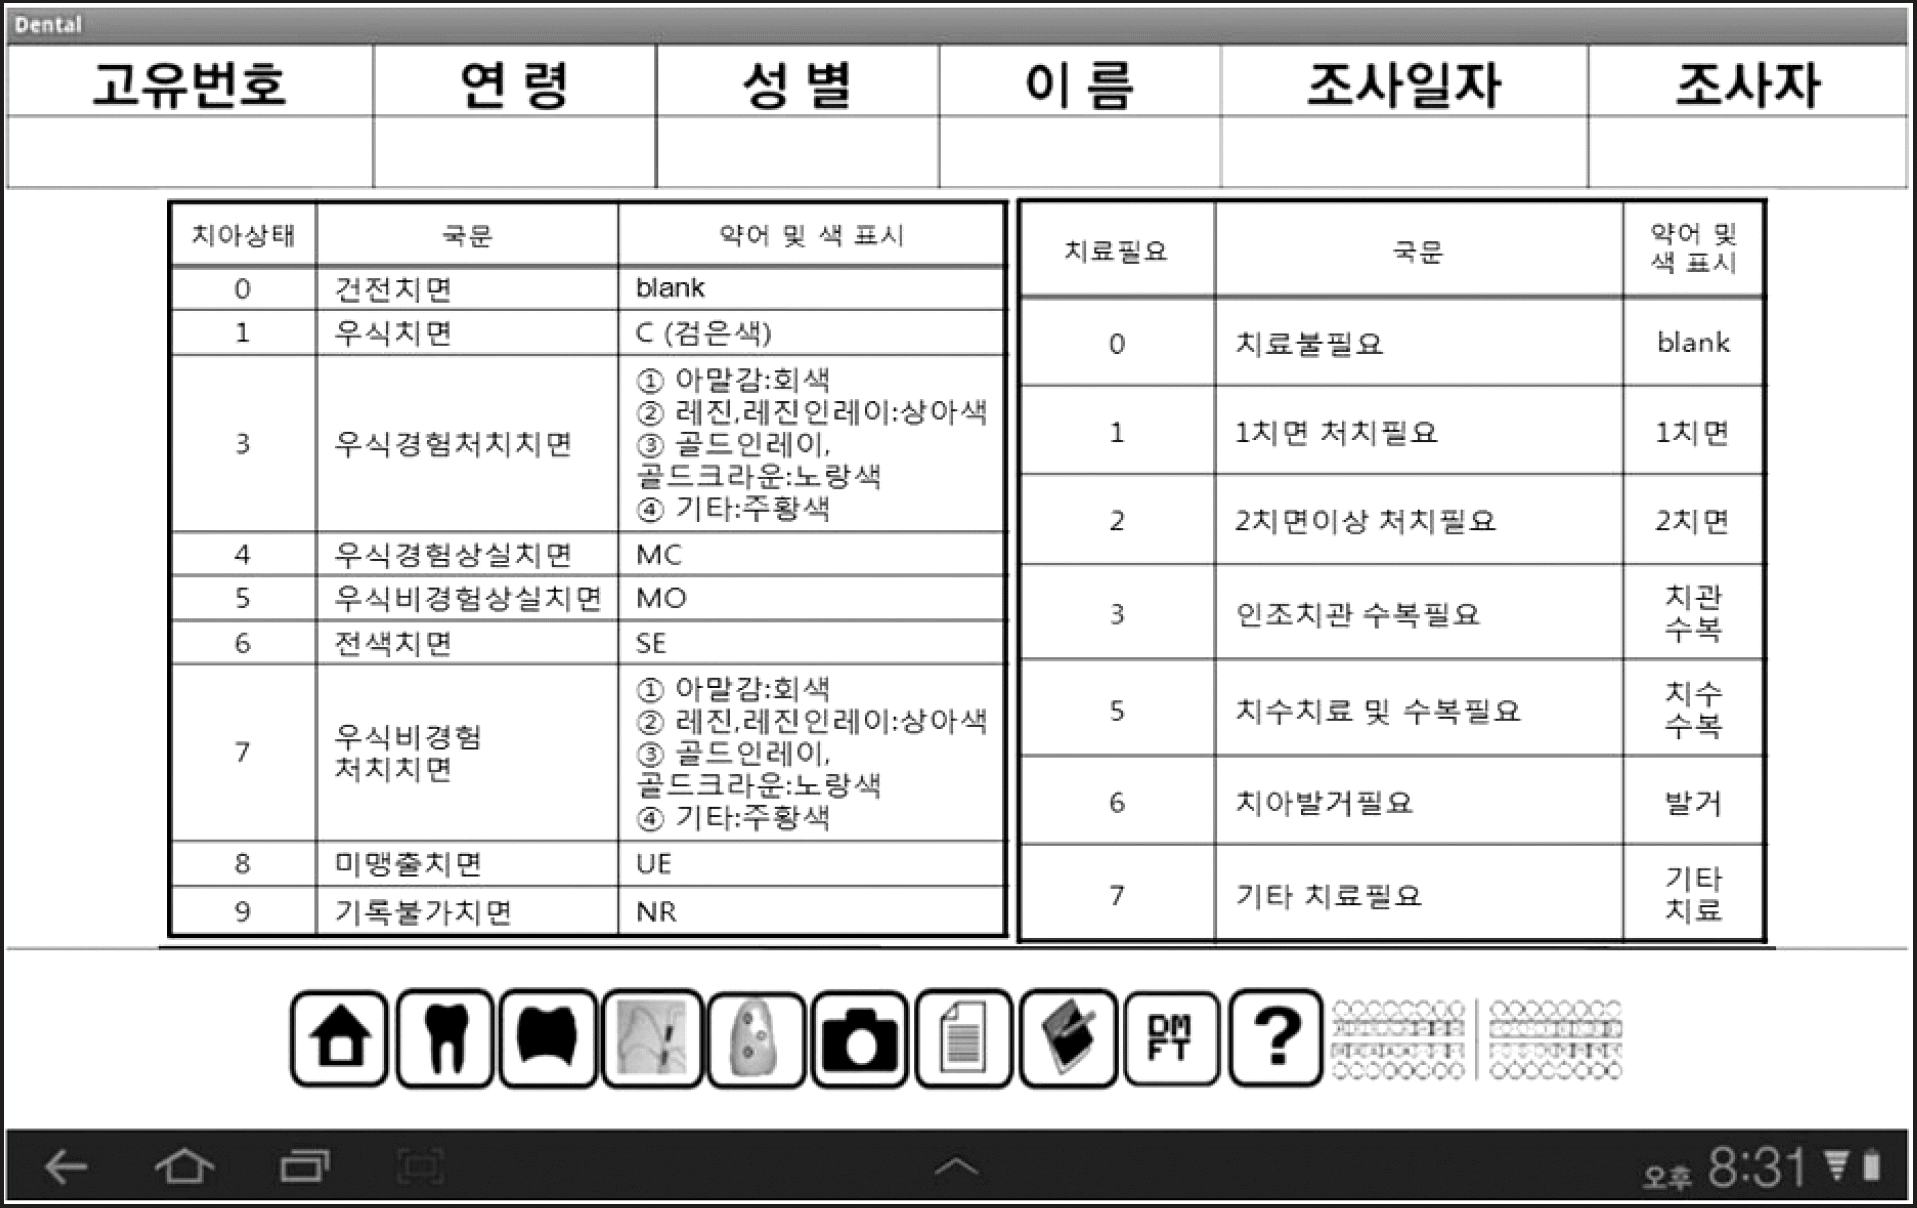
In the present study, we aimed to develop an oral examination smart chart application for tablet personal computers (PC). We evaluated the time required to perform an oral examination and assessed the degree of user’s convenience by using this application. We determined to make our application cost and human resource effective by automatically computerizing the statistics to facilitate its application in oral health services such as national oral health research. The development of this application for tablet PCs was aimed at recording the results of oral examinations.
Methods
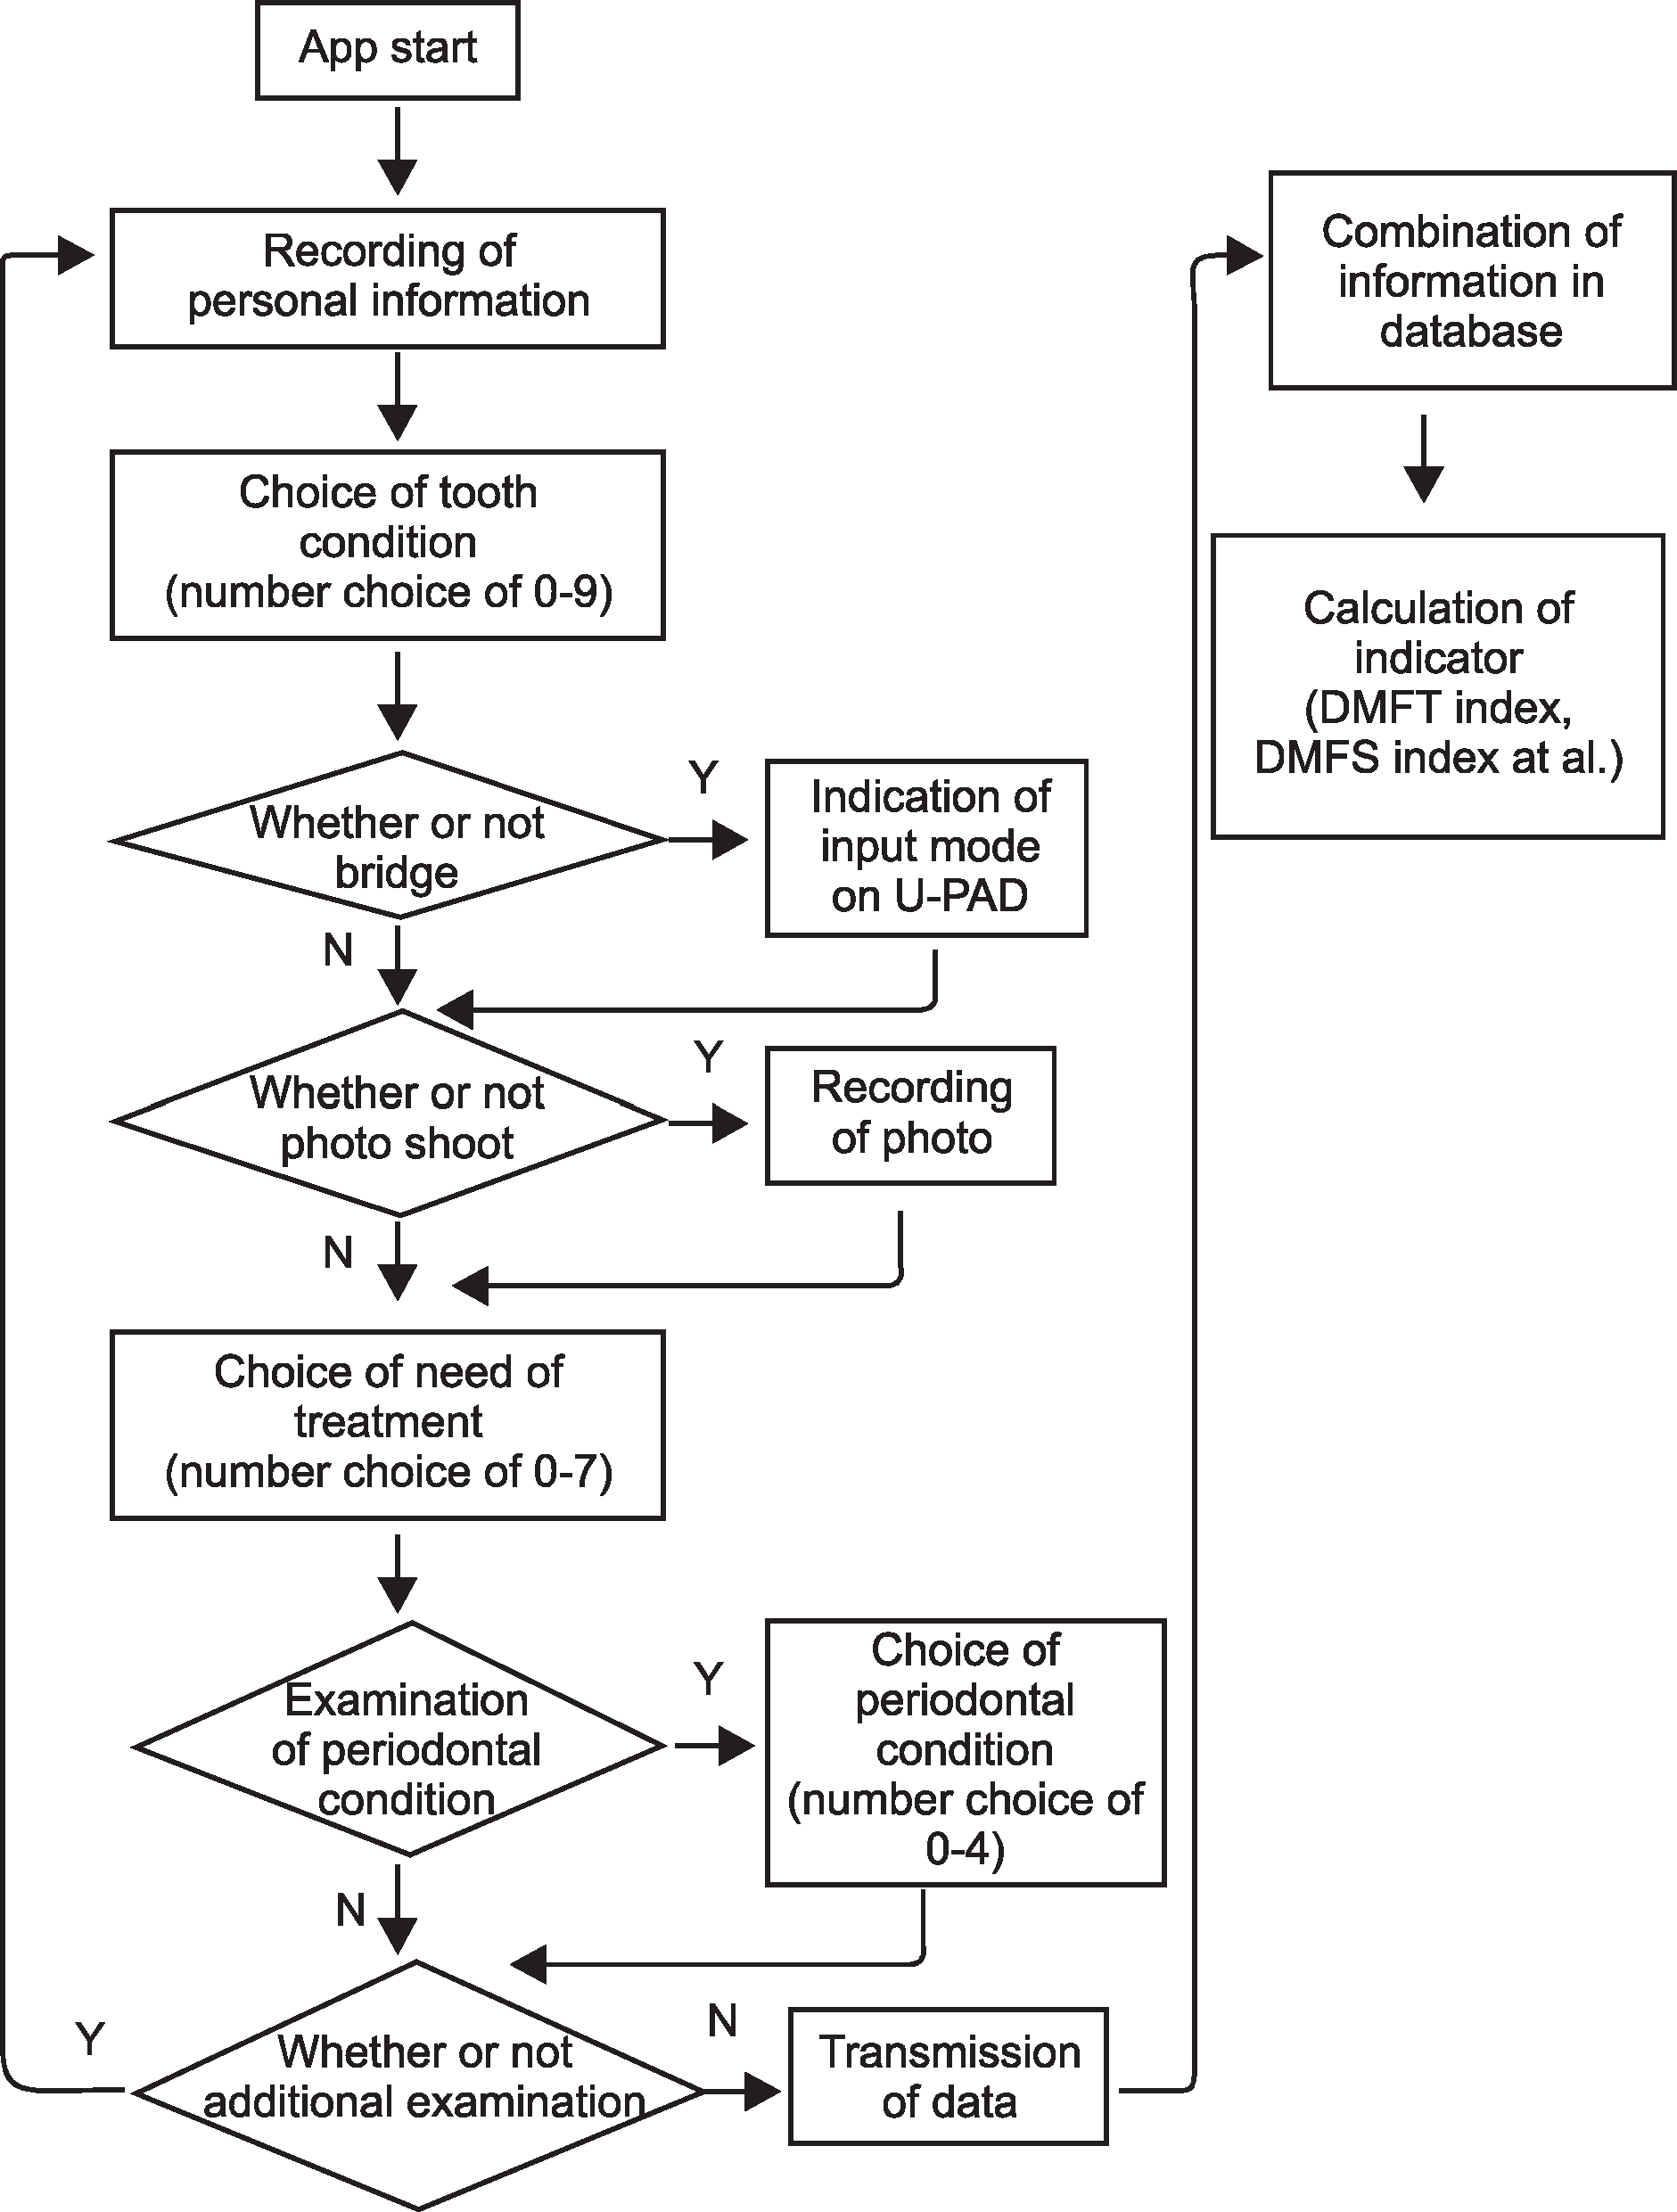
We produced flow charts and designed the program screen, which would replace the existing paper chart. To evaluate the efficiency of the application, 1 preventive dentistry professor and 6 dentistry students performed an oral examination on 41 subjects. We performed the oral examination in duplicate using a tablet PC and a paper chart. The data collected were analyzed using the SPSS 18.0 program. P-values less than 0.05 were considered statistically significant.
Results
The time required for oral examination by the study group (the group using the application) and the control group (the group using paper) were 131.93±10.14 and 151.85±7.77, respectively; the difference between these values was statistically significant (P-value=0.002). The oral examination could be performed faster in the study group (the group using the application) than in the control group; therefore, we noted that the time taken for oral examination was reduced by using the application.
Conclusions
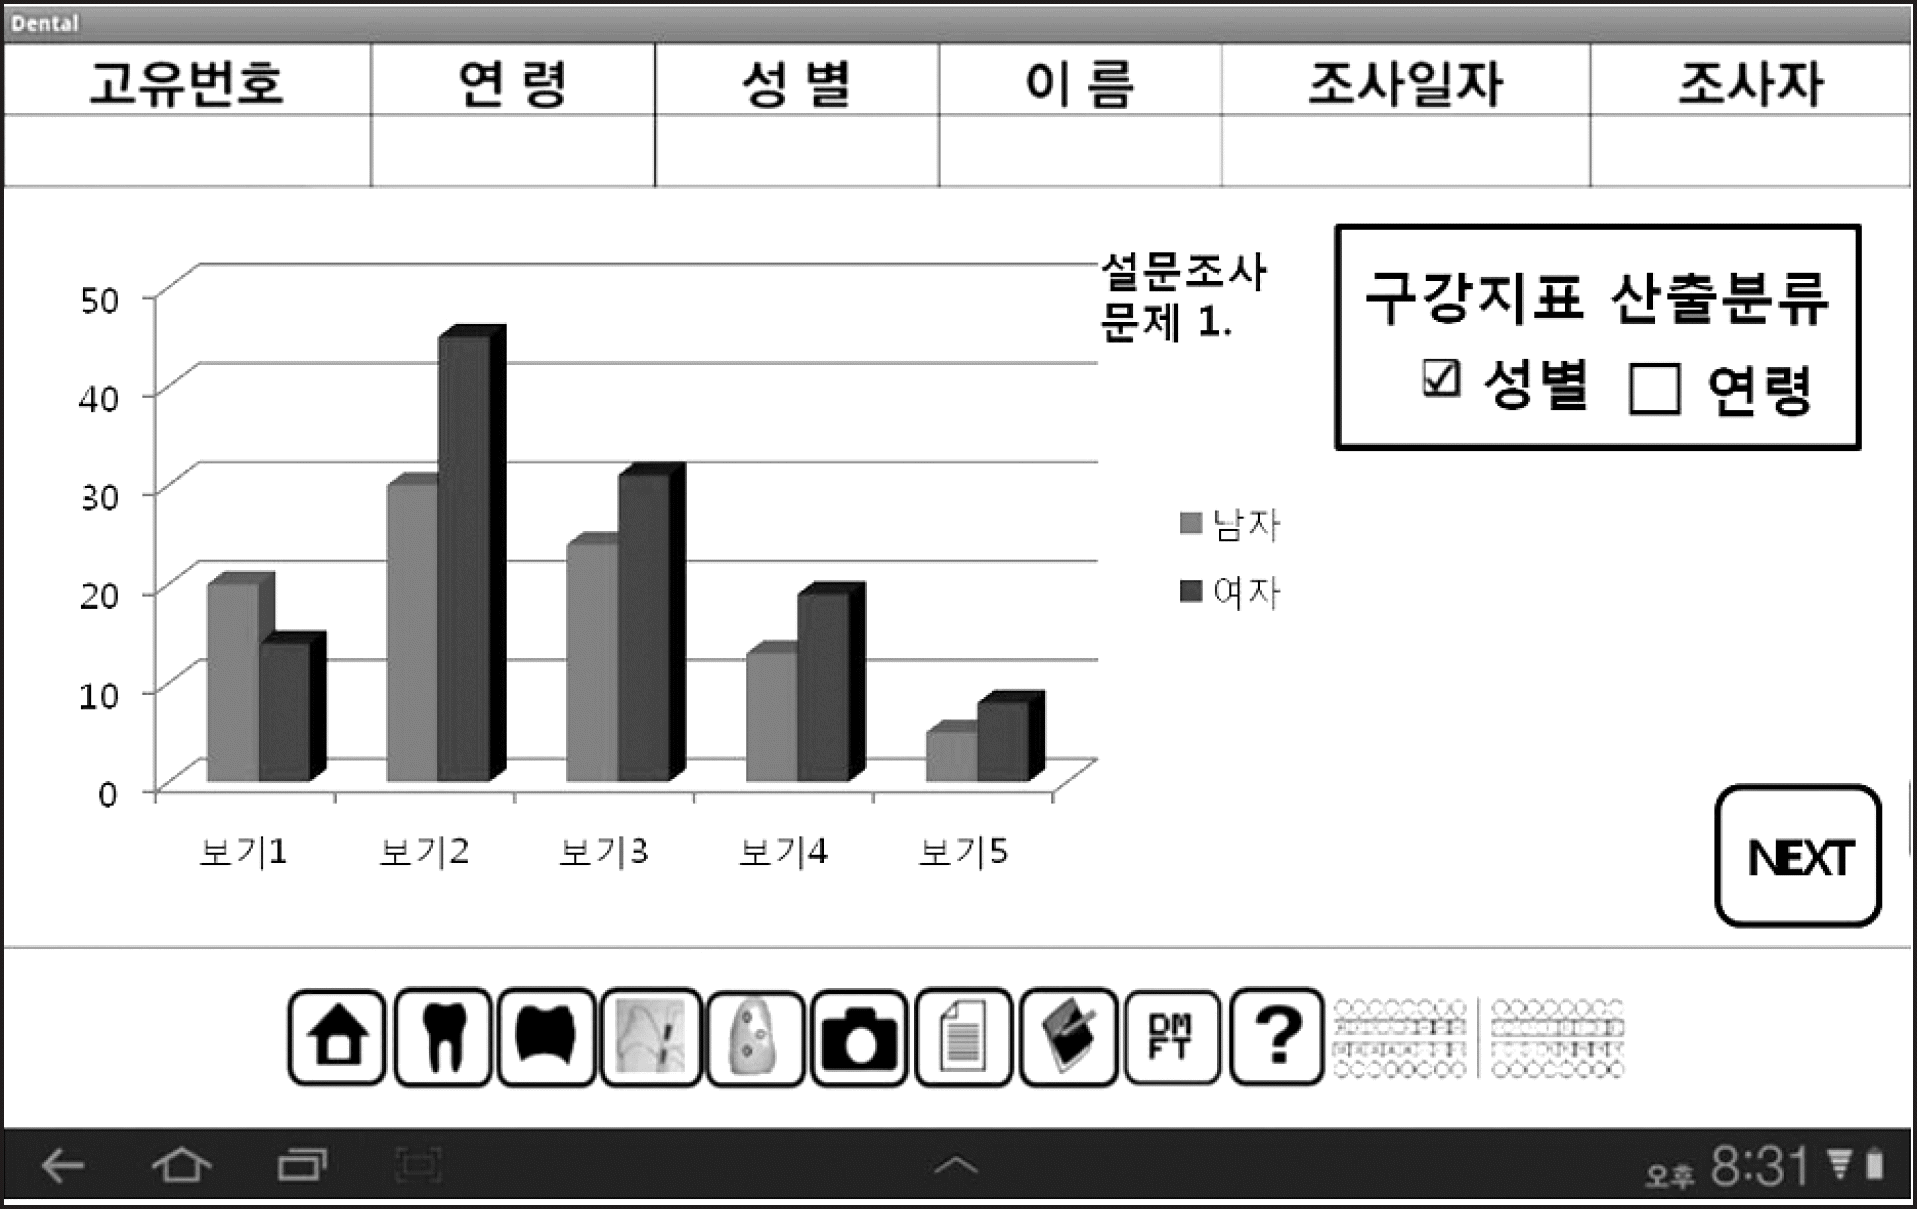
The tablet-based system has been shown to save time by omitting the step of entering the paper chart data into a computer. Further, the findings of this study can be used to establish an oral health index database with the help of additional resources. Moreover, it would facilitate creating awareness among the patients with regard to their oral health indices through the use of visual aids.
Go to : 
References
1. Oh SM. Development of dental image management system based on mobile computing. J Korea Cont Assoc. 2012; 12:379–385.

2. Lee YH. The activation of oral health education using smart phone [master’s thesis]. Seoul: Hanyang University;2012. [Korean].
3. Tanaka PP, Hawrylyshyn KA, Macario A. Use of tablet (iPad®) as a tool for teaching anesthesiology in an orthopedic rotation. Rev Bras Anestesiol. 2012; 62:214–222.
4. Yi SB, Jung JW, Bak BK. Design and implementation of perfor- mance evaluation input program through tablet PC. J Korean Prac Arts Educ. 2012; 18:103–120.
5. Choi JH, Cho HJ, Bae KH, Jin BH, Paik DI. Expert’s opinions on the National Oral Health Examination evaluation system. J Korean Acad Oral Health. 2012; 36:153–160.
6. Ministry of Health and Welfare. 2012 Korean National Oral Health Survey. Seoul: Ministry of Health and Welfare;2013. p. 25–58.
7. Ministry of Health and Welfare, Korea Centers for Disease Control and Prevention. Korea Health Statistics 2011: Korean National Health and Nutrition Examination Survey (KNHANES V-2). Seoul: Ministry of Health & Welfare;2012. p. 3–18.
8. Ministry of Health and Welfare, Korea Centers for Disease Control and Prevention. Korea Health Statistics 2005: The Third Korea National Health and Nutrition Examination Survey (KNHANES III)-Health Examination. Seoul: Ministry of Health & Welfare;2006. p. 11–24.
9. O’Carroll PW, Yasnoff WA, Ward ME, Ripp LH, Martin EL. Public health informatics and information systems. New York: Springer;2003. p. 727–740.
10. Ministry of Health and Welfare. 2010 Korean National Oral Health Survey: II. Surveyed results. Seoul: Ministry of Health and Welfare;2010. p. 10–42.
11. Chang KW, Kim JB. Oral Health Survey:Basic Methods. 1st ed. Seoul: Komoonsa;2000. p. 50–58.
12. Jin BH, Ma DS, Han DH, Kim HD, Paik DI. Development of a computer-based training program for dental caries survey. J Korean Acad Oral Health. 2007; 31:42–49.
13. Park UJ. Study for improvement of the doctor’s satisfaction and completeness of the medical record in the EMR system. J Korean Soci Hosp Admin. 2011; 16:19–30.
Go to : 
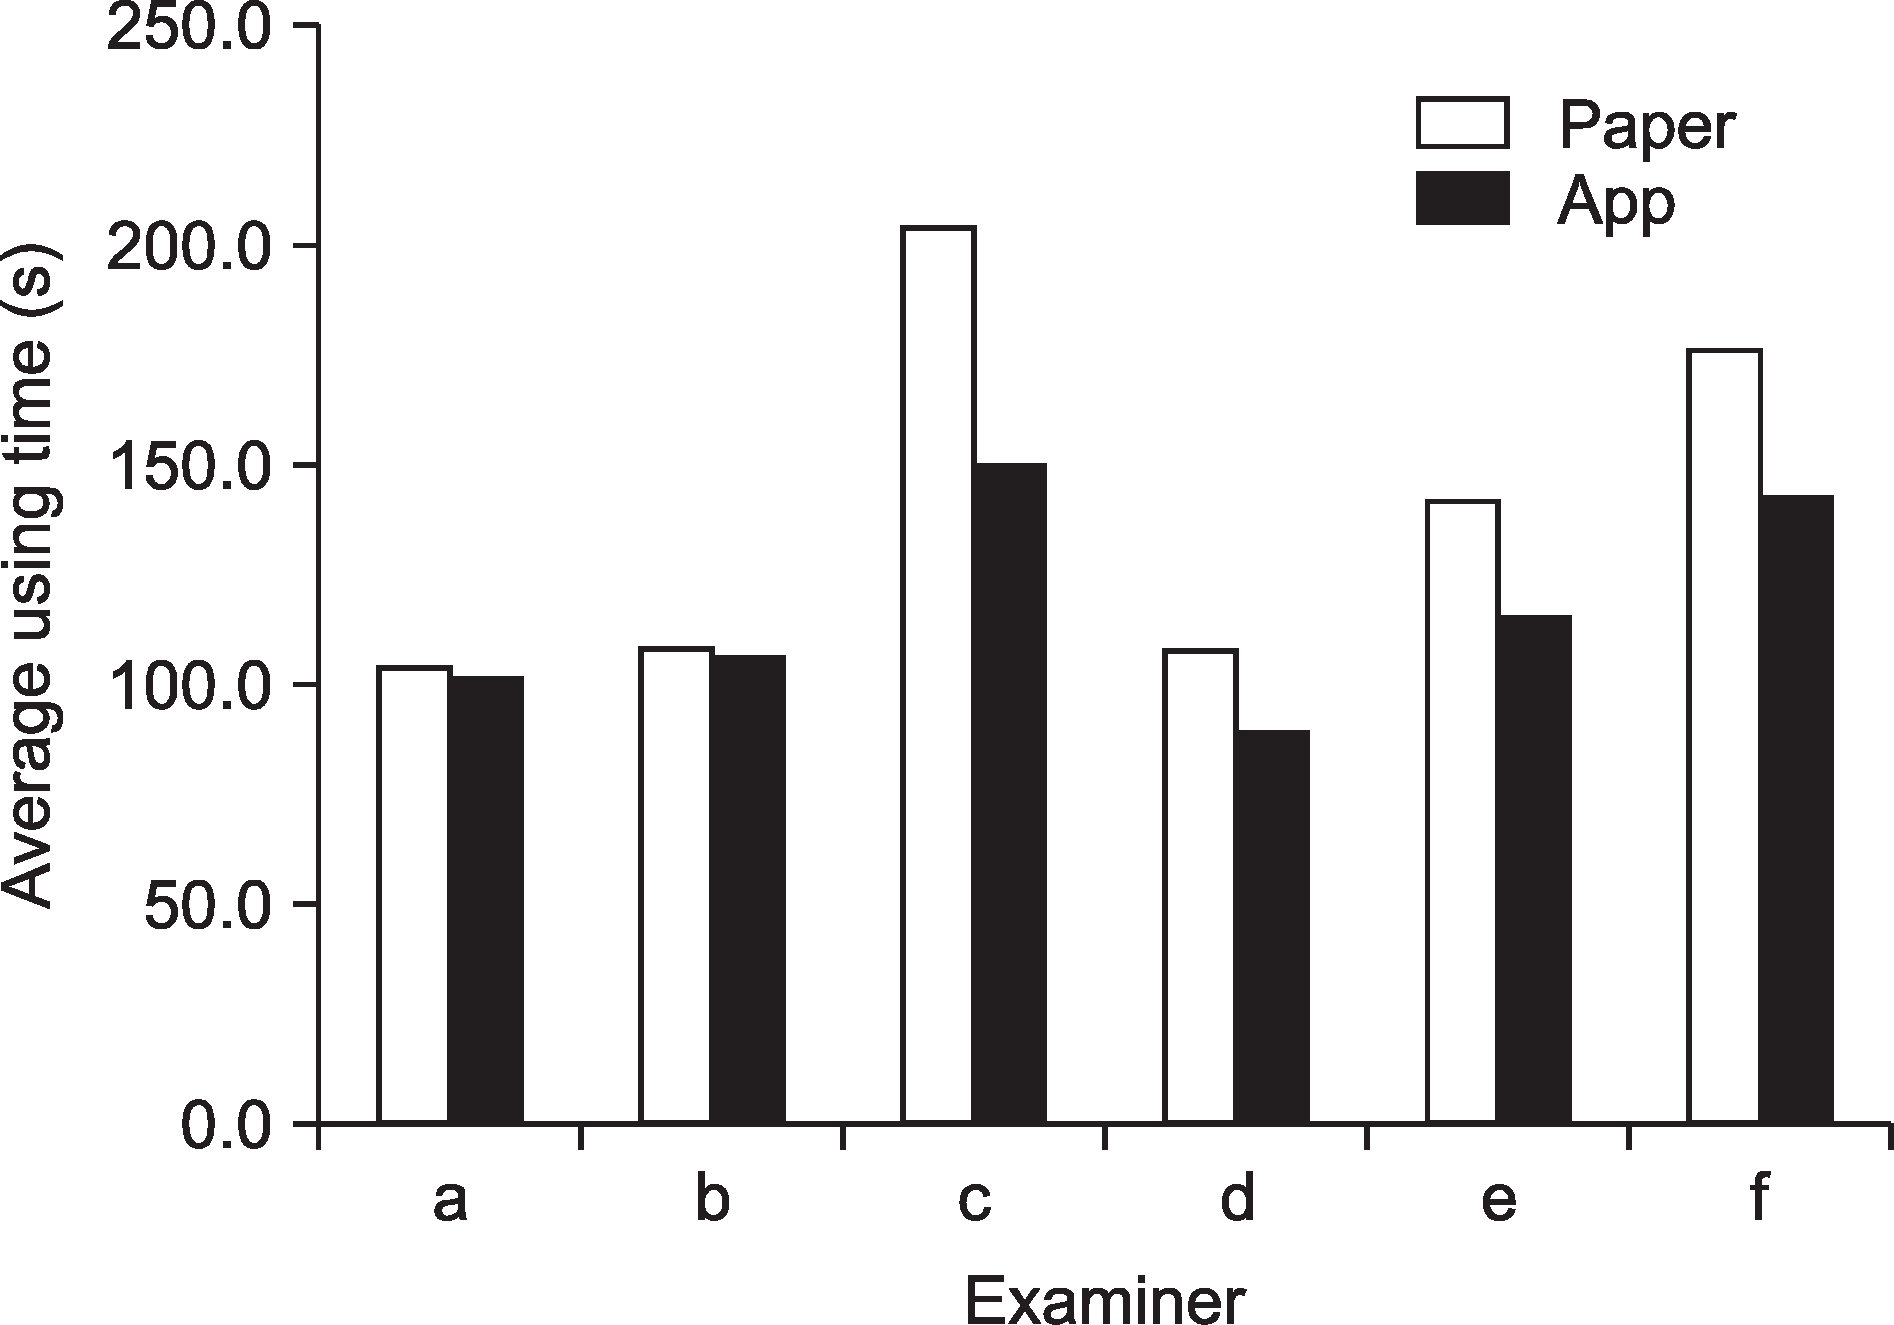 | Fig. 10.Comparison of the time required the smart chart for tablet PC application and paper chart according to examiners. |
Table 1.
Detailed matters of oral examination smart chart application
Table 2.
Comparison of the time required the smart chart for table PC application and paper chart
| Group | Mean±SE* (N=41) | P-value† |
|---|---|---|
| Group 1 (Application chart) | 131.93±10.14 | 0.002 |
| Group 2 (Paper chart) | 151.85±7.77 |


 PDF
PDF ePub
ePub Citation
 Print
Print



 XML Download