

 PDF
PDF ePub
ePub Citation
 Print
Print


Abstract
Background
The amount of interference due to hemolysis, bilirubin, and lipemia can be measured on the AU5800 autoanalyzer (Beckman Coulter, USA) by spectrophotometry. This is reported as semi-quantitative indices, specifically H-index, I-index, and L-index, respectively. In this study, we evaluated the impact of interference using chemistry assays and established the concentration of interfering substances and HIL-index above which analytically significant interference exists, according to CLSI guidelines C56-A and EP7-A2.
Methods
Pooled sera including different concentrations of analytes were prepared and mixed with hemoglobin, bilirubin, or Intralipid. These samples were then tested for 35 clinical chemistry analytes by AU5800 and the bias based on interferent concentrations was computed. The interferent concentration above which significant interference exists was calculated from the 50% within-subject biological variation (desirable analytic goal), and the corresponding index was assigned.
Results
Among 35 items evaluated, interference was detected for 12 analytes by hemoglobin, 7 analytes by bilirubin, and 12 analytes by Intralipid. We proposed HIL-index1 and HIL-index2 for each analyte according to 2 different medical decision levels. HIL-index1 and HIL-index2 were considered more reasonable criteria than the HIL-index from the manufacturer's technical document (HIL-indexTD). This is because HIL-indexTD was empirically set to 5% or 10%, and had a wide tolerance range, which was not sufficient to reflect the presence of interference, compared to HIL-index 1 and HIL-index2.
Go to : 
REFERENCES
1. Kroll MH, Elin RJ. Interference with clinical laboratory analyses. Clin Chem. 1994; 40:1996–2005.

2. Dimeski G. Interference testing. Clin Biochem Rev. 2008; 29(S1):S43–8.
3. Glick MR, Ryder KW, Glick SJ, Woods JR. Unreliable visual estimation of the incidence and amount of turbidity, hemolysis, and icterus in serum from hospitalized patients. Clin Chem. 1989; 35:837–9.
4. Steen G, Vermeer HJ, Naus AJ, Goevaerts B, Agricola PT, Schoenmak-ers CH. Multicenter evaluation of the interference of hemoglobin, bilirubin and lipids on Synchron LX-20 assays. Clin Chem Lab Med. 2006; 44:413–9.
5. Ji JZ, Meng QH. Evaluation of the interference of hemoglobin, bilirubin, and lipids on Roche Cobas 6000 assays. Clin Chim Acta. 2011; 412:1550–3.
6. Steen G, Klerk A, Laan K, Eppens EF. Evaluation of the interference due to haemoglobin, bilirubin and lipids on Immulite 2500 assays: a practical approach. Ann Clin Biochem. 2011; 48:170–5.
7. Clinical and Laboratory Standards Institute. Hemolysis, icterus, and lipemia/turbidity indices as indicators of interference in clinical laboratory analysis; approved guideline. C56-A. Wayne, PA: Clinical and Laboratory Standards Institute. 2012.
8. Clinical and Laboratory Standards Institute. Interference testing in clinical chemistry; approved guideline. 2nd ed.EP7-A2. Wayne, PA: Clinical and Laboratory Standards Institute;2005.
9. Kroll MH. Evaluating interference caused by lipemia. Clin Chem. 2004; 50:1968–9.
10. Fraser CG. Test result variation and the quality of evidence-based clinical guidelines. Clin Chim Acta. 2004; 346:19–24.
11. Fraser CG, Hyltoft Petersen P, Libeer JC, Ricos C. Proposals for setting generally applicable quality goals solely based on biology. Ann Clin Biochem. 1997; 34(Pt 1):8–12.
12. https://www.westgard.com/biodatabase1.htm. (Updated on 2014).
13. Nikolac N. Lipemia: causes, interference mechanisms, detection and management. Biochem Med (Zagreb). 2014; 24:57–67.
14. Petersen PH, Fraser CG. Strategies to set global analytical quality specifications in laboratory medicine: 10 years on from the Stockholm consensus conference. Accred. Qual. Assur. 2010; 15:323–30.
15. Ricos C, Iglesias N, Garcia-Lario JV, Simon M, Cava F, Hernandez A, et al. Within-subject biological variation in disease: collated data and clinical consequences. Ann Clin Biochem. 2007; 44:343–52.
16. Young DS. Effects of drugs on clinical laboratory tests. Ann Clin Biochem. 1997; 34(Pt 6):579–81.
17. Sandberg S, Fraser CG, Horvath AR, Jansen R, Jones G, Oosterhuis W, et al. Defining analytical performance specifications: Consensus Statement from the 1st Strategic Conference of the European Federation of Clinical Chemistry and Laboratory Medicine. Clin Chem Lab Med. 2015; 53:833–5.
18. Yoo G, Kim J, Uh Y, Yoon KR, Park SD, Yoon KJ. Scoring system for detecting spurious hemolysis in anticoagulated blood specimens. Ann Lab Med. 2015; 35:341–7.
19. Bornhorst JA, Roberts RF, Roberts WL. Assay-specific differences in lipemic interference in native and intralipid-supplemented samples. Clin Chem. 2004; 50:2197–201.
20. Huang YC, Kao JT, Tsai KS. Evaluation of two homogeneous methods for measuring high-density lipoprotein cholesterol. Clin Chem. 1997; 43:1048–55.
Go to :
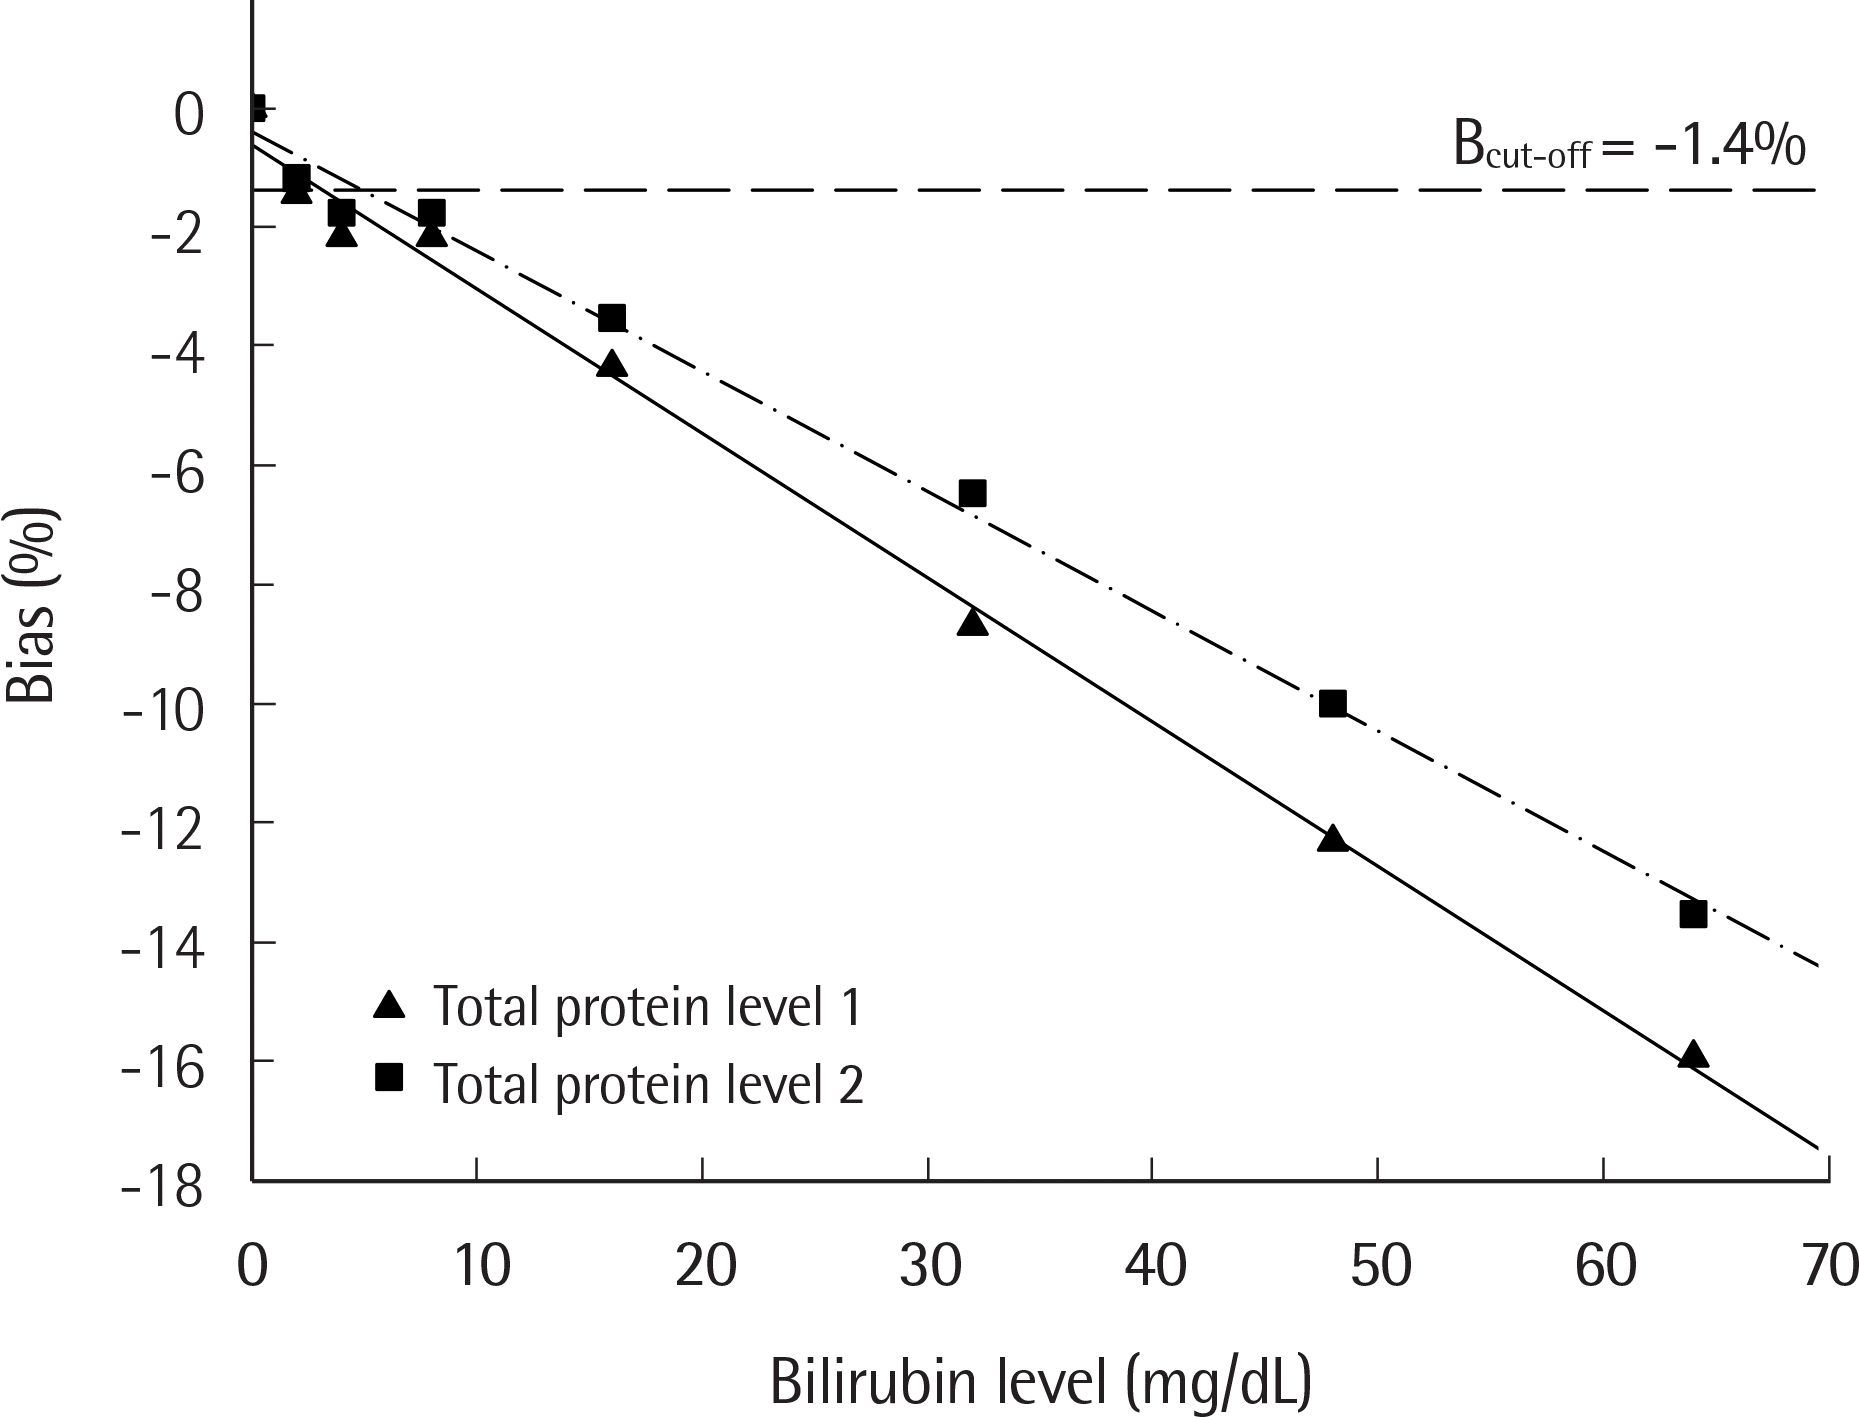 | Fig. 1.Bilirubin interference in the measurement of total protein. Analyte bias was plotted by linear regression analysis, and the interferent concentrations at which interference began were calculated with the desirable analytic goal (Bcutoff). |
Table 1.
The relationship between the concentration of the interfering substance and the corresponding HIL-index, according to manufacturer's specification
| HIL-index | Hemoglobin (mg/dL) | Bilirubin (mg/dL) | Intralipid (mg/dL) |
|---|---|---|---|
| 0 | <50 | <2.5 | <40 |
| 1 | 50-99 | 2.5-4.9 | 40-99 |
| 2 | 100-199 | 5.0-9.9 | 100-199 |
| 3 | 200-299 | 10-19.9 | 200-299 |
| 4 | 300-500 | 20-40 | 300-500 |
| 5 | >500 | >40 | >500 |
Table 2.
Average concentration of tested analytes and desirable bias cutoff criteria for interference
| Analyte | Unit | Average concentrations | Bcut- off(%) | Analyte | Unit | Average concentrations | Bcut- off(%) | ||
|---|---|---|---|---|---|---|---|---|---|
| Level 1 | Level 2 | Level 1 | Level 2 | ||||||
| Total protein | g/dL | 7 | 8.6 | 1.4 | LDH | IU/L | 146.8 | 332.3 | 4.3 |
| Albumin | g/dL | 4.1 | 4.7 | 1.6 | GGT | IU/L | 33.2 | 201.5 | 6.7 |
| Total bilirubin | mg/dL | 0.6 | 12.7 | 10.9 | Total calcium | mg/dL | 9 | 9.6 | 1.1 |
| Direct bilirubin | mg/dL | 0.2 | 8.2 | 18.4 | Amylase | IU/L | 65 | 363.3 | 4.4 |
| BUN | mg/dL | 18 | 45 | 6.1 | CK | IU/L | 62.2 | 1197.5 | 11.4 |
| Uric acid | mg/dL | 4.9 | 7.5 | 4.3 | Sodium | mEq/L | 143.8 | 148.8 | 0.3 |
| ALP | IU/L | 55.9 | 300.7 | 3.2 | Potassium | mEq/L | 4.5 | 4.9 | 2.3 |
| IP | mg/dL | 3.8 | 3.9 | 4.1 | Chloride | mEq/L | 106.2 | 115.7 | 0.6 |
| Magnesium | mg/dL | 2.1 | 2.7 | 1.8 | Iron | μg/dL | 90.5 | 147.2 | 13.3 |
| Triglyceride | mg/dL | 108.7 | 547.8 | 10.0 | UIBC | μg/dL | 209.5 | 384 | 10∗ |
| HDL | mg/dL | 42.7 | 67.5 | 3.7 | Total cholesterol | mg/dL | 176 | 279.7 | 3.0 |
| LDL | mg/dL | 105.2 | 180.3 | 3.9 | Bicarbonate | mmol/L | 16.1 | 27.6 | 2.0 |
| Lipase | IU/L | 24.5 | 427 | 16.1 | CRP | mg/L | 9.8 | 154.5 | 21.1 |
| Phospholipid | mg/dL | 188 | 262.5 | 3.3 | hs-CRP | mg/L | 10.6 | 30.4 | 24.9 |
| Glucose | mg/dL | 128 | 204.7 | 2.8 | Ethanol | mg/dL | 7.6 | 87.4 | 10∗ |
| Creatinine | mg/dL | 1.2 | 2.9 | 3.0 | Ammonia | μg/dL | 200 | 394 | 10∗ |
| AST | IU/L | 22.7 | 269.5 | 6.2 | KB | μmol/L | 85.5 | 479 | 10∗ |
| ALT | IU/L | 9.5 | 83.2 | 9.7 | |||||
Table 3.
Averages of reported H-, I-, and L-index according to interferent concentrations
Table 4.
Items affected by hemoglobin; comparing the H-indexTD obtained with AU5800 and the H-index calculated in this study for each analyte
| Analyte | H-indexTD | H-index1 | H-index2 |
|---|---|---|---|
| Increasing effect | |||
| Total protein | 4 | 1 | 2 |
| Albumin | 4 | 2 | 3 |
| IP | 4 | 5 | 4 |
| Magnesium | 2 | 0 | 0 |
| AST | NS∗ | 1 | 4 |
| ALT | 5 | 2 | 5 |
| LDH | NS∗ | 2 | 2 |
| Iron | 2 | 0 | 1 |
| Total cholesterol | 5 | 3 | 5 |
| Decreasing effect ALP | 5 | 3 | 5 |
| GGT | 3 | 2 | 4 |
| UIBC | 3 | 1 | 2 |
Table 5.
Items affected by bilirubin; comparing the I-indexTD obtained with AU5800 and the I-index calculated in this study for each analyte
| Analyte | I-indexTD | I-index1 | I-index2 |
|---|---|---|---|
| Increasing effect | |||
| Total bilirubin | NS∗ | 0 | 0 |
| Direct bilirubin | NS∗ | 0 | 0 |
| Magnesium | 4 | 2 | 3 |
| Ammonia | NS∗ | 5 | 5 |
| Decreasing effect | |||
| Total protein | 4 | 1 | 2 |
| Creatinine | 4 | 4 | 4 |
| Total cholesterol | 2 | 1 | 1 |
Table 6.
Items affected by Intralipid; comparing the L-indexTD obtained with AU5800 and the L-index calculated in this study for each analyte
| Analyte | L-indexTD | L-index1 | L-index2 |
|---|---|---|---|
| Increasing effect | |||
| Albumin | 5 | 1 | 3 |
| IP | 5 | 3 | 5 |
| Magnesium | 5 | 1 | 1 |
| Triglyceride | NS∗ | 0 | 1 |
| Phospholipid | NS∗ | 1 | 3 |
| Iron | 2 | 2 | 5 |
| Ammonia | NS∗ | 3 | 5 |
| Decreasing effect | |||
| Total protein | 5 | 2 | 4 |
| Uric acid | 5 | 4 | 5 |
| HDL | 5 | 2 | 4 |
| LDL | NS∗ | 1 | 2 |
| Creatinine | 5 | 0 | 5 |
 XML Download