Abstract
Background
Hemoglobin A1c (HbA1c) is considered a marker useful for the followup and diagnosis of diabetes and implies the importance of reliable assay methods that are traceable to a reference method. We evaluated analytical performance of a new high-performance liquid chromatography system for the HbA1c assay: D-100 from Bio-Rad Laboratories (USA).
Methods
We evaluated precision, linearity, and carry-over of D-100, according to the Clinical and Laboratory Standards Institute's guidelines. Comparative analysis of D-100 with Integra 800 (Roche Diagnostics, Germany) and Capillarys 3 (Sebia, France) was conducted. Additionally, we evaluated the throughput of the three instruments.
Results
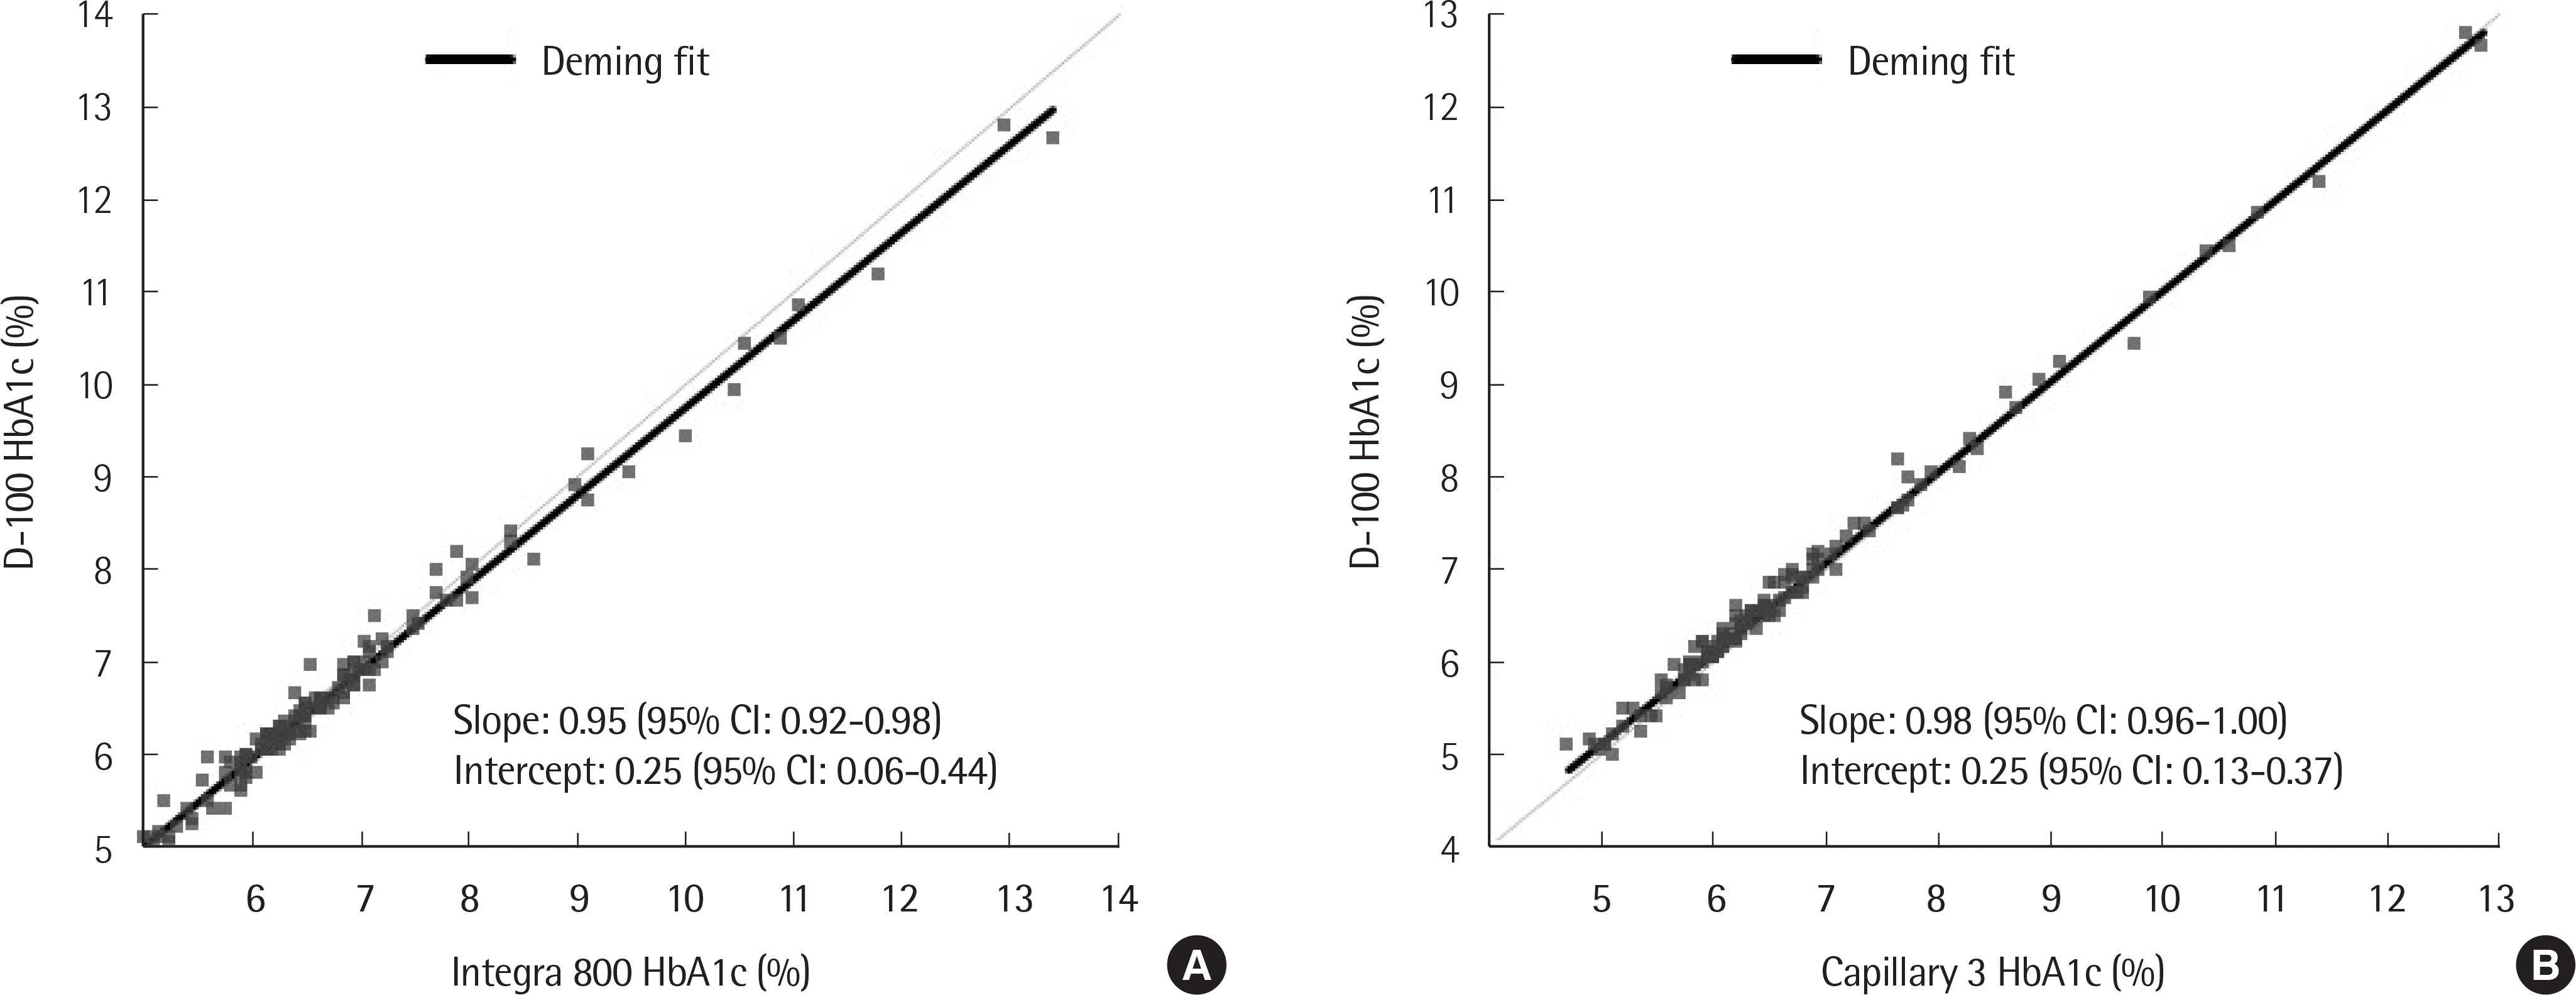
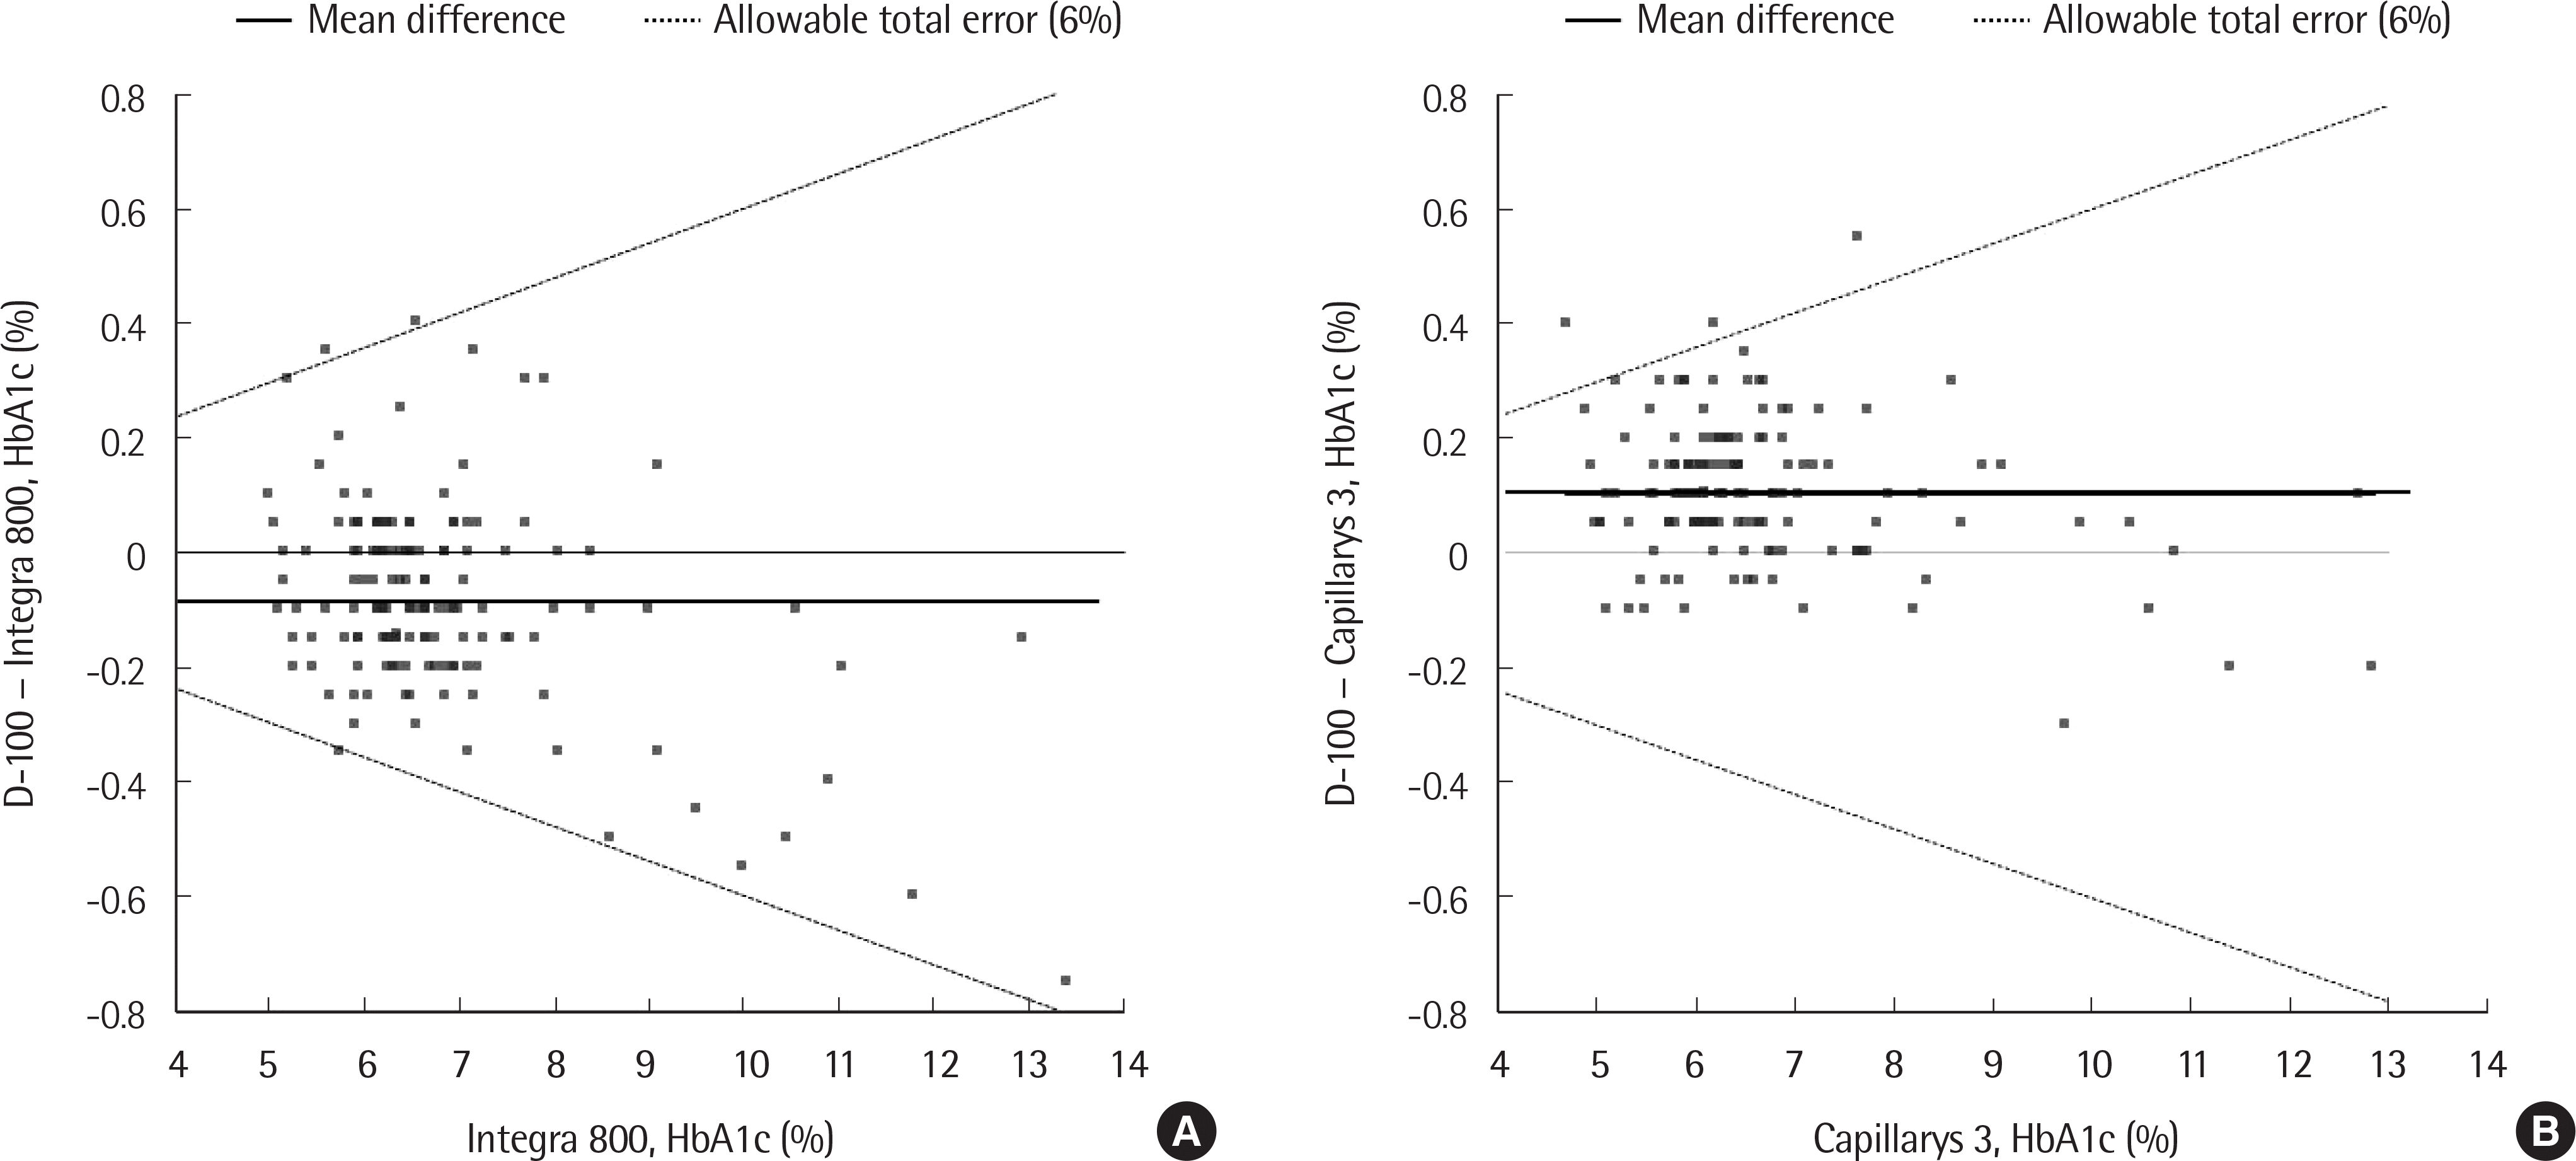
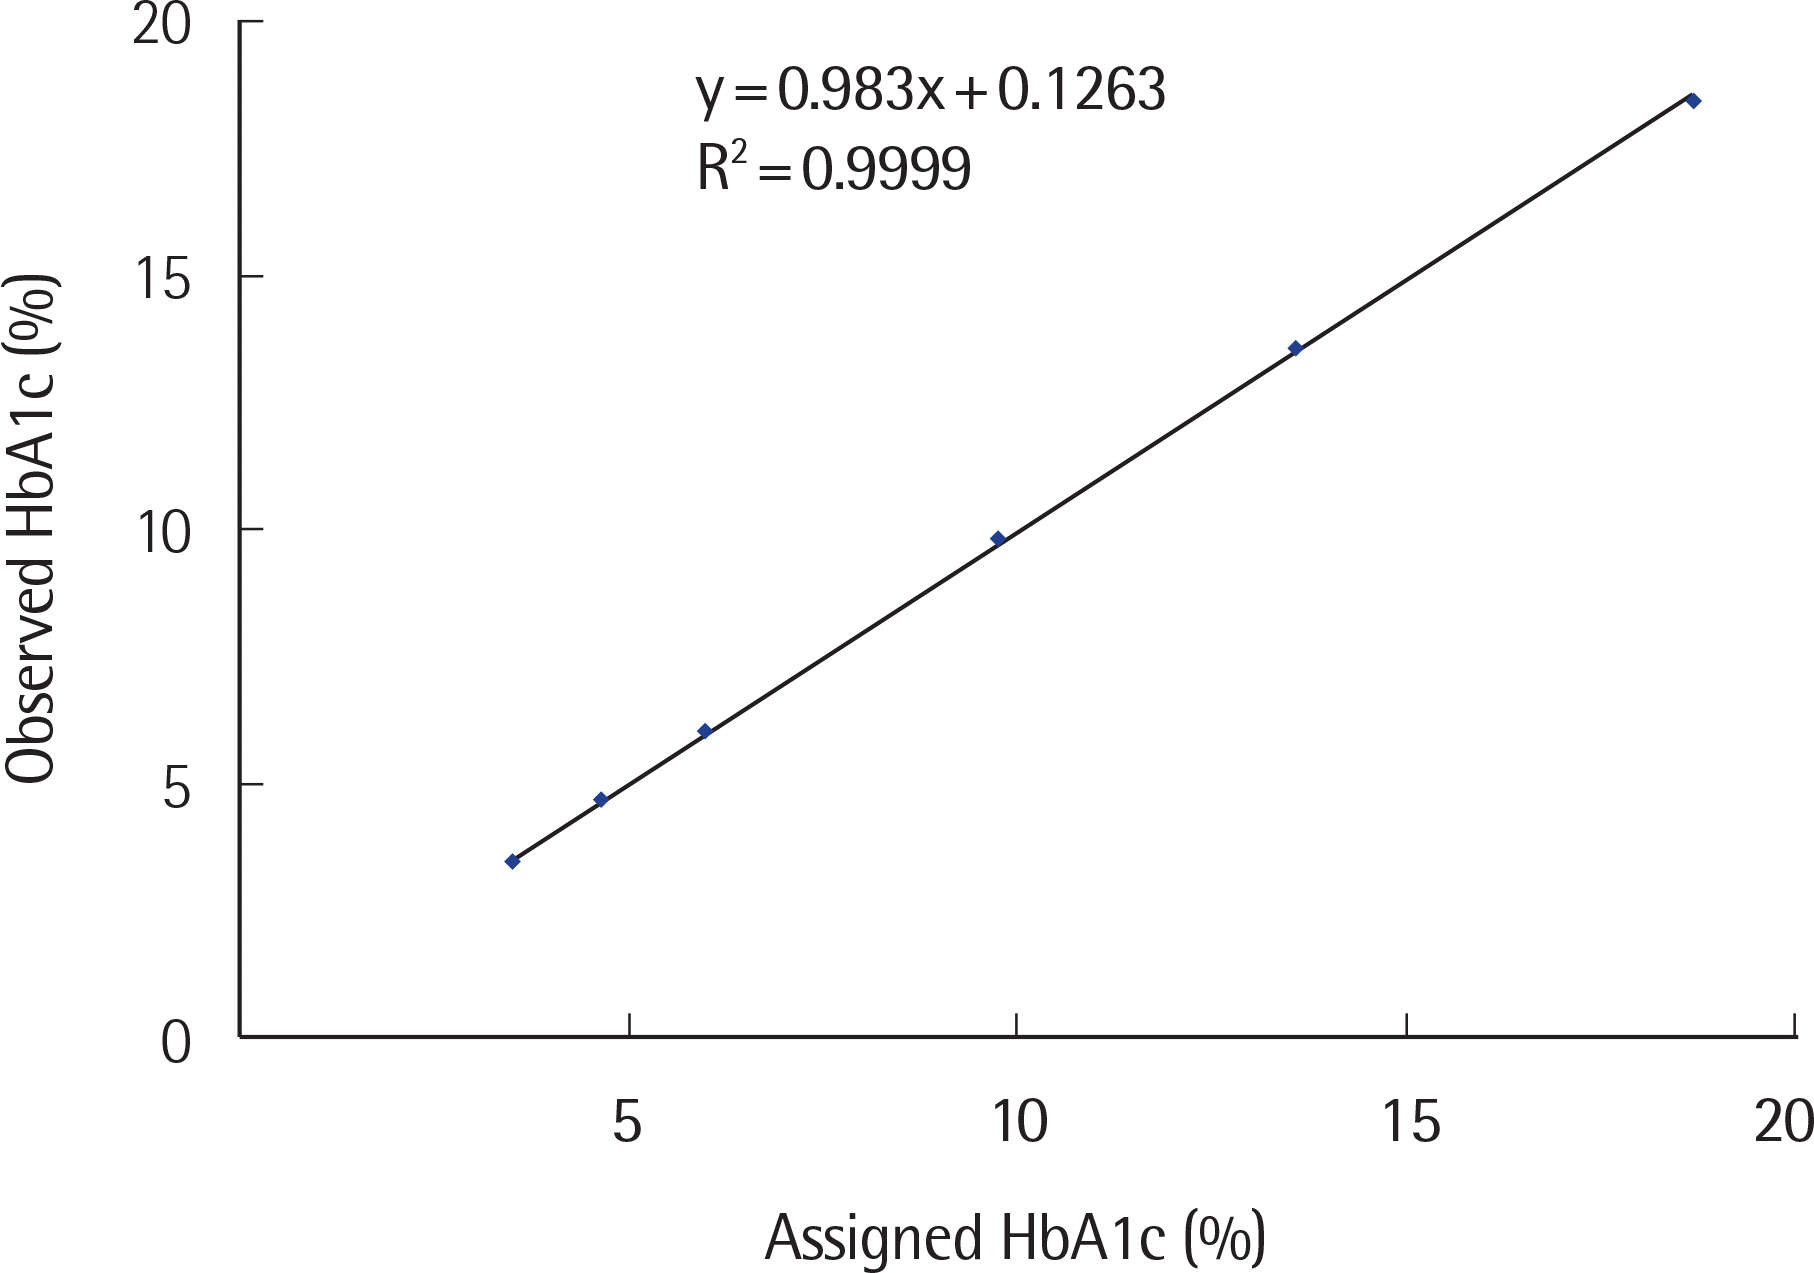
Precision of low- and high-concentration controls in D-100 showed a CV of less than 1%. The linearity was excellent (R2=0.999) in the range of 3.51-18.7%, and carry-over was not observed. HbA1c results of D-100 (n=144) showed good correlation with those of Integra 800 (r=0.993) and Capillarys 3 (r=0.996). The % bias between D-100 and Integra 800 or Capillarys 3 was within the allowable range at all 3 medical decision levels (5.7%, 6.5%, and 10.0%). Elapsed time in the analysis of the first sample by D-100 was shorter than that of Integra 800 (2.4 vs. 11.1 minutes), but subsequent samples took more time (0.8 vs. 0.3 minutes per sample).
Go to : 
REFERENCES
1. da Rocha Fernandes J, Ogurtsova K, Linnenkamp U, Guariguata L, Seuring T, Zhang P, et al. IDF Diabetes Atlas estimates of 2014 global health expenditures on diabetes. Diabetes Res Clin Pract. 2016; 117:48–54.

2. Guariguata L, Whiting DR, Hambleton I, Beagley J, Linnenkamp U, Shaw JE. Global estimates of diabetes prevalence for 2013 and projections for 2035. Diabetes Res Clin Pract. 2014; 103:137–49.

3. Bonora E, Tuomilehto J. The pros and cons of diagnosing diabetes with A1C. Diabetes Care. 2011; 34(S2):S184–90.

4. Yun WJ, Shin MH, Kweon SS, Park KS, Lee YH, Nam HS, et al. [A comparison of fasting glucose and HbA1c for the diagnosis of diabetes mellitus among Korean adults]. J Prev Med Public Health. 2010; 43:451–4.

5. Krishnamurti U, Steffes MW. Glycohemoglobin: a primary predictor of the development or reversal of complications of diabetes mellitus. Clin Chem. 2001; 47:1157–65.

6. Gerstein HC, Miller ME, Byington RP, Goff DC Jr, Bigger JT, Buse JB, et al. Effects of intensive glucose lowering in type 2 diabetes. N Engl J Med. 2008; 358:2545–59.

7. Standards of medical care in diabetes–2012. Diabetes Care. 2012; 35(S1):S11–63.
8. Nathan DM. Diabetes: advances in diagnosis and treatment. JAMA. 2015; 314:1052–62.
9. Lee H. The role of HbA1C testing in diagnosing diabetes. Korean J Med. 2010; 79:495–9.
10. Gillett MJ. International Expert Committee report on the role of the A1c assay in the diagnosis of diabetes: Diabetes Care. 2009; 32(7):): 1327-1334. Clin Biochem Rev 2009;30:. 197–200.
11. Little RR. Glycated hemoglobin standardization–National Glycohemoglobin Standardization Program (NGSP) perspective. Clin Chem Lab Med. 2003; 41:1191–8.

12. Weykamp C, John WG, Mosca A, Hoshino T, Little R, Jeppsson JO, et al. The IFCC Reference Measurement System for HbA1c: a 6-year progress report. Clin Chem. 2008; 54:240–8.

14. Braga F, Panteghini M. Standardization and analytical goals for glycated hemoglobin measurement. Clin Chem Lab Med. 2013; 51:1719–26.

15. Diagnosis and classification of diabetes mellitus. Diabetes Care. 2010; 33(S1):S62–9.
16. Standards of medical care in diabetes–2010. Diabetes Care. 2010; 33(S1):S11–61.
17. Icks A, Haastert B, Gandjour A, John J, Lowel H, Holle R, et al. Cost-effectiveness analysis of different screening procedures for type 2 diabetes: the KORA Survey 2000. Diabetes Care. 2004; 27:2120–8.
18. Chung S, Jun SH, Song WH, Song J. Six Years’ Experience of accuracy-based proficiency testing for HbA1c in Korea. J Lab Med Qual Assur. 2015; 37:92–100.
19. Braga F, Dolci A, Montagnana M, Pagani F, Paleari R, Guidi GC, et al. Revaluation of biological variation of glycated hemoglobin (HbA(1c)) using an accurately designed protocol and an assay traceable to the IFCC reference system. Clin Chim Acta. 2011; 412:1412–6.

20. Clinical and Laboratory Standards Institute. Evaluation of precision performance of quantitative measurement methods; approved guideline. 2nd ed.EP5-A2. Wayne, PA: Clinical and Laboratory Standards Institute;2004.
21. Clinical and Laboratory Standards Institute. Evaluation of the linearity of quantitative measurement procedures: a statistical approach; approved guideline. EP6-A. Wayne, PA: Clinical and Laboratory Standards Institute. 2003.
22. Clinical and Laboratory Standards Institute. Method comparison and bias estimation using patient samples; approved guideline. EP9-A2. Wayne, PA: Clinical and Laboratory Standards Institute. 2002.
23. Lee JY, Hong KS, Cho SE. [Comparison of HbA1c analyzers: D-10, Variant II Turbo, Cobas Integra 800, and Afinion AS100]. Korean J Lab Med. 2010; 30:345–50.

24. Clinical and Laboratory Standards Institute. Harmonization of glycohemoglobin measurements; approved guideline. C44-A. Wayne, PA: Clinical and Laboratory Standards Institute. 2002.
25. Sacks DB, Arnold M, Bakris GL, Bruns DE, Horvath AR, Kirkman MS, et al. Executive summary: guidelines and recommendations for laboratory analysis in the diagnosis and management of diabetes mellitus. Clin Chem. 2011; 57:793–8.

26. Jaisson S, Leroy N, Guillard E, Desmons A, Gillery P. Analytical performances of the D-100TM hemoglobin testing system (Bio-Rad) for HbA1c assay. Clin Chem Lab Med. 2015; 53:1473–9.

27. Woodworth A, Korpi-Steiner N, Miller JJ, Rao LV, Yundt-Pacheco J, Kuchi-pudi L, et al. Utilization of assay performance characteristics to estimate hemoglobin A1c result reliability. Clin Chem. 2014; 60:1073–9.

28. Fleming JK. Evaluation of HbA1c on the Roche COBAS Integra 800 closed tube system. Clin Biochem. 2007; 40:822–7.

29. Herpol M, Lanckmans K, Van Neyghem S, Clement P, Crevits S, De Crem K, et al. Evaluation of the Sebia Capillarys 3 Tera and the Bio-Rad D-100 systems for the measurement of hemoglobin A1c. Am J Clin Pathol. 2016; 146:67–77.

30. Rohlfing CL, Parvin CA, Sacks DB, Little RR, Committee NS. Comparing analytic performance criteria: evaluation of HbA1c certification criteria as an example. Clin Chim Acta. 2014; 433:259–63.

31. Little RR. Performance of hemoglobin A1c assay methods: good enough? Clin Chem. 2014; 60:1031–3.

Go to : 
 | Fig. 2.A Deming regression plot for D-100 and Integra 800 (A) and for D-100 and Capillarys 3 (B). Abbreviation: CI, confidence interval. |
 | Fig. 3.A Bland-Altman difference plot for D-100 and Integra 800 (A) and for D-100 and Capillarys 3 (B). |
Table 1.
Precision of HbA1c measurements using D-100
| Material | Mean HbA1c (%) | Coefficient of variation (%) | |||
|---|---|---|---|---|---|
| Within-run | Between-run | Between-day | Within-device | ||
| Level 1 | 5.38 | 0.69 | 0.23 | 0.46 | 0.86 |
| Level 2 | 9.87 | 0.59 | 0.30 | 0.45 | 0.68 |
Table 2.
Recovery of commercial HbA1c linearity materials tested on D-100
Table 3.
Comparison of HbA1c values obtained by means of D-100, Integra 800, and Capillarys 3 using Deming regression
Table 4.
Analytical time of D-100, Integra 800, and Capillarys 3
| Initial sample | Following sample | Initial to continuous 10 samples | Initial to continuous 60 samples | |
|---|---|---|---|---|
| Bio-Rad D-100 (min) | 2.4 | 0.8 | 9.4 | 46.1 |
| Roche Integra 800 (min) | 11.1 | 0.3 | 13.9 | 31.3 |
| Sebia Capillarys 3 (min)∗ | 23.0† | 11.4† | 23.0† | 72.0 |
| ∗Sebia Capillarys 3 processes samples. | 12 samples as | s a unit; †Tim | me for measur | rement of 12 |


 PDF
PDF ePub
ePub Citation
 Print
Print


 XML Download